Comparative Study
. 2017 Apr 15;525(6):1403-1420.
doi: 10.1002/cne.23998. Epub 2016 Mar 29.

Synaptic organization of striate cortex projections in the tree shrew: A comparison of the claustrum and dorsal thalamus

Affiliations
Comparative Study

Synaptic organization of striate cortex projections in the tree shrew: A comparison of the claustrum and dorsal thalamus

Jonathan D Day-Brown et al. J Comp Neurol. .

Abstract

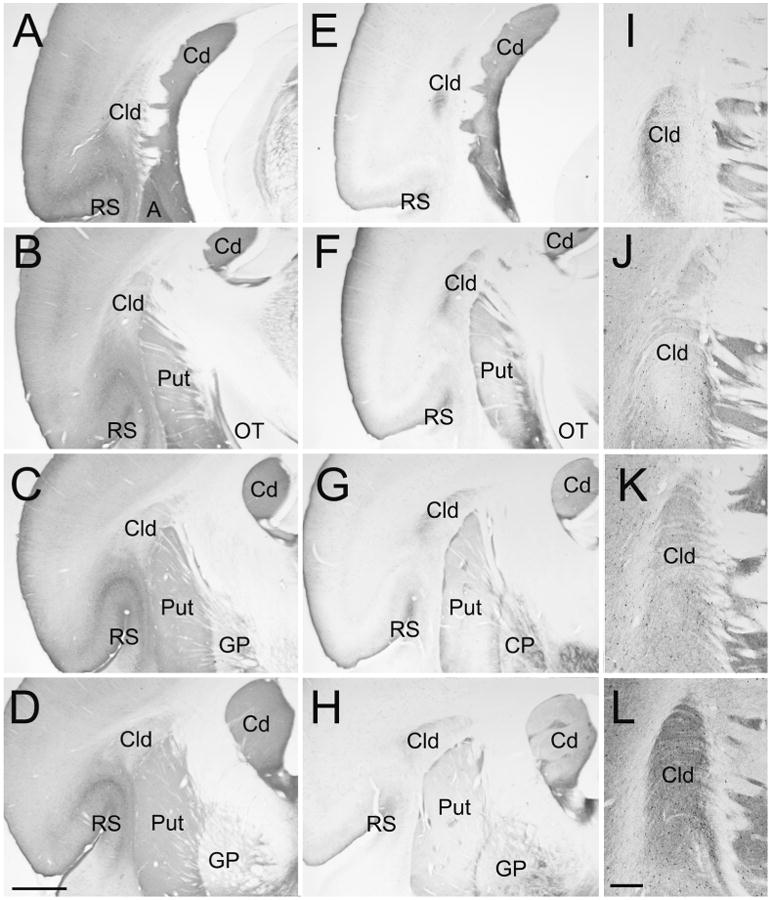
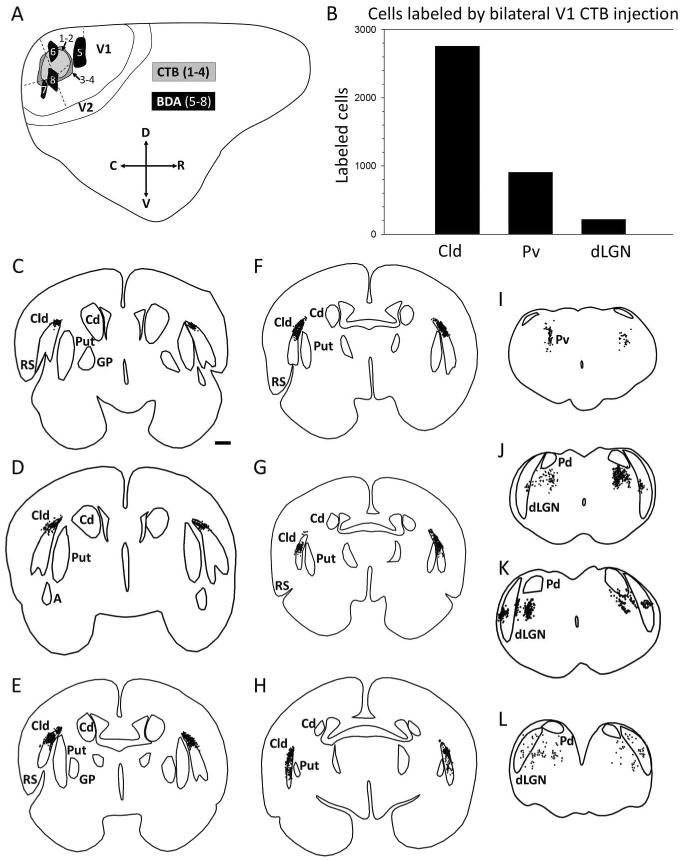
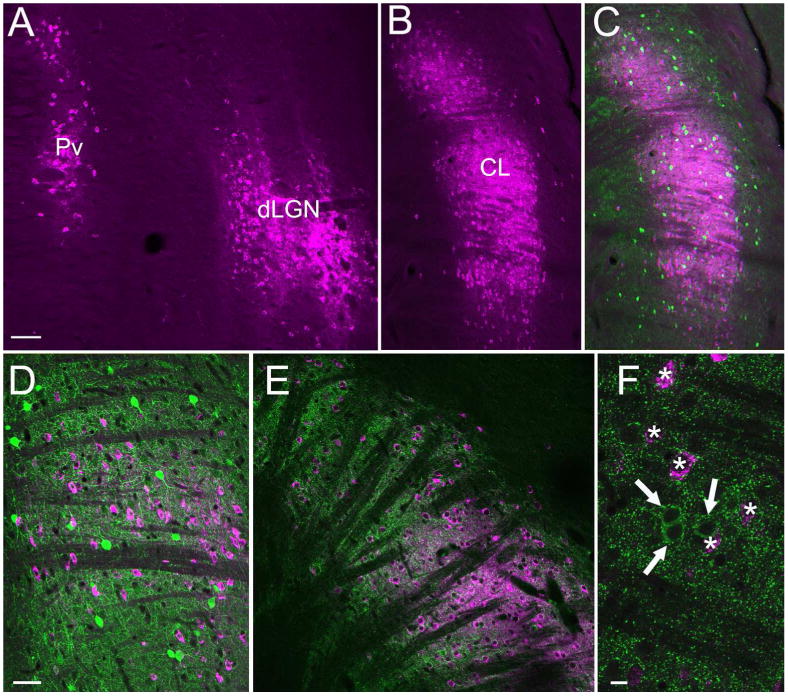
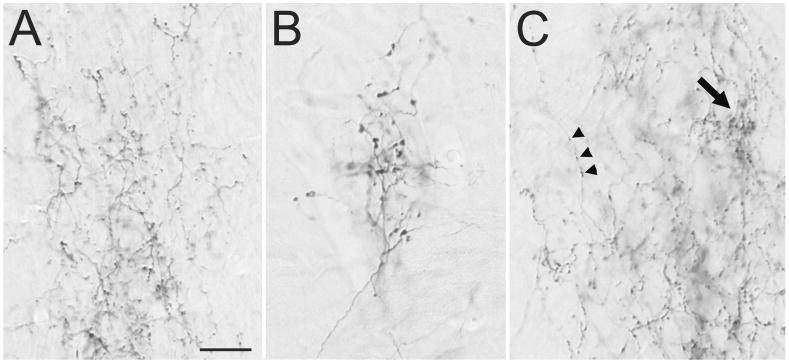
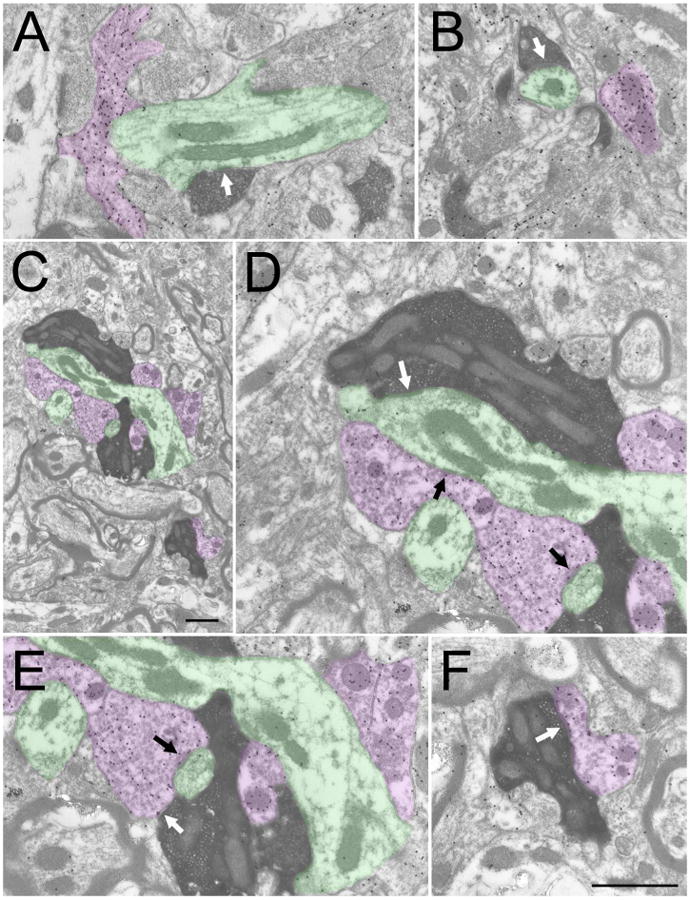
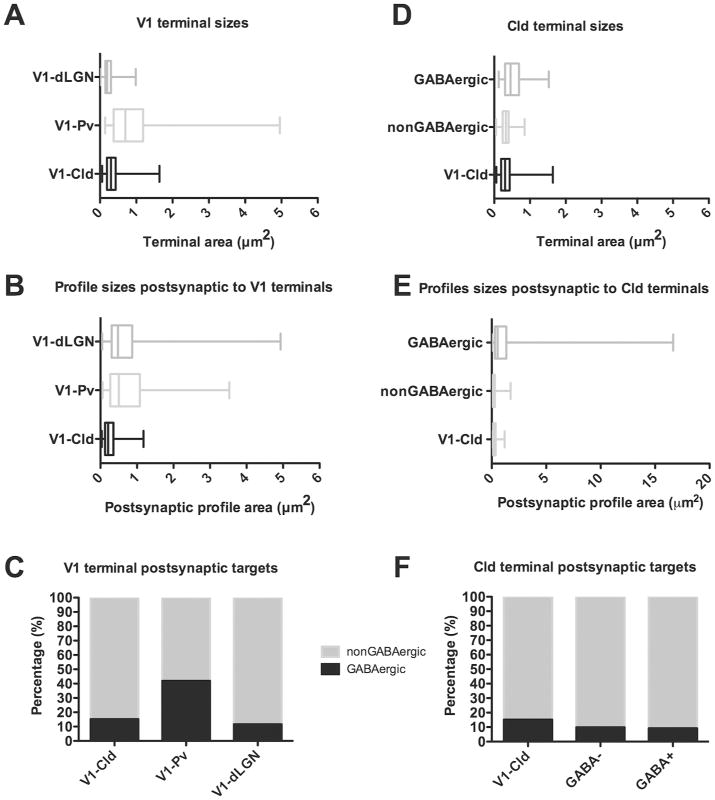
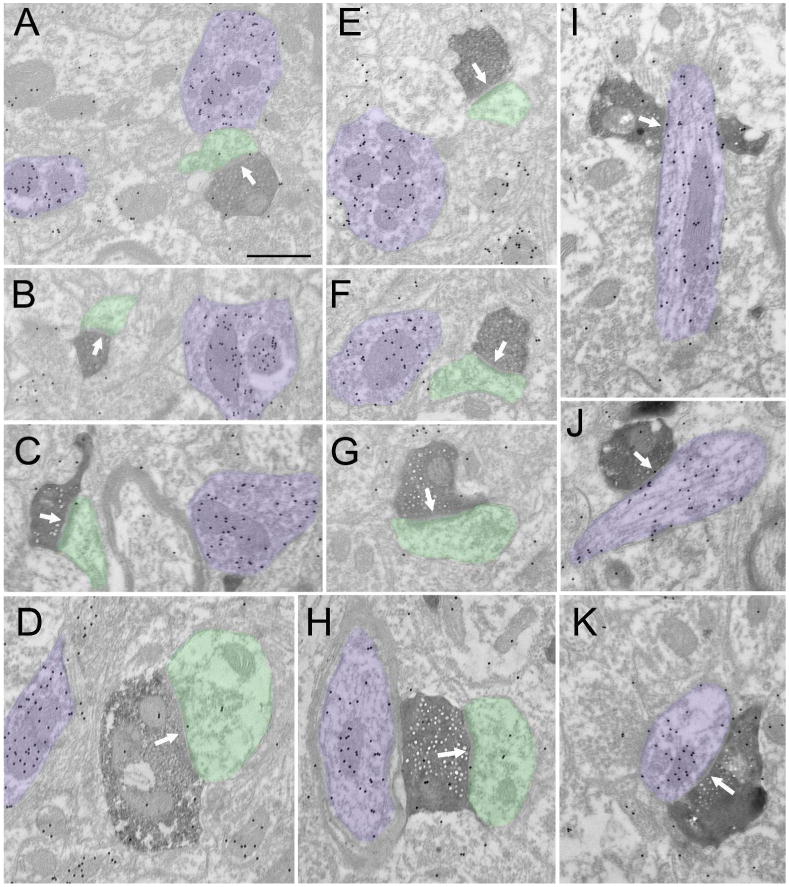
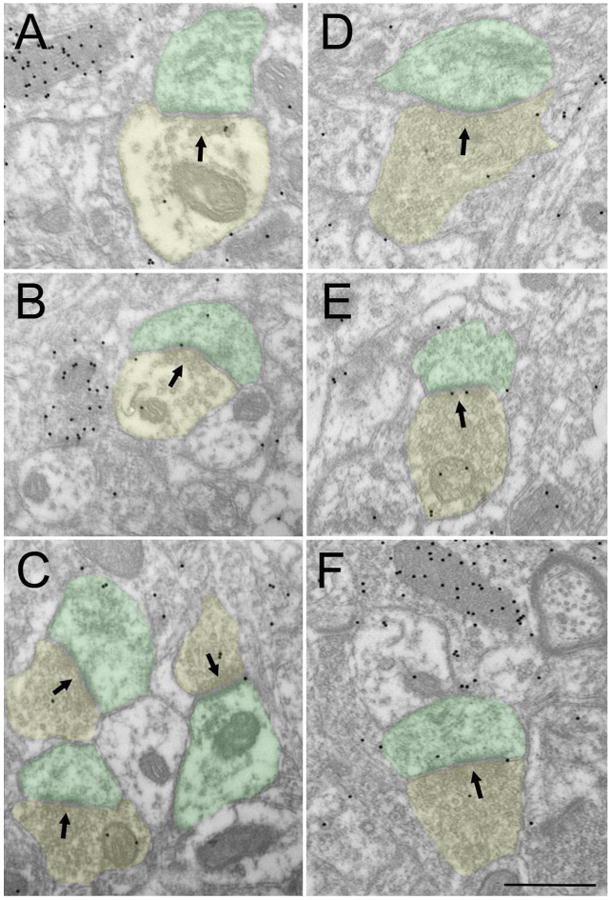
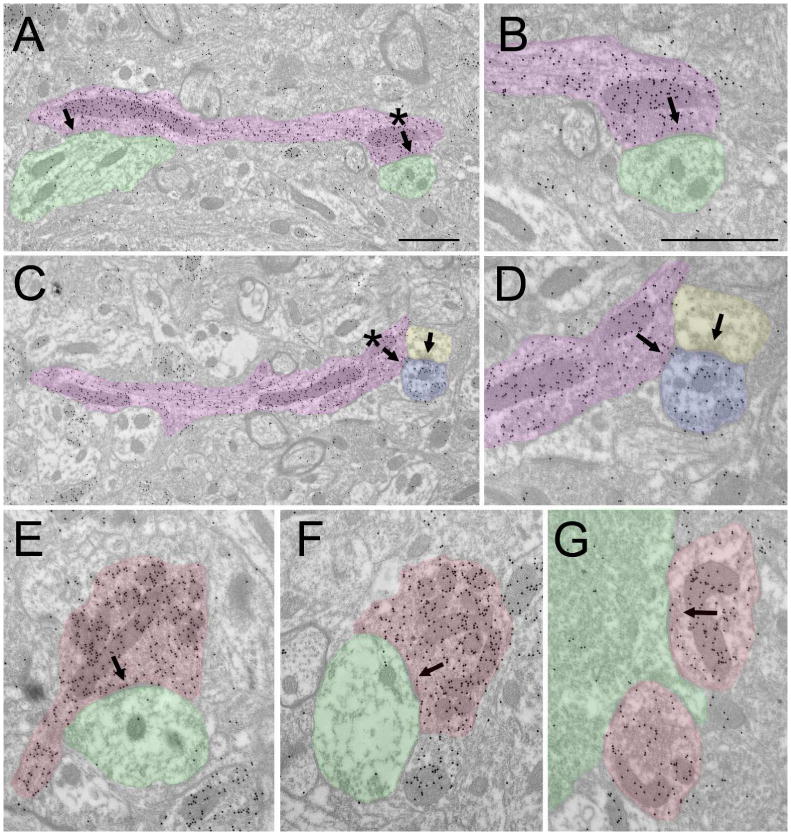
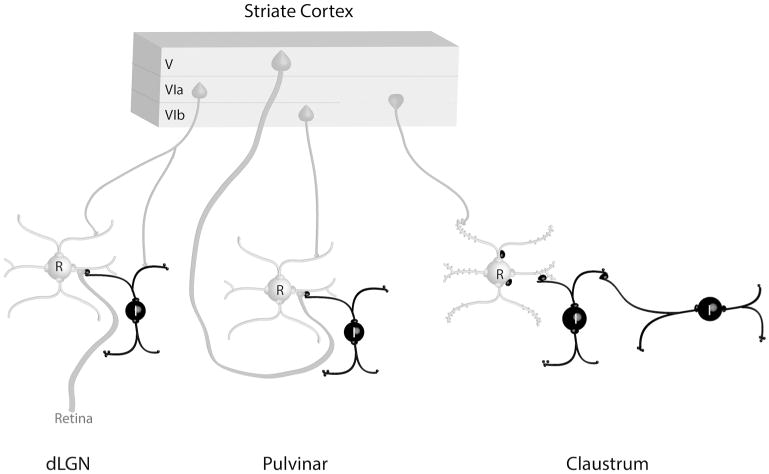
The tree shrew (Tupaia belangeri) striate cortex is reciprocally connected with the dorsal lateral geniculate nucleus (dLGN), the ventral pulvinar nucleus (Pv), and the claustrum. In the Pv or the dLGN, striate cortex projections are thought to either strongly "drive", or more subtly "modulate" activity patterns respectively. To provide clues to the function of the claustrum, we compare the synaptic arrangements of striate cortex projections to the dLGN, Pv, and claustrum, using anterograde tracing and electron microscopy. Tissue was additionally stained with antibodies against γ-aminobutyric acid (GABA) to identify GABAergic interneurons and non-GABAergic projection cells. The striate cortex terminals were largest in the Pv (0.94 ± 0.08 μm2 ), intermediate in the claustrum (0.34 ± 0.02 μm2 ), and smallest in the dLGN (0.24 ± 0.01 μm2 ). Contacts on interneurons were most common in the Pv (39%), intermediate in the claustrum (15%), and least common in the dLGN (12%). In the claustrum, non-GABAergic terminals (0.34 ± 0.01 μm2 ) and striate cortex terminals were not significantly different in size. The largest terminals in the claustrum were GABAergic (0.51 ± 0.02 μm2 ), and these terminals contacted dendrites and somata that were significantly larger (1.90 ± 0.30 μm2 ) than those contacted by cortex or non-GABAergic terminals (0.28 ± 0.02 μm2 and 0.25 ± 0.02 μm2 , respectively). Our results indicate that the synaptic organization of the claustrum does not correspond to a driver/modulator framework. Instead, the circuitry of the claustrum suggests an integration of convergent cortical inputs, gated by GABAergic circuits. J. Comp. Neurol. 525:1403-1420, 2017. © 2016 Wiley Periodicals, Inc.

Keywords: GABA; RRID:AB_2278725; RRID:AB_2333091; RRID:AB_258833; RRID:AB_477329; RRID:AB_477652; RRID:AB_572256; RRID:AB_94259; RRID:nif-000-30467; corticoclaustral; corticothalamic; dorsal lateral geniculate nucleus; pulvinar; retinogeniculate; synapse.


Conflict of interest statement

The authors have no known conflicts of interest that could inappropriately influence this work.

Figures

Figure 1
Figure 1. Cytoarchitecture of the tree shrew dorsal claustrum (Cld)
Sections stained with antibodies against calretinin (A-D, and J), substance P (E-H, and I), neuronal nitric oxide synthase (K), and parvalbumin (L) illustrate the location and staining characteristics of the Cld. Sections are all from the same animal. Sections A-D and E-H are arranged from caudal (A, E) to rostral (D, H) at intervals of 600 μm. Sections I-L are adjacent sections through the Cld arranged caudal (I) to rostral (L). A, amygdala, Cd, caudate nucleus, GP, globus pallidus, OT, optic tract, Put, putamen, RS, rhinal sulcus. Scale in D = 1 mm and applies to A-H. Scale in L = 250 μm and applies to I-L.
Figure 2
Figure 2. Distribution of claustrum and thalamus cells that project to V1
A) Diagrammatic representation of one cerebral hemisphere illustrates the placement of neuroanatomical tracer injections in V1. Locations of injections of the beta subunit of cholera toxin (CTB, labeled 1 – 4) were made to examine the distribution of cells projecting to V1 from dorsal claustrum (Cld), ventral pulvinar (Pv) and dorsal lateral geniculate nucleus (dLGN). Injections of biotinylated dextran amine (BDA, labeled 5 – 8) were placed in V1 to reveal the projections of V1 to Cld, Pv and dLGN. B) Histogram plotting the number of cells labeled in Cld. Pv and dLGN following bilateral CTB injection. C-L) Coronal sections (arranged rostral to caudal) show plots of cells labeled in one case as a result of bilateral CTB injections in V1. Black dots represent labeled cells. (Scale bar in C = 1 mm and applies to C – L. C, caudal; Cd; caudate; D, dorsal; GP, globus pallidus; Put, putamen, R, rostral; RS, rhinal sulcus; V, ventral.
Figure 3
Figure 3. Claustrum cells that project to V1 are nonGABAergic and do not contain parvalbumin
Cells (purple) labeled by CTB injections in V1 are illustrated in confocal images (50 μm stacks) of the thalamus (A) and claustrum (B). Sections containing CTB-labeled claustrum cells were stained with antibodies against parvalbumin (green, C, 50 μm confocal stack and D, single 2 um optical section) or GAD (green, E, 25 μm confocal stack and F, single 1 μm optical section). No CTB-labeled claustrum cells were stained with antibodies against parvalbumin or GAD. Scale in A = 100 μm and also applies B and C. Scale in D = 50 μm and also applies to E. Scale in F = 10 μm.
Figure 4
Figure 4. Morphology of V1 projections to the thalamus and claustrum
Light micrographs illustrate the morphology of axons labeled by an injection of biotinylated dextran amine in V1. A) V1 axons in the dorsal lateral geniculate nucleus form small boutons. B) V1 axons in the ventral pulvinar nucleus form clusters of large boutons. C) V1 axons in the dorsal claustrum form small boutons along thin axons (arrowheads), or dense clusters of slightly larger boutons (arrow). Scale = 20 μm and applies to all panels.
Figure 5
Figure 5. Ultrastructure of V1 projections to the thalamus
Electron micrographs illustrate the ultrastructure of corticothalamic terminals (dark reaction product) labeled by an injection of biotinylated dextran amine in V1. The tissue was additionally stained to reveal GABAergic (high density of gold particles, purple) and nonGABAergic (low density of gold particles, green) profiles. V1 terminals in the dorsal lateral geniculate nucleus (A and B) form small boutons that primarily contact (white arrows) small nonGABAergic dendrites. V1 terminals in the ventral pulvinar (Pv) nucleus (C) form large boutons that contact GABAergic and nonGABAergic dendrites in complex arrangements. A large V1-Pv terminal and associated GABAergic and nonGABAergic profiles is illustrated in (C, scale = 1 μm). The synaptic contacts (white arrows) of this terminal are illustrated at higher magnification in D (nonGABAergic dendrite), E and F (GABAergic dendritic terminals, F2 profiles). Synapses formed by associated GABAergic profiles are indicated by black arrows (D and E). Scale in F = 1 μm and applies to A, B, D-F.
Figure 6
Figure 6. Quantification of circuits in the dLGN, Pv and Cld
A) Box and whisker plots illustrate the sizes of terminals in the dLGN (n=207), Pv (n= 101) and Cld (n=189) that originate from V1. The vertical bar within each box indicates the mean terminal size, the box boundaries indicate the lower and upper quartiles (25% and 75%), and the horizontal lines (“whiskers”) indicate the full range of terminal sizes. The sizes of V1-dLGN, V1-Pv and V1-Cld terminals were significantly different from one another (Mann Whitney, p < 0.0001). B) Box and whisker plots illustrate the size of profiles postsynaptic to dLGN (n=207), Pv (n=131) and Cld (n=191) terminals that originate from V1. There was no significant difference between the size of dendrites postsynaptic to V1-dLGN and V1-Pv terminals (p = 0.7296), but dendrites postsynaptic to V1-Cld terminals were significantly smaller than dendrites postsynaptic to either V1-dLGN or V1-Pv terminals (p < 0.0001). C) Stacked histograms illustrate the percentage of GABAergic (black) and nonGABaergic (gray) profiles postsynaptic to V1-dLGN, V1-Pv and V1-Cld terminals. D) Box and whisker plots illustrate the sizes of V1-Cld terminals (n=189), the overall population of nonGABAergic terminals (n=244), and the overall population of GABAergic terminals (n=119) in the Cld. There was no significant difference between the size V1-Cld terminals and nonGABAergic terminals (p= 0.2111), but GABAergic terminals were significantly larger than both V1-Cld terminals and nonGABAergic terminals (p < 0.0001). E) Box and whisker plots illustrate the size of profiles postsynaptic V1-Cld terminals (n=191), the overall population of nonGABAergic terminals (n=244), and the overall population of GABAergic terminals (n=119) in the Cld. Profiles postsynaptic to V1-Cld terminals were significantly larger than profiles postsynaptic to nonGABAergic terminals (n = 0.0174), and dendrites postsynaptic to GABAergic terminals were significantly larger than dendrites postsynaptic to either V1-Cld or nonGABAergic terminals (p < 0.0001). F) Stacked histograms illustrate the percentage of GABAergic (black) and nonGABaergic (gray) profiles postsynaptic to V1-Cld, nonGABAergic (GABA-), and GABAergic (GABA+) terminals in the Cld.
Figure 7
Figure 7. Ultrastructure of V1 projections to the claustrum
Electron micrographs illustrate the ultrastructure of corticoclaustral terminals (dark reaction product) labeled by an injection of biotinylated dextran amine in V1. The tissue was additionally stained to reveal GABAergic (high density of gold particles, purple) and nonGABAergic (low density of gold particles, green) profiles. Corticoclaustral primarily contact (white arrows) small nonGABAergic dendrites (A-H), but a small percentage (15%) contact GABAergic dendrites (I-K). Scale = 0.5 μm and applies to all panels.
Figure 8
Figure 8. nonGABAergic terminal types in the claustrum
Electron micrographs illustrate the ultrastructure of nonGABAergic terminals (low density of gold particles, yellow) in the claustrum. NonGABAergic terminals contain sparse (A, B) or dense (C-F) vesicles and primarily contact (black arrows) small nonGABAergic dendrites (green). Scale = 0.5 μm and applies to all panels.
Figure 9
Figure 9. GABAergic terminal types in the claustrum
Electron micrographs illustrate the ultrastructure of GABAergic terminals (high density of gold particles) in the claustrum. GABAergic terminals that originate from dendrites (A-D, purple) contain vesicles that are clustered near synapses (arrows, asterisks in A and C indicate synapses shown at higher magnification in C and D). GABAergic dendritic terminals contact nonGABAergic dendrites (A, B, green) or GABAergic dendrites (B, D, blue; this dendrite also receives input from a nonGABAergic terminal, yellow). GABAergic terminals that presumably arise from axons (E-G, red) primarily contact nonGABAergic dendrites (E-F, green) and somata (G, green). Scale bar = 1 μm. Scale in A also applies to C. Scale in B also applies to D-G.
Figure 10
Figure 10. Schematic summary of circuits in the visual thalamus and claustrum
The schematic summary illustrates the contribution of terminals that originate from the tree shrew striate cortex to synaptic circuits in the dorsal lateral geniculate (dLGN), pulvinar nucleus, and claustrum. Interneurons (I) and other elements that contain gamma amino butyric acid (GABA) are black. Thalamocortical and claustrocortical cells (relay cells, R), and other elements that are nonGABAergic, are gray. Circuits identified in the claustrum suggest an integration of convergent cortical inputs, gated by GABAergic circuits. See text for details.

References

    1. Baizer JS, Sherwood CC, Noonan M, Hof PR. Comparative organization of the claustrum: what does structure tell us about function? Front Syst Neurosci. 2014;8:117. - PMC - PubMed
    1. Bickford ME, Carden WB, Patel NC. Two types of interneurons in the cat visual thalamus are distinguished by morphology, synaptic connections, and nitric oxide synthase content. J Comp Neurol. 1999;413:83–100. - PubMed
    1. Bickford ME, Wei H, Eisenback Ma, Chomsung RD, Slusarczyk AS, Dankowski AB. Synaptic organization of thalamocortical axon collaterals in the perigeniculate nucleus and dorsal lateral geniculate nucleus. J Comp Neurol. 2008;508:264–285. - PMC - PubMed
    1. Bickford ME, Zhou N, Krahe TE, Govindaiah G, Guido W. Retinal and Tectal “Driver-Like” Inputs Converge in the Shell of the Mouse Dorsal Lateral Geniculate Nucleus. J Neurosci. 2015;35:10523–10534. - PMC - PubMed
    1. Bickford ME. Thalamic circuit diversity: modulation of the driver/modulator framework. Frontiers in Neural Circuits. 2016;9:86. doi: 10.3389/fncir.2015.00086. - DOI - PMC - PubMed

Publication types