Holliday Junction Thermodynamics and Structure: Coarse-Grained Simulations and Experiments
- PMID: 26971574
- PMCID: PMC4789735
- DOI: 10.1038/srep22863
Holliday Junction Thermodynamics and Structure: Coarse-Grained Simulations and Experiments
Abstract
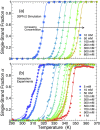
Holliday junctions play a central role in genetic recombination, DNA repair and other cellular processes. We combine simulations and experiments to evaluate the ability of the 3SPN.2 model, a coarse-grained representation designed to mimic B-DNA, to predict the properties of DNA Holliday junctions. The model reproduces many experimentally determined aspects of junction structure and stability, including the temperature dependence of melting on salt concentration, the bias between open and stacked conformations, the relative populations of conformers at high salt concentration, and the inter-duplex angle (IDA) between arms. We also obtain a close correspondence between the junction structure evaluated by all-atom and coarse-grained simulations. We predict that, for salt concentrations at physiological and higher levels, the populations of the stacked conformers are independent of salt concentration, and directly observe proposed tetrahedral intermediate sub-states implicated in conformational transitions. Our findings demonstrate that the 3SPN.2 model captures junction properties that are inaccessible to all-atom studies, opening the possibility to simulate complex aspects of junction behavior.
Figures


Similar articles
-
The self-assembly of DNA Holliday junctions studied with a minimal model.J Chem Phys. 2009 Feb 14;130(6):065101. doi: 10.1063/1.3055595. J Chem Phys. 2009. PMID: 19222299
-
Conformational model of the Holliday junction transition deduced from molecular dynamics simulations.Nucleic Acids Res. 2004 Dec 21;32(22):6683-95. doi: 10.1093/nar/gkh1006. Print 2004. Nucleic Acids Res. 2004. PMID: 15613597 Free PMC article.
-
Helix-coil transition of a four-way DNA junction observed by multiple fluorescence parameters.J Phys Chem B. 2008 Oct 16;112(41):13136-48. doi: 10.1021/jp8034055. Epub 2008 Sep 24. J Phys Chem B. 2008. PMID: 18811195
-
The stacked-X DNA Holliday junction and protein recognition.J Mol Recognit. 2006 May-Jun;19(3):234-242. doi: 10.1002/jmr.765. J Mol Recognit. 2006. PMID: 16575941 Free PMC article. Review.
-
Structure of the Holliday junction: applications beyond recombination.Biochem Soc Trans. 2017 Oct 15;45(5):1149-1158. doi: 10.1042/BST20170048. Epub 2017 Aug 24. Biochem Soc Trans. 2017. PMID: 28842529 Review.
Cited by
-
Organometallic Pillarplexes That Bind DNA 4-Way Holliday Junctions and Forks.J Am Chem Soc. 2023 Jun 28;145(25):13570-13580. doi: 10.1021/jacs.3c00118. Epub 2023 Jun 15. J Am Chem Soc. 2023. PMID: 37318835 Free PMC article.
-
Coarse-grained modelling of the structural properties of DNA origami.Nucleic Acids Res. 2019 Feb 20;47(3):1585-1597. doi: 10.1093/nar/gky1304. Nucleic Acids Res. 2019. PMID: 30605514 Free PMC article.
-
Molecular Mechanisms of DNA Replication and Repair Machinery: Insights from Microscopic Simulations.Adv Theory Simul. 2019 May;2(5):1800191. doi: 10.1002/adts.201800191. Epub 2019 Feb 12. Adv Theory Simul. 2019. PMID: 31728433 Free PMC article.
-
The influence of Holliday junction sequence and dynamics on DNA crystal self-assembly.Nat Commun. 2022 Jun 3;13(1):3112. doi: 10.1038/s41467-022-30779-6. Nat Commun. 2022. PMID: 35662248 Free PMC article.
-
Kinetics and dynamics of oligonucleotide hybridization.Nat Rev Chem. 2025 May;9(5):305-327. doi: 10.1038/s41570-025-00704-8. Epub 2025 Apr 11. Nat Rev Chem. 2025. PMID: 40217001 Review.
References
-
- Lilley D. M. J. Structures of helical junctions in nucleic acids. Quart. Rev. Biophys. 33, 109–159 (2000). - PubMed
Publication types
MeSH terms
Substances
Grants and funding
LinkOut - more resources
Full Text Sources
Other Literature Sources

