. 2016 Mar 14:5:e14120.
doi: 10.7554/eLife.14120.

Modulation of anxiety and fear via distinct intrahippocampal circuits

Affiliations

Modulation of anxiety and fear via distinct intrahippocampal circuits

Elif Engin et al. Elife. .

Abstract

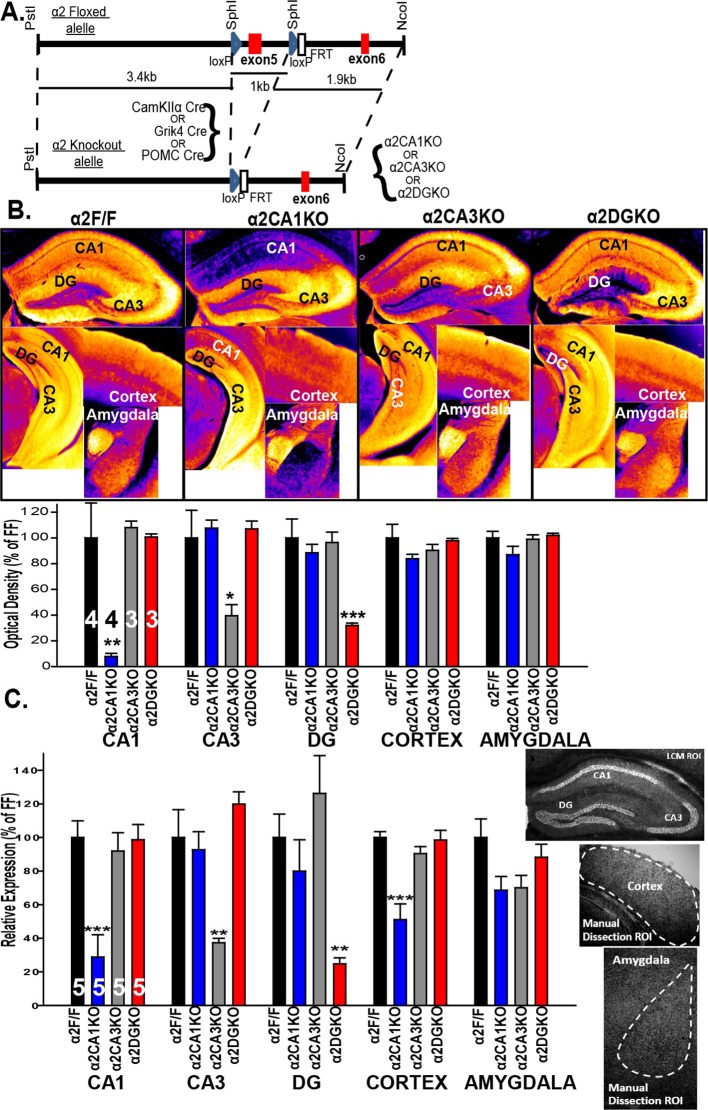
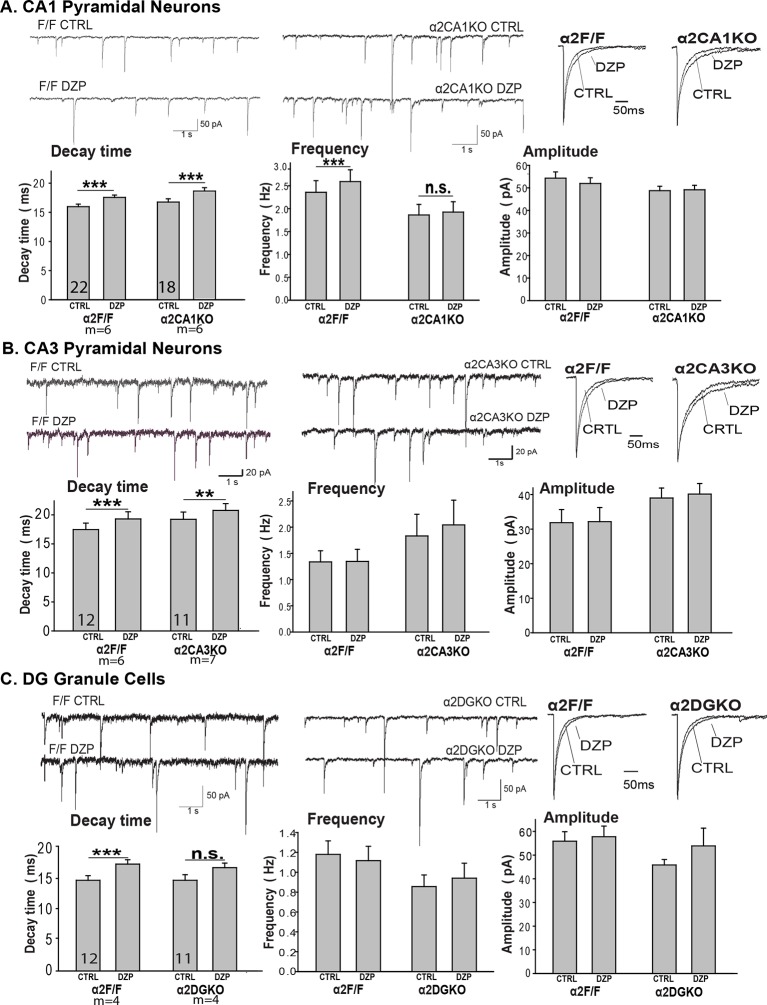
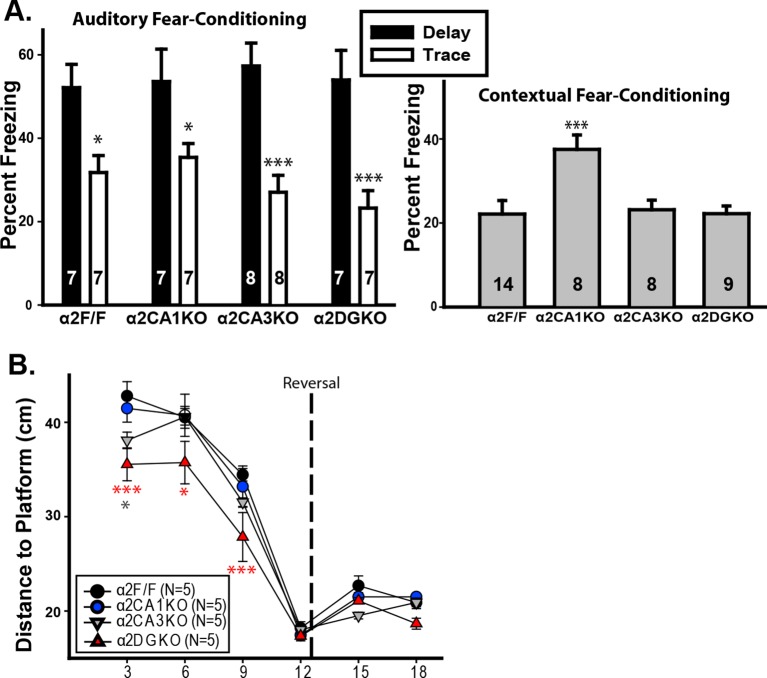
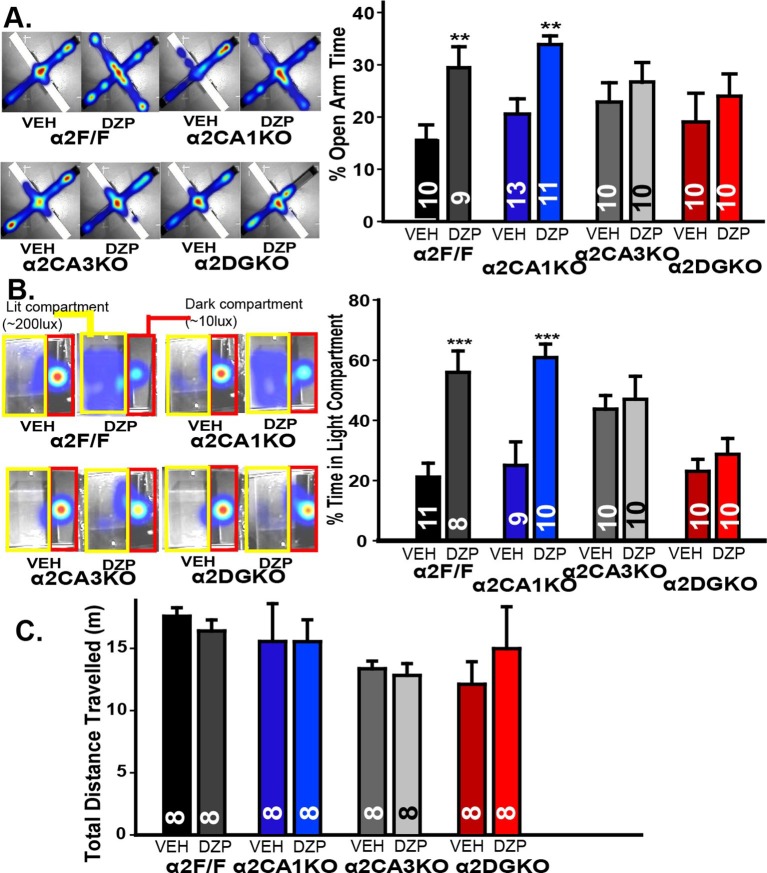
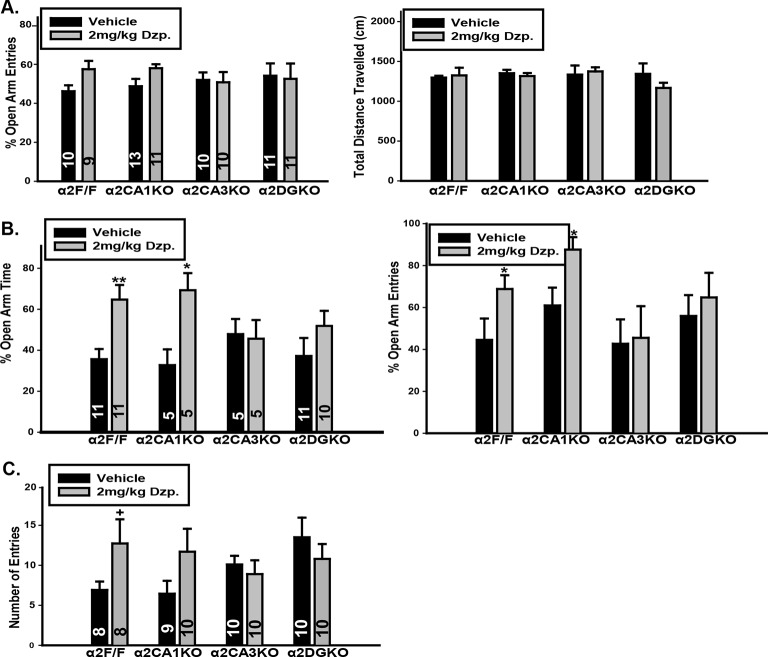
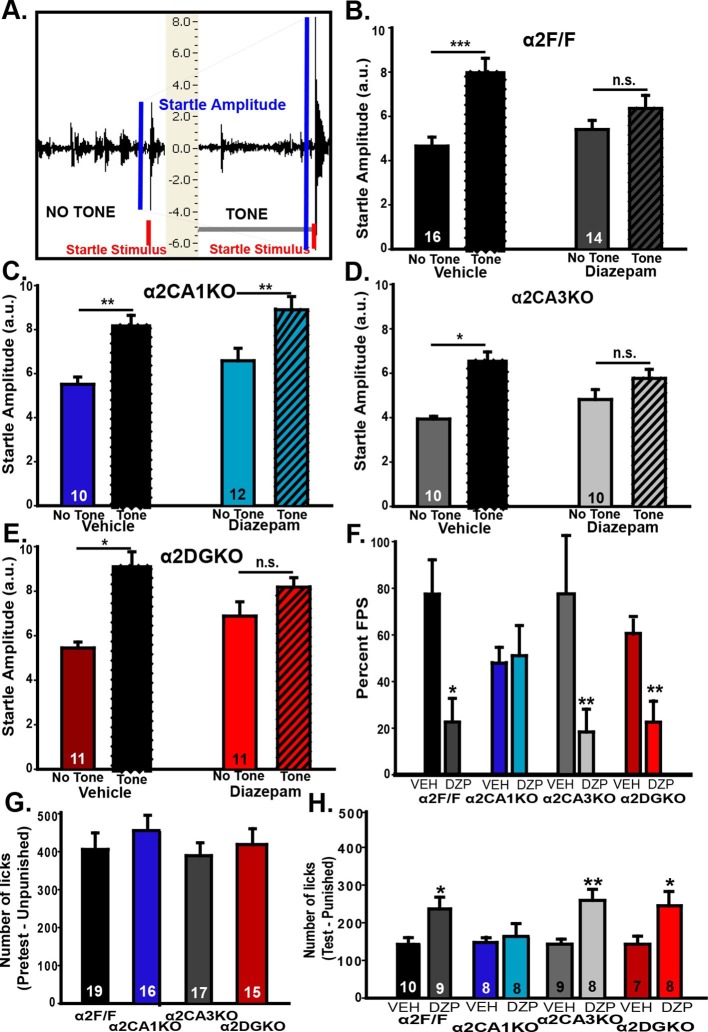
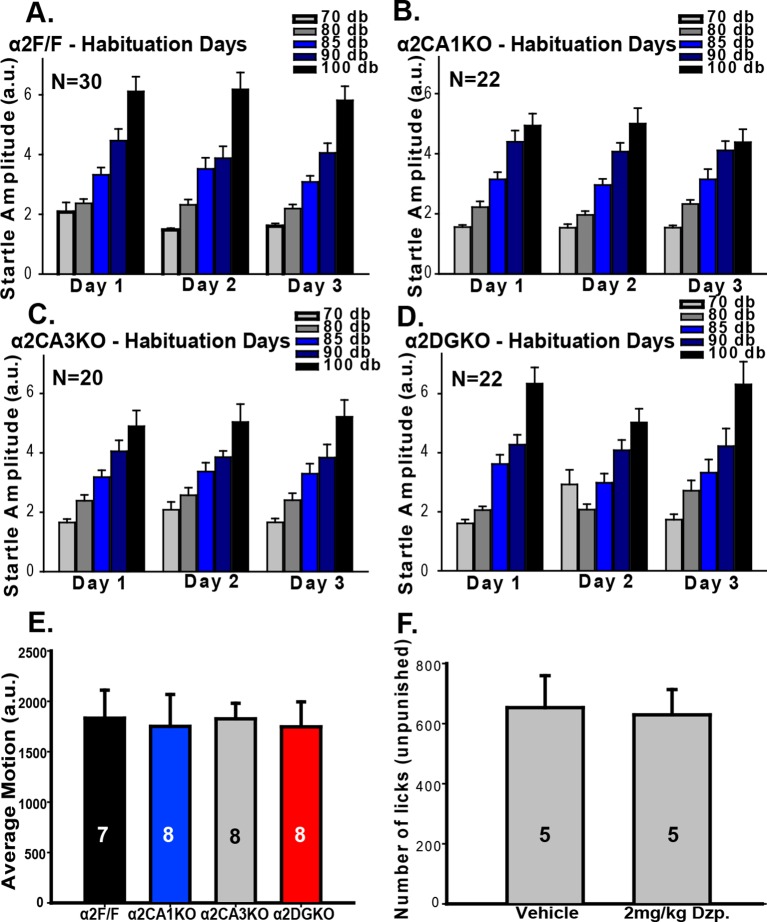
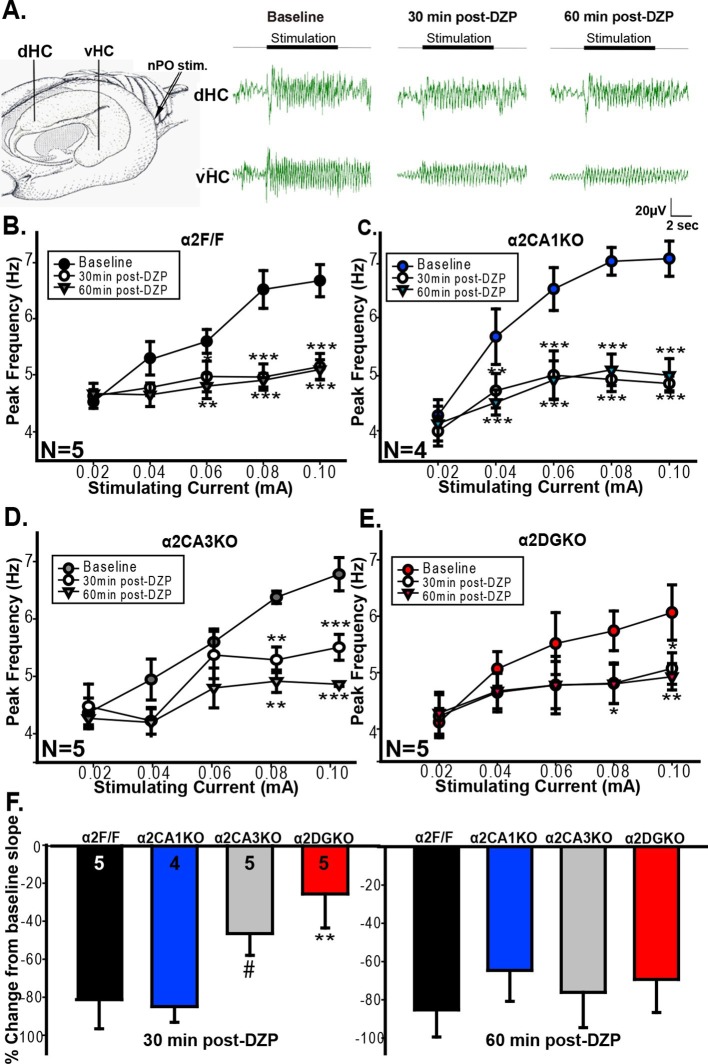
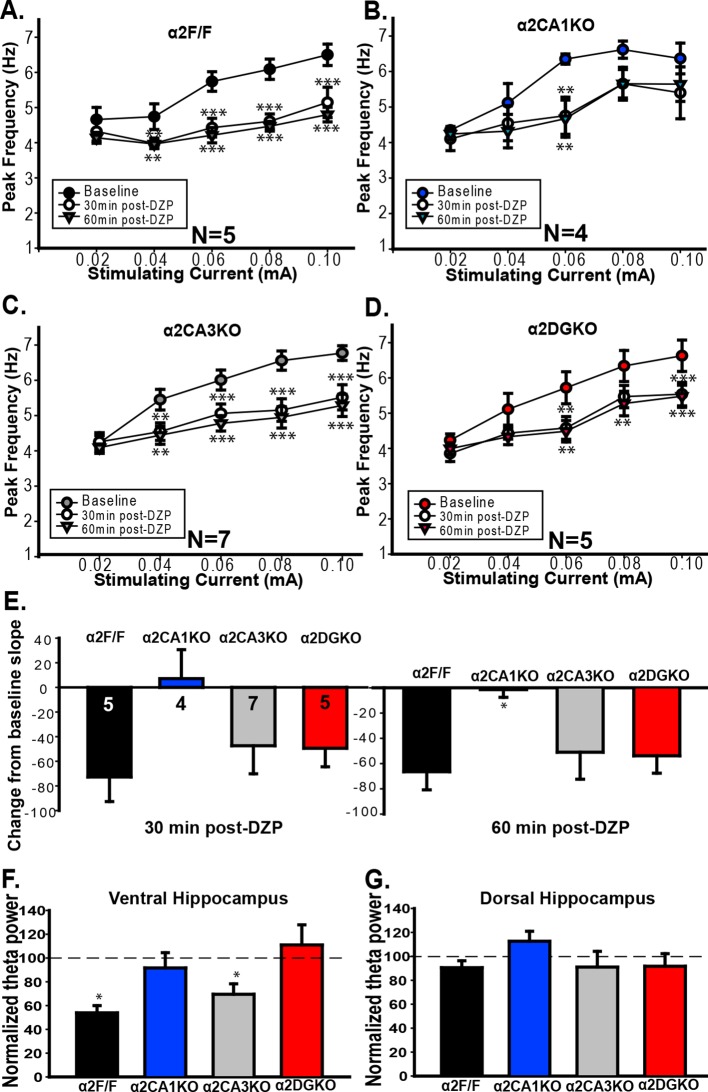
Recent findings indicate a high level of specialization at the level of microcircuits and cell populations within brain structures with regards to the control of fear and anxiety. The hippocampus, however, has been treated as a unitary structure in anxiety and fear research despite mounting evidence that different hippocampal subregions have specialized roles in other cognitive domains. Using novel cell-type- and region-specific conditional knockouts of the GABAA receptor α2 subunit, we demonstrate that inhibition of the principal neurons of the dentate gyrus or CA3 via α2-containing GABAA receptors (α2GABAARs) is required to suppress anxiety, while the inhibition of CA1 pyramidal neurons is required to suppress fear responses. We further show that the diazepam-modulation of hippocampal theta activity shows certain parallels with our behavioral findings, suggesting a possible mechanism for the observed behavioral effects. Thus, our findings demonstrate a double dissociation in the regulation of anxiety versus fear by hippocampal microcircuitry.

Keywords: GABAA receptor; anxiety; diazepam; fear; hippocampus; mouse; neuroscience; theta oscillations.


Conflict of interest statement

The other authors declare that no competing interests exist.

UR: Received compensation for professional services from Concert Pharmaceuticals in the last three years.

Figures

Figure 1.
Figure 1.. Targeted reduction of α2 expression in CA1, CA3 or DG.
(A) Generation of the α2F/F control and α2CA1KO, α2CA3KO, α2DGKO mice. (B) Top: False color images showing the α2 staining intensity in immunohistochemically stained sections. Cooler colors = less staining. Bottom: Semi-quantitative comparisons of α2 staining. (C) α2 mRNA expression (see sample ROI’s on the right), expressed as% of α2F/F control.*p<0.05, **p<0.01, ***p<0.001 compared to corresponding α2F/F group. DOI: http://dx.doi.org/10.7554/eLife.14120.003
Figure 1—figure supplement 1.
Figure 1—figure supplement 1.. Immunohistochemical localization of GABAAR α2 subunits in conditional knockout mice bred on a 129X1/SvJ background.
(A) False color images showing α2 staining intensity in immunohistochemically stained sections in α2F/F mice.Cooler colors = less staining. (B) Same as A for α2CA1KO, (C) Same as A for α2CA3KO, (D) Same as A for α2DGKO. DOI: http://dx.doi.org/10.7554/eLife.14120.004
Figure 1—figure supplement 2.
Figure 1—figure supplement 2.. Expression of α1 and α5 subunits in conditional knockout mice.
(A) Top: Representative gray-scale images showing the α1 staining intensity in immunohistochemically stained sections from the hippocampus, cortex and the amygdala of α2F/F, α2CA1KO, α2CA3KO and α2DGKO mice. Bottom: Semi-quantitative comparisons of α1 staining intensity between α2F/F, α2CA1KO, α2CA3KO and α2DGKO mice in CA1, CA3, DG, cortex and the amygdala. (B) Same as A for α5. DOI: http://dx.doi.org/10.7554/eLife.14120.005
Figure 1—figure supplement 3.
Figure 1—figure supplement 3.. Expression of α3 and α4 mRNA in conditional knockout mice.
(A) Gabra3 expression in CA1, CA3, DG, cortex and the amygdala of α2F/F, α2CA1KO, α2CA3KO and α2DGKO mice expressed as percentage of α2F/F control. (B) Same as A for Gabra4. *p<0.05 in comparison to the corresponding α2F/F control group. DOI: http://dx.doi.org/10.7554/eLife.14120.006
Figure 1—figure supplement 4.
Figure 1—figure supplement 4.. Miniature inhibitory postsynaptic currents.
Mean ( ± S.E.M.) decay time, frequency, amplitude of mIPSCs recorded from (A) the CA1 pyramidal neurons in α2CA1KO and α2F/F sections, (B) the CA3 pyramidal neurons in α2CA3KO and α2F/F sections, (C) the DG granule cells in α2DGKO and α2F/F sections. **p<0.01, ***p<0.001. CTRL=vehicle-treated, DZP=diazepam-treated. DOI: http://dx.doi.org/10.7554/eLife.14120.007
Figure 1—figure supplement 5.
Figure 1—figure supplement 5.. Tests of hippocampal function.
(A) Mean ( ± S.E.M.) percentage of time spent freezing during the tone 24 hr after auditory fear-conditioning using a delay (black) or trace (white) protocol.*p<0.05, ***p<0.001, different from the corresponding delay group. No significant differences were found in planned pair-wise comparisons of the genotypes within the trace-conditioned groups or within the delay-conditioned groups. (B) Mean ( ± S.E.M.) percentage of time spent freezing during re-exposure to the context 24 hr after contextual fear-conditioning. ***p<0.001, different from α2F/F. (C) Mean ( ± S.E.M.) distance to platform during probe trials. *p<0.05, ***p<0.001, different from α2F/F; gray: α2CA3KO, red: α2DGKO. DOI: http://dx.doi.org/10.7554/eLife.14120.008
Figure 2.
Figure 2.. Behavioral tests of anxiety and locomotor activity.
(A) Left: Activity heat maps on the EPM of representative α2F/F, α2CA1KO, α2CA3KO and α2DGKO mice treated with vehicle or diazepam. Right: Percentage (Mean ± S.E.M.) of time spent in the open arms of the EPM. (B) Left: Activity heat maps on the LDB of representative α2F/F, α2CA1KO, α2CA3KO and α2DGKO mice treated with vehicle or diazepam. The dark (red) and lit (yellow) compartments of the box are outlined for ease of visualization. Right: Percentage (Mean ± S.E.M.) of time spent in the lit compartment of the LDB. (C) Mean ( ± S.E.M.) distance travelled in the open field. DOI: http://dx.doi.org/10.7554/eLife.14120.010
Figure 2—figure supplement 1.
Figure 2—figure supplement 1.. Additional measures in tests of anxiety-like behavior.
(A) Left: Percentage of entries into the open arms in elevated plus maze in F/F control, α2CA1KO, α2CA3KO and α2DGKO mice bred on the C57BL/6J background. Right: Total distance travelled in the elevated plus maze. (B) Left: Percentage of time spent in the open arms, Right: Percentage of entries into the open arms in F/F control, α2CA1KO, α2CA3KO and α2DGKO mice bred on the 129x1/SvJ background. (C) Number of entries into the light compartment in light/dark box in F/F control, α2CA1KO, α2CA3KO and α2DGKO mice bred on the 129×1/SvJ background. +p<0.06, *p<0.05, **p<0.01 in comparison to the corresponding vehicle group. DOI: http://dx.doi.org/10.7554/eLife.14120.012
Figure 3.
Figure 3.. Behavioral tests of fear.
(A) Representative recordings of “Startle Stimulus Only” and “Tone + Startle Stimulus” trials in a α2F/F control mouse treated with vehicle. The increased startle amplitude in “Tone + Startle” trials represents fear-potentiation of the startle response. (B-E) Mean ( ± S.E.M.) startle amplitude in “No Tone” and “Tone” startle trials in vehicle and diazepam-treated (B) α2F/F, (C) αCA1KO, (D) α2CA3KO, (E) α2DGKO mice. (F) Mean ( ± S.E.M.) percent FPS in trials preceded by the tone. Asterisks represent significant difference from the corresponding vehicle group. (G) Mean ( ± S.E.M.) number of licks recorded in the pretest session of the VCT where drinking is not punished (This session does not involve drug administration). (H) Mean ( ± S.E.M.) number of licks recorded in the test session where every 20th lick is punished in vehicle- or diazepam-treated mice. Asterisks represent significant difference from the corresponding vehicle group. *p<0.05, **p<0.01, ***p<0.001. DOI: http://dx.doi.org/10.7554/eLife.14120.014
Figure 3—figure supplement 1.
Figure 3—figure supplement 1.. Additional measures in tests of fear-related behavior.
(A-D) Mean (± S.E.M.) startle amplitude in response to different intensities of white noise bursts measured in arbitrary units based on the displacement of load cells during the first three days (Habituation sessions) of the FPS experiment in (A) α2F/F, (B) α2CA1KO, (C) α2CA3KO, (D) α2DGKO mice. (E) Mean ( ± S.E.M.) shock sensitivity measured by the average motion registered during 0.4 mA shocks. (F) Mean ( ± S.E.M.) number of unpunished licks on test day in vehicle- and diazepam-treated α2F/F control mice. DOI: http://dx.doi.org/10.7554/eLife.14120.016
Figure 4.
Figure 4.. Evoked theta oscillations in the vHPC.
(A) Stimulation and recording sites and representative traces showing vHPC theta activity before and after diazepam injection in a α2F/F mouse. (B-E) Mean ( ± S.E.M.) peak frequency in the theta range at different stimulation intensities before (Baseline), and 30 min (30min post-DZP) and 60 min (60min post-DZP) following diazepam injection in (B) α2F/F, (C) α2CA1KO, (D) α2CA3KO, (E) α2DGKO mice. Asterisks represent significant difference from the baseline at the given stimulating current, with top ones for 30 min and the lower ones for 60 min post-injection. (F) Change from baseline slope in the stimulation intensity – peak frequency function 30 min (left) or 60 min following diazepam injection.#p<0.09, *p<0.05, **p<0.01, ***p<0.001 compared to corresponding α2F/F group. DOI: http://dx.doi.org/10.7554/eLife.14120.018
Figure 4—figure supplement 1.
Figure 4—figure supplement 1.. Frequency and power of theta range oscillations.
A-D Mean ( ± S.E.M.) peak frequency in the theta range in dHPC recorded before, 30min after and 60min after diazepam administration in (A) α2F/F, (B) α2CA1KO, (C) α2CA3KO, (D) α2DGKO mice.**p<0.01, ***p<0.001 compared to pre-diazepam baseline at the given stimulating current. (E) Mean ( ± S.E.M.) change from baseline slope in the stimulation intensity – peak frequency function for dHPC recordings 30 min (left) or 60 min following diazepam injection,*p<0.05 compared to corresponding α2F/F group. (F) Mean ( ± S.E.M.) theta power in the vHPC normalized to baseline power 60 min following diazepam injection. (G) Same as F for dHPC recordings. *p<0.05 compared to corresponding α2F/F group. DOI: http://dx.doi.org/10.7554/eLife.14120.020

Similar articles

Cited by

References

    1. Adhikari A, Topiwala MA, Gordon JA. Synchronized Activity between the Ventral Hippocampus and the Medial Prefrontal Cortex during Anxiety. Neuron. 2010;65:257–269. doi: 10.1016/j.neuron.2009.12.002. - DOI - PMC - PubMed
    1. Bannerman DM, Deacon RMJ, Offen S, Friswell J, Grubb M, Rawlins JNP. Double dissociation of function within the hippocampus: Spatial memory and hyponeophagia. Behavioral Neuroscience. 2002;116:884–901. doi: 10.1037/0735-7044.116.5.884. - DOI - PubMed
    1. Bannerman DM, Rawlins JNP, McHugh SB, Deacon RMJ, Yee BK, Bast T, Zhang W-N, Pothuizen HHJ, Feldon J. Regional dissociations within the hippocampus—memory and anxiety. Neuroscience & Biobehavioral Reviews. 2004;28:273–283. doi: 10.1016/j.neubiorev.2004.03.004. - DOI - PubMed
    1. Botta P, Demmou L, Kasugai Y, Markovic M, Xu C, Fadok JP, Lu T, Poe MM, Xu L, Cook JM, Rudolph U, Sah P, Ferraguti F, Lüthi A. Regulating anxiety with extrasynaptic inhibition. Nature Neuroscience. 2015;18:1493–1500. doi: 10.1038/nn.4102. - DOI - PMC - PubMed
    1. Chen H, Luo R, Gong S, Matta SG, Sharp BM. Protection Genes in Nucleus Accumbens Shell Affect Vulnerability to Nicotine Self-Administration across Isogenic Strains of Adolescent Rat. PLoS ONE. 2014;9:e14120. doi: 10.1371/journal.pone.0086214. - DOI - PMC - PubMed

Publication types

Substances