. 2016 Apr 6;90(1):165-76.
doi: 10.1016/j.neuron.2016.02.012. Epub 2016 Mar 10.

Signal, Noise, and Variation in Neural and Sensory-Motor Latency

Affiliations

Signal, Noise, and Variation in Neural and Sensory-Motor Latency

Joonyeol Lee et al. Neuron. .

Abstract

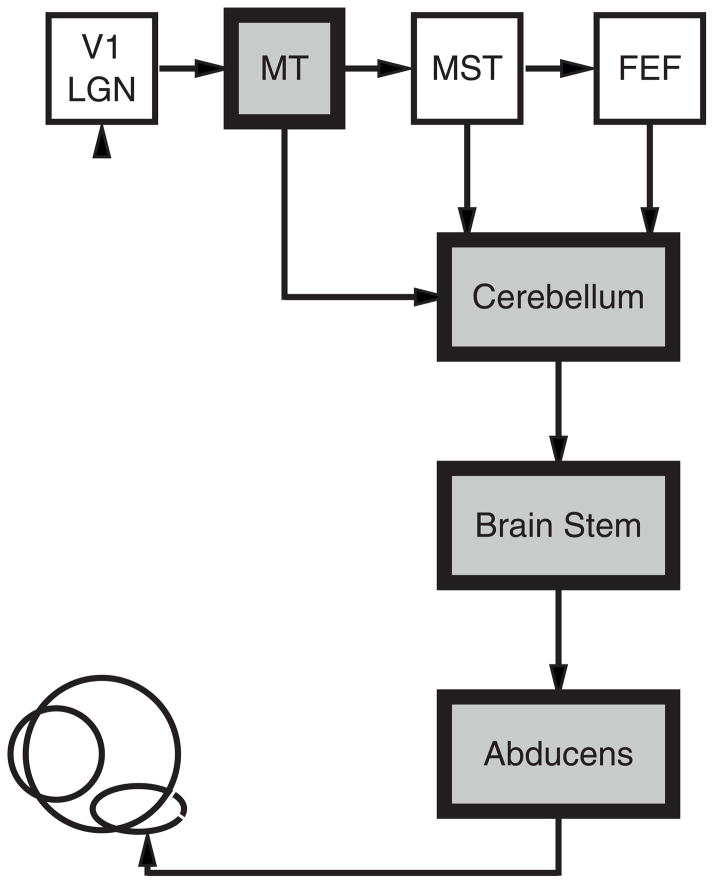
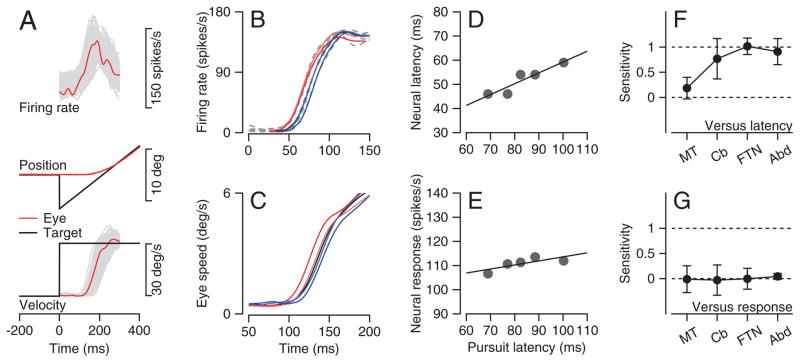
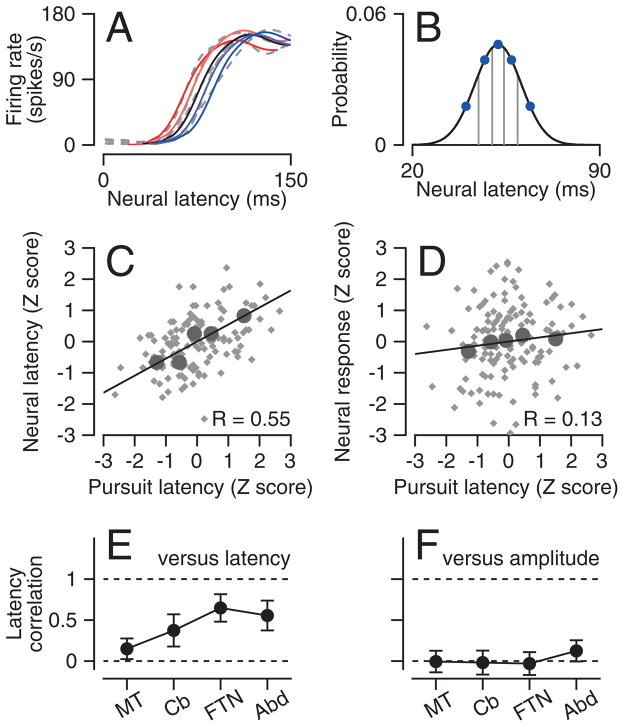
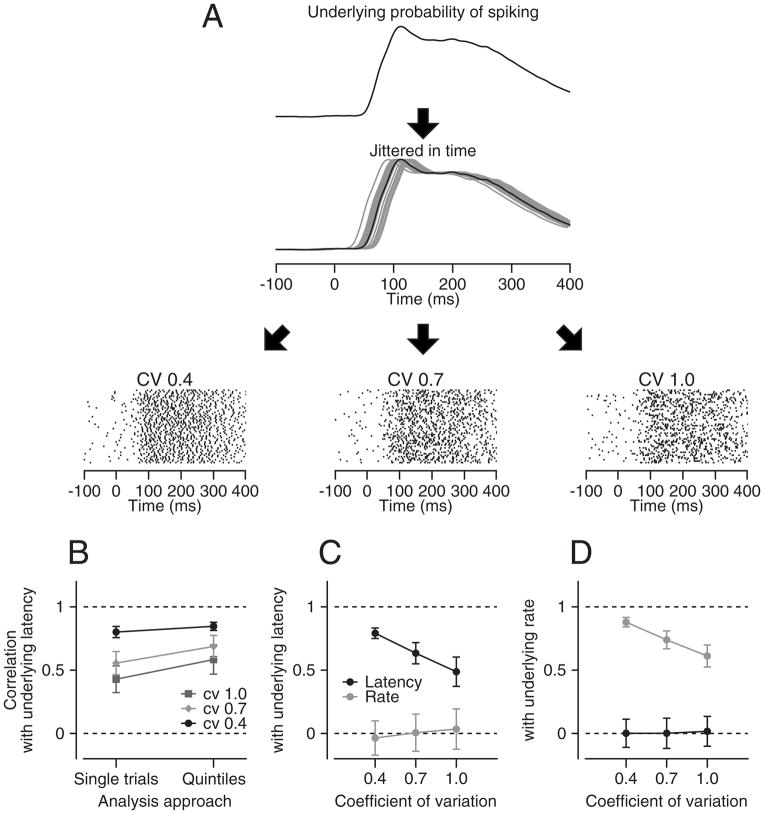
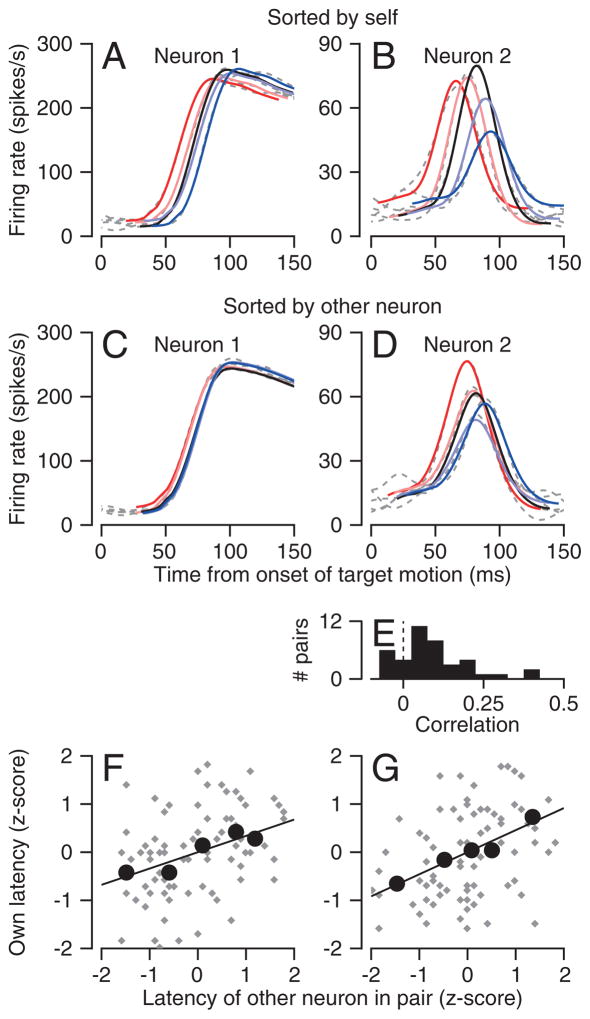
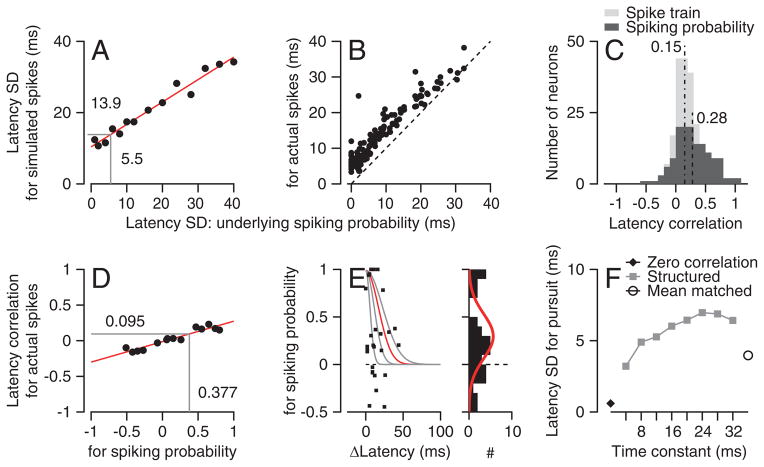
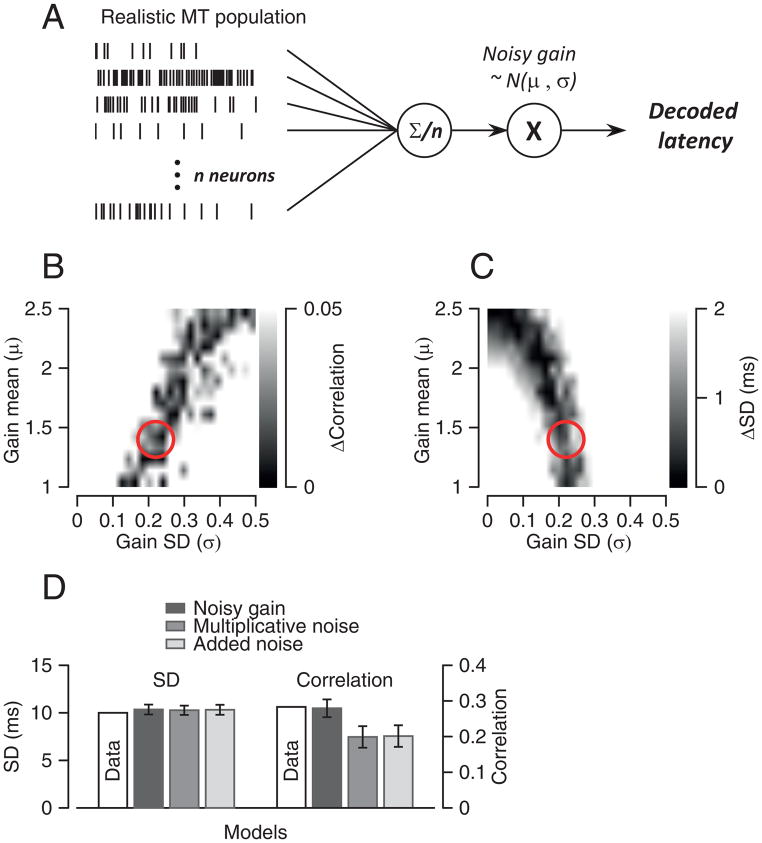
Analysis of the neural code for sensory-motor latency in smooth pursuit eye movements reveals general principles of neural variation and the specific origin of motor latency. The trial-by-trial variation in neural latency in MT comprises a shared component expressed as neuron-neuron latency correlations and an independent component that is local to each neuron. The independent component arises heavily from fluctuations in the underlying probability of spiking, with an unexpectedly small contribution from the stochastic nature of spiking itself. The shared component causes the latency of single-neuron responses in MT to be weakly predictive of the behavioral latency of pursuit. Neural latency deeper in the motor system is more strongly predictive of behavioral latency. A model reproduces both the variance of behavioral latency and the neuron-behavior latency correlations in MT if it includes realistic neural latency variation, neuron-neuron latency correlations in MT, and noisy gain control downstream of MT.

Keywords: Abducens; area MT; correlated variation; floccular complex; neuron-behavior correlations; reaction time; smooth pursuit eye movements.


Conflict of interest statement

The authors declare no competing financial interests.

Figures

Figure 1
Figure 1. Neural circuit for smooth pursuit eye movement
Areas marked by gray shading indicate the sites where we recorded neural responses. Abbreviations are: V1, primary visual cortex; LGN, lateral geniculate nucleus, MT, middle temporal visual area; MST, medial superior temporal visual area; FEF, smooth eye movement region of the frontal eye fields.
Figure 2
Figure 2. Sensitivity of pursuit latency to neural latency and response magnitude at 4 levels of the pursuit circuit
A. Neural responses during step-ramp target motion. From top to bottom, the traces show firing rate, eye and target position, and eye and target velocity. Black, red, and gray traces show target motion, mean responses, and trial-by-trial variation for a single recording session. B, C: Average spike density functions (B) and eye speed trajectories (C) for an example MT neuron. The five traces show averages for 5 quintiles of trials divided according to pursuit latency. Colors identify the data from the same groups in the eye velocity and firing rate traces. D, E: Regression analysis of neural latency (D) and response amplitude (E) versus pursuit latency. Symbols show averages for the 5 quintiles of trials sorted by latency, and lines show the results of linear regression. F, G: Mean and standard deviation of pursuit latency’s sensitivity to neural latency (F) and response amplitude (G) in 4 recording sites: n=135, 40, 29, and 40 for recordings in MT, floccular complex, FTNs, and Abducens neurons.
Figure 3
Figure 3. Neuron-behavior correlations for neural response latency or amplitude
A: Colored solid lines show the scaled and translated templates that provided the best fits to the dashed gray lines, which show averages of the five quintiles of responses with different pursuit latencies. B: Curve shows the Gaussian estimates of the distribution of latency for the neuron and blue symbols show the data used to derive the curve. C, D: Scatter plots one neuron showing z-scores of neural latency (C) and response amplitude (D) versus z-scores of pursuit latency. Gray and black symbols show estimates for all individual trials and averages for each of the 5 quintiles. Lines show the results of regression analysis. E, F: Population neuron-behavior correlations at each recording site for neural latency (E) and neural response amplitude (F). Error bars are standard deviations across neurons.
Figure 4
Figure 4. Procedure for evaluating accuracy of neural latency estimates
A: schematic showing how we simulated spike trains from by the underlying probability of firing. The rasters show simulations of 100 trials for 3 coefficients of variation (CV). B: Comparison of analysis done on single trials versus on trials divided into quintiles. C, D: Analysis of how well the analysis procedure could separate variation in latency versus amplitude of the underlying probability of firing. The y-axes plot the correlation between the actual latency (C) or the underlying probability of firing (D) with the latency or rate measured from the spike trains. Error bars are standard deviations from 100 repeats.
Figure 5
Figure 5. Neuron-neuron correlation for latency in area MT
A, B: Quintiles of spike density functions of the quintiles of two neurons recorded at the same time. C, D: Spike density functions of the same neurons, sorted according to neural response latency of the other neuron in the pair. In A–D, the colors and dashed gray traces show the scaled and translated templates and the averages of spike density. E: Distribution of neuron-neuron latency correlations in MT. F, G: Scatter plots showing the z-score of the latency of one neuron as a function of the z-score of the latency of the other neuron in the pair. Gray and black symbols show data for single trials and averages across the 5 quintiles. Lines show the result of linear regression. The two graphs plot analysis of a single data set performed separately on the basis of the latency of each neuron.
Figure 6
Figure 6. Effect of neuron-neuron latency correlations on the variation of behavioral latency
A: Relationship between the standard deviation of latency for simulated spikes and the underlying probability of spiking in a model MT neuron. B: Symbols show the relationship between standard deviation of latency measured from actual spike trains and for the underlying probability of spiking for a sample of MT neurons. Dashed line shows equality line. C: Distribution of MT-pursuit latency correlations. Black and gray histograms show values for actual spike trains and for the underlying probability of spiking. Vertical dashed lines show the population means. D: Relationship between the neuron-neuron latency correlation for simulated spikes and the underlying probability of spiking in a pair of model MT neurons. E: Each symbol shows neuron-neuron correlations in the underlying probability of spiking for a pair of neurons as a function of the latency difference between the two neurons. The gray and red exponential functions show potential descriptions of the data with different “delta-latency” constants. The marginal histogram summarizes the distribution of neuron-neuron latency correlations in the underlying probability of spiking. The red curve shows a Gaussian fit used to create model populations. F: Latency variation of pursuit under different assumptions about neuron-neuron latency correlations in a model population response. Filled diamond, neuron-neuron latency correlations were absent; gray symbols, structured correlations with different “delta-latency” time constants; open symbol, uniform neuron-neuron latency correlations with the same mean value as the data.
Figure 7
Figure 7. Model that uses downstream noise to account for statistics of pursuit latency
A: Schematic diagram of a model that uses a realistic model MT population response, an averaging population decoder, and noisy gain downstream from decoding. B, C: Gray scale representation of the difference between simulated and actual MT-pursuit correlations (B) and latency standard deviation (C) as a function of the value of downstream gain (y-axis) and the value of the downstream noise SD (x-axis). Red circles show the parameters that provide the best prediction of the actual data for both parameters. D: Comparisons among models. Error bars are standard deviations obtained from running each simulation 100 times.

References

    1. Beck JM, Ma WJ, Pitkow X, Latham PE, Pouget A. Not noisy, just wrong: the role of suboptimal inference in behavioral variability. Neuron. 2012;74:30–39. - PMC - PubMed
    1. Bell AH, Meredith MA, Van Opstal AJ, Munoz DP. Stimulus intensity modifies saccadic reaction time and visual response latency in the superior colliculus. Exp Brain Res. 2006;174:53–59. - PubMed
    1. Bollimunta A, Knuth KH, Ding M. Trial-by-trial estimation of amplitude and latency variability in neuronal spike trains. J Neurosci Methods. 2007;160:163–170. - PubMed
    1. Brown EN, Barbieri R, Ventura V, Kass RE, Frank LM. The time-rescaling theorem and its application to neural spike train data analysis. Neural Comput. 2002;14:325–346. - PubMed
    1. Celesia GG, Puletti F. Auditory input to the human cortex during states of drowsiness and surgical anesthesia. Electroen Clin Neuro. 1971;31:603–609. - PubMed

Publication types

LinkOut - more resources