. 2016 Apr 6;90(1):101-12.
doi: 10.1016/j.neuron.2016.02.019. Epub 2016 Mar 10.

Distinct Contribution of Adult-Born Hippocampal Granule Cells to Context Encoding

Affiliations

Distinct Contribution of Adult-Born Hippocampal Granule Cells to Context Encoding

Nathan B Danielson et al. Neuron. .

Abstract

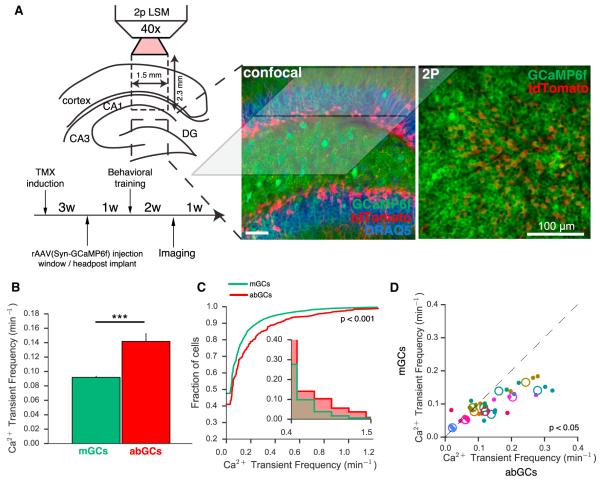
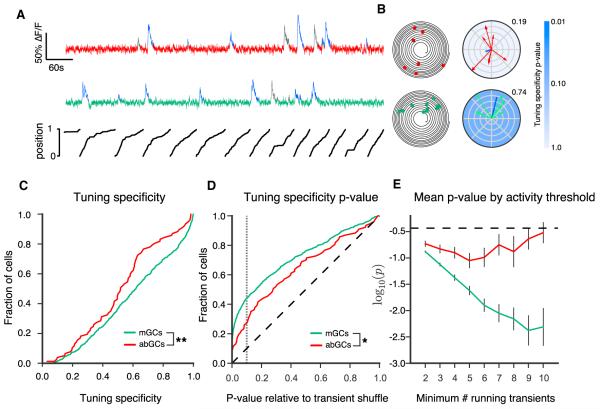
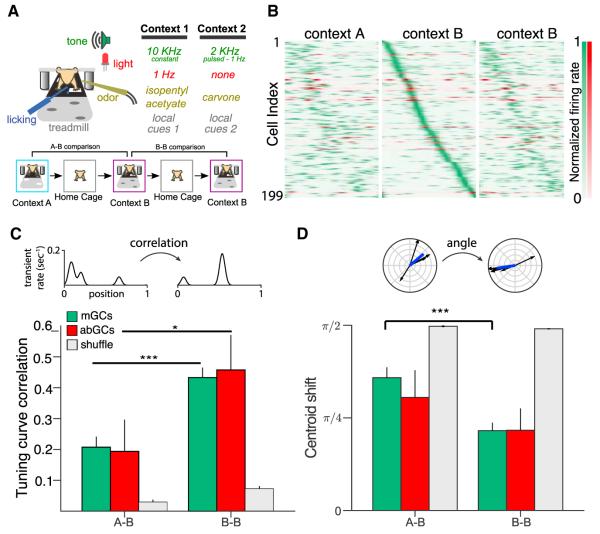
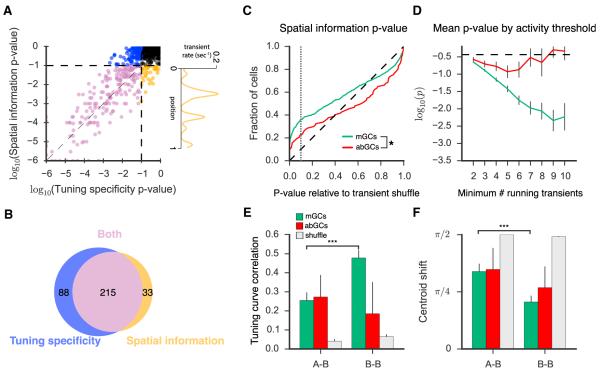
Adult-born granule cells (abGCs) have been implicated in cognition and mood; however, it remains unknown how these cells behave in vivo. Here, we have used two-photon calcium imaging to monitor the activity of young abGCs in awake behaving mice. We find that young adult-born neurons fire at a higher rate in vivo but paradoxically exhibit less spatial tuning than their mature counterparts. When presented with different contexts, mature granule cells underwent robust remapping of their spatial representations, and the few spatially tuned adult-born cells remapped to a similar degree. We next used optogenetic silencing to confirm the direct involvement of abGCs in context encoding and discrimination, consistent with their proposed role in pattern separation. These results provide the first in vivo characterization of abGCs and reveal their participation in the encoding of novel information.


Figures

Figure 1
Figure 1. Functional Imaging of abGCs and mGCs
(A) Left: experimental schematic. Two-photon line-scanning microscopy allows for the recording of large populations of GCs in surgically exposed dorsal DG. Experimental timeline as indicated. Middle: confocal image of recovered tissue illustrating the geometry of the preparation. GCs (stained with DRAQ5) express GCaMP6f, with abGCs also expressing tdTomato. Right: time-averaged in vivo two-photon image of a representative FOV (300 × 300 μm), containing ~1,000 GCs. (B) abGCs exhibit a higher rate of running-related calcium transients than mGCs (p < 0.001; n = 7,950 mGCs, 446 abGCs across 11 FOV in 6 mice; Welch’s t test, t(8,396) = −4.14; each measure is the average of 1–3 recordings for that cell). (C) Distribution of firing rates across abGCs and mGCs demonstrates significantly different population-level activity (p < 0.001; Kolmogorov-Smirnov (KS) test, KS Stat = 0.10). (D) Scatter of mean abGC and mGC running-related firing rates within each recording session (closed circles) and averaged across sessions for each FOV (open circles). Color reflects FOV as specified in Figure S6. Across imaging fields abGCs were significantly more active than mGCs (p < 0.05; n = 11 FOV; paired t test, t(20) = 2.88). The same results were obtained when including all transients (data not shown). Error bars are mean ± SEM.
Figure 2
Figure 2. Spatial Tuning of abGCs and mGCs
(A) Time series of calcium signals from an example abGC (red) and mGC (green), with position of the mouse along the circular treadmill belt plotted below. Running-related calcium transients are indicated in blue (all others in gray). (B) Left: trajectory plot of position (angular coordinate) and time (radial coordinate) with running-related calcium transients as dots along the trajectory. Right: spatial tuning plots for example mGC (green) and abGC (red). Vectors indicate the animal’s position at the time of each running-related transient onset, with magnitude determined by the inverse of the fraction of time spent at that position. Blue lines indicate the calculated tuning vectors, whose orientation and magnitude correspond to the tuning direction and specificity, respectively. Tuning specificity is given next to each plot. Tuning specificity p value is indicated by blue shading. (C) Cumulative distributions of tuning specificity values for active mGCs and abGCs (≥ four running-related transients). The abGC distribution was significantly left shifted as compared to the mGC distribution with few sharply tuned cells (p < 0.01; n = 639 mGCs, 77 abGCs from 11 FOVs in 6 mice; two-sample KS Test, KS Stat = 0.217, p < 0.01). (D) Cumulative distributions of tuning specificity p values. The p value distributions for mGCs and abGCs differed significantly from each other (p < 0.05; KS test, KS Stat = 0.18) and from the uniform distribution (diagonal dashed line) expected in the case of a nonspatially tuned population (p < 0.001 for both mGCs and abGCs; KS test, abGCs, KS Stat = 0.25, mGCs KS Stat = 0.35). Gray dashed line indicates p = 0.1. (E) Mean logarithm of the p value for mGCs and abGCs with differing inclusion thresholds for the number of running-related calcium transients. For mGCs, the p values monotonically decrease with increasing inclusion threshold, consistent with the increased statistical power provided by a greater numbers of transients. The lack of such a decrease in the adult-born population suggests that the more active abGCs tend to be less tuned or consist of a mixed population of tuned and untuned cells. The dashed black line shows the expected value for an untuned population. Error bars are mean ± SEM.
Figure 3
Figure 3. Contextual Coding by abGCs and mGCs
(A) Experimental schematic. Mice ran for three 12 min sessions in contexts A, B, and B (1 hr between runs). A and B refer to either context 1 or 2 (chosen randomly for each experiment). (B) Remapping of spatial rate maps across sequential context exposures. Smoothed calcium transient rates, normalized to peak for each cell, are plotted as a function of position during three contextual exposures (A, B, B). Cells (mGCs, green; abGCs, red) are ordered according to the position of peak activity during the first exposure to context B. Data is shown for GCs with sufficient tuning specificity and activity (p < 0.1, at least four transients) in at least one experiment. (C and D) Context specificity of spatial representations. Tuning curve correlations of 1D rate maps (C) and centroid shifts (angle between tuning directions) (D) between sequential exposures to different (A-B) or the same (B-B) contexts for all cells shown in (B) (A-B: n = 180 mGCs, 14 abGCs; B-B: n = 174 mGCs, 9 abGCs). The rate map correlations of both populations were more similar in the B-B condition than in A-B (Mann-Whitney U, mGCs: U(150) = 5,291, p < 0.001; abGCs: U(18) = 23.0, p < 0.05). In mGCs the tuning shift was larger in the A-B condition than in B-B, although this did not reach significance in abGCs (mGCs: U(150) = 5,714, p < 0.001; abGCs: U(18) = 40.0, p = 0.34). In both conditions, the similarity of spatial representations exceeded chance levels as estimated by shuffling cell identity (gray). Error bars are mean ± SEM.
Figure 4
Figure 4. Spatial Information in abGCs
(A) For each cell firing at least four running-related transients, we calculated the spatial information p value and tuning specificity p value by shuffling the events in time and repeatedly recalculating either corresponding metric. Values are highly correlated on a log scale (r = 0.91, Pearson’s R). Cells are colored according to whether they met the tuning specificity p value inclusion criterion only (blue), the spatial information p value criterion only (gold), both (purple), and neither (black). Right panel: the tuning profile of a cell meeting the spatial information, but not the tuning specificity, criteria is shown. (B) Venn diagram demonstrates overlap in populations meeting the two inclusion criteria (p < 0.10). (C) Cumulative distributions of spatial information p values. The p value distributions for mGCs and abGCs differed significantly from each other (KS test, KS Stat = 0.17, p < 0.05) and from the uniform distribution (diagonal dashed line) expected in the case of a nonspatially tuned population (KS test; mGCs: KS Stat = 0.26, p < 0.001; abGCs: KS Stat = 0.146, p < 0.05;). Gray dashed line indicates p = 0.1. (D) Mean logarithm of the p value for mGCs and abGCs with differing inclusion thresholds for the number of running-related calcium transients. A similar relationship is seen as described in Figure 2E. (E and F) Contextual discrimination analysis with inclusion criteria based on spatial information p value. For mGCs (A-B, n = 100; B-B, n = 106) the tuning curve correlation (E; Mann-Whitney U, U(204) = 3,597, p < 0.001) and centroid shift (F; Mann-Whitney U, U(204) = 3,798, p < 0.001) were both significantly more similar in the B-B condition than in A-B. This relationship was not observed (Mann-Whitney U; E; U(14) = 26.0, p = 0.45; F; U(14) = 23.0, p = 0.32) in the few abGCs (A-B, n = 11; B-B, n = 5) meeting the spatial information inclusion criterion. Error bars are mean ± SEM.
Figure 5
Figure 5. Mean Activity in GCs Does Not Code for Context
(A) Schematic of population vector analysis. Activity-based vectors were defined for each experiment, and angles were measured between sequential exposures to the same (θB-B) or similar (θA-B) contexts. (B and C) Scatter of population vector angles across the two conditions in which vector components are defined as transient frequency (B) or rate of transient AUC (area under the curve of significant Ca2+ transients divided by the total time) (C). Each point corresponds to mature (green) or newborn (red) cells from one FOV. For neither abGC (B; paired t test, T(16) = 0.04, p = 0.97; C; T(16) = 1.25, p = 0.25) nor mGC (B; T(18) = 1.53, p = 0.16; C; T(18) = 0.32, p = 0.76) populations were the vectors more similar for sequential exposures to the same context than for sequential exposures to different contexts. (D) For each contextual exposure, we calculated a single pseudopopulation vector by concatenating the newborn population vectors from all FOVs. Schematic is drawn to illustrate the case of activity-based discrimination. (E and F) Lack of evidence for activity-based discrimination (θA-B – θB-B) for either transient frequency (E) and transient AUC rate (F). The dotted red line indicates the difference in the angles between the abGC pseudopopulation vectors. The difference was consistent with the distribution (green histogram) of such differences attained by repeatedly randomly downsampling similarly constructed pseudopopulations of mature cells (E, percentile = 34; F, percentile = 73; see Experimental Procedures).
Figure 6
Figure 6. abGCs Participate in Memory Encoding and Discrimination
(A) Experimental design. Right: expression of Arch in abGCs (Scale bar, 100 μm; inset, 10 μm). (B) Yellow-light inhibition of dorsal abGCs during training impaired encoding of contextual fear (n = 8 control, 9 NestinArch; group effect F(1,15) = 6.3, p = 0.02; groupXtraining interaction F(1,15) = 5.4, p = 0.03; on test day t15 = −2.5, p = 0.02). (C and D) Acute inhibition of abGCs impairs behavioral pattern separation. (C) Mice discriminated when abGCs were inhibited in the conditioning context (n = 7 control, 8 NestinArch; groupXdayXcontext interaction F(8,208) = 0.581, p = 0.79. Control: context effect F(1,12) = 7.243, p = 0.02; dayXcontext interaction F(8,96) = 2.094, p = 0.0436. NestinArch: context effect F(1,14) = 10.631, p = 0.006; dayXcontext effect F(8,112) = 3.706, p = 0.007.). (D) Mice did not discriminate when abGCs were inhibited in the unconditioned context (n = 8 control, 7 NestinArch; groupXdayXcontext interaction F(8,208) = 1.9, p = 0.04. Control: context effect F(1,13) = 4.8, p = 0.04; dayXcontext interaction F(8,104) = 3.1, p = 0.004. NestinArch: context effect F(1,12) = 4.1, p = 0.06; dayXcontext effect F(8,96) = 0.6, p = 0.74). Error bars are mean ± SEM.

Comment in

  • The Young and the Promiscuous.
    Ramsaran AI, Frankland PW. Ramsaran AI, et al. Neuron. 2016 Apr 6;90(1):6-8. doi: 10.1016/j.neuron.2016.03.021. Neuron. 2016. PMID: 27054613

References

    1. Aimone JB, Deng W, Gage FH. Resolving new memories: a critical look at the dentate gyrus, adult neurogenesis, and pattern separation. Neuron. 2011;70:589–596. - PMC - PubMed
    1. Alme CB, Buzzetti RA, Marrone DF, Leutgeb JK, Chawla MK, Schaner MJ, Bohanick JD, Khoboko T, Leutgeb S, Moser EI, et al. Hippocampal granule cells opt for early retirement. Hippocampus. 2010;20:1109–1123. - PubMed
    1. Bonnevie T, Dunn B, Fyhn M, Hafting T, Derdikman D, Kubie JL, Roudi Y, Moser EI, Moser MB. Grid cells require excitatory drive from the hippocampus. Nat. Neurosci. 2013;16:309–317. - PubMed
    1. Brandt MD, Jessberger S, Steiner B, Kronenberg G, Reuter K, Bick-Sander A, von der Behrens W, Kempermann G. Transient calretinin expression defines early postmitotic step of neuronal differentiation in adult hippocampal neurogenesis of mice. Mol. Cell. Neurosci. 2003;24:603–613. - PubMed
    1. Burghardt NS, Park EH, Hen R, Fenton AA. Adult-born hippocampal neurons promote cognitive flexibility in mice. Hippocampus. 2012;22:1795–1808. - PMC - PubMed

Publication types