. 2016 Apr 6;90(1):113-27.
doi: 10.1016/j.neuron.2016.02.010. Epub 2016 Mar 10.

Coordinated Excitation and Inhibition of Prefrontal Ensembles during Awake Hippocampal Sharp-Wave Ripple Events

Affiliations

Coordinated Excitation and Inhibition of Prefrontal Ensembles during Awake Hippocampal Sharp-Wave Ripple Events

Shantanu P Jadhav et al. Neuron. .

Abstract

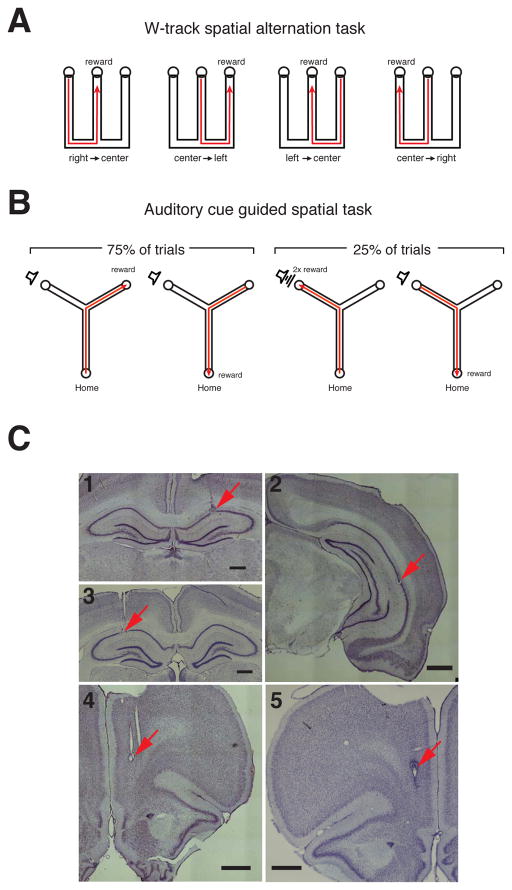
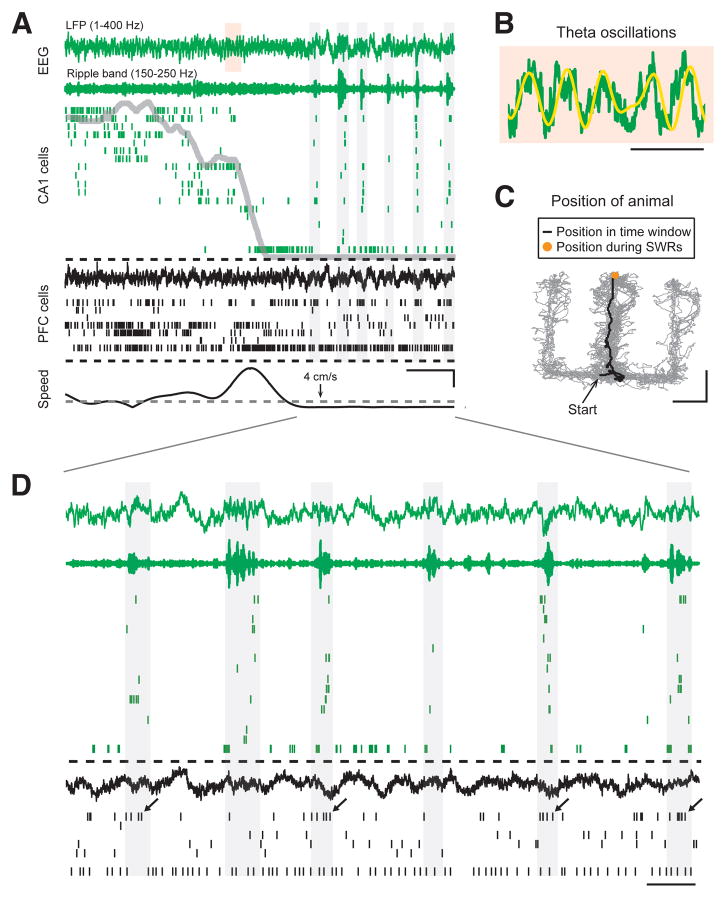
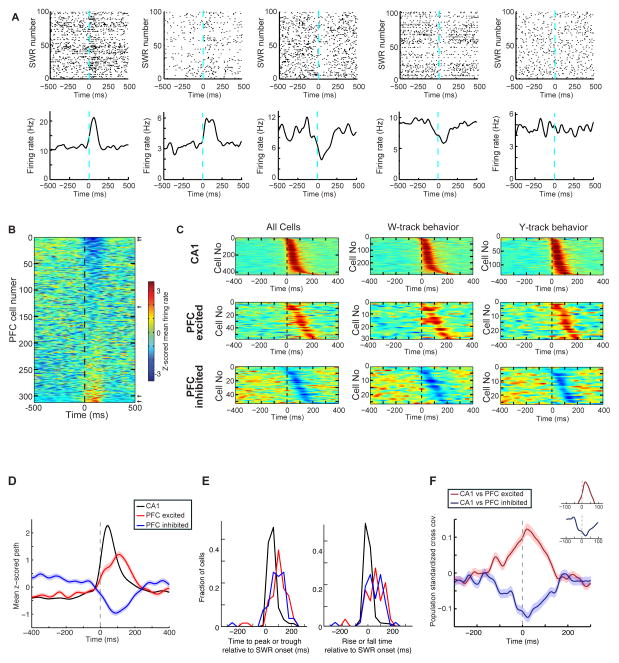
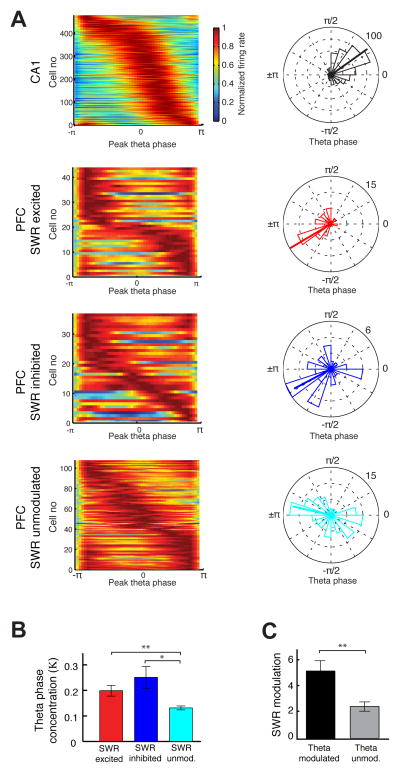
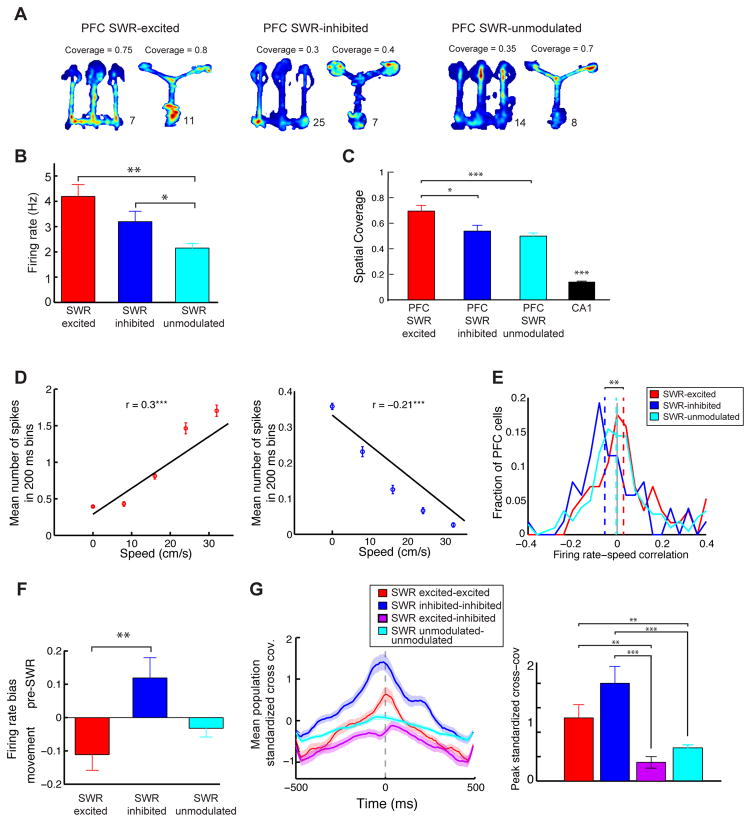
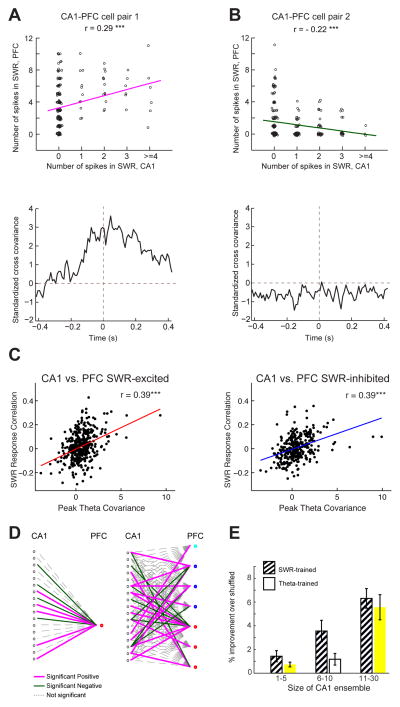
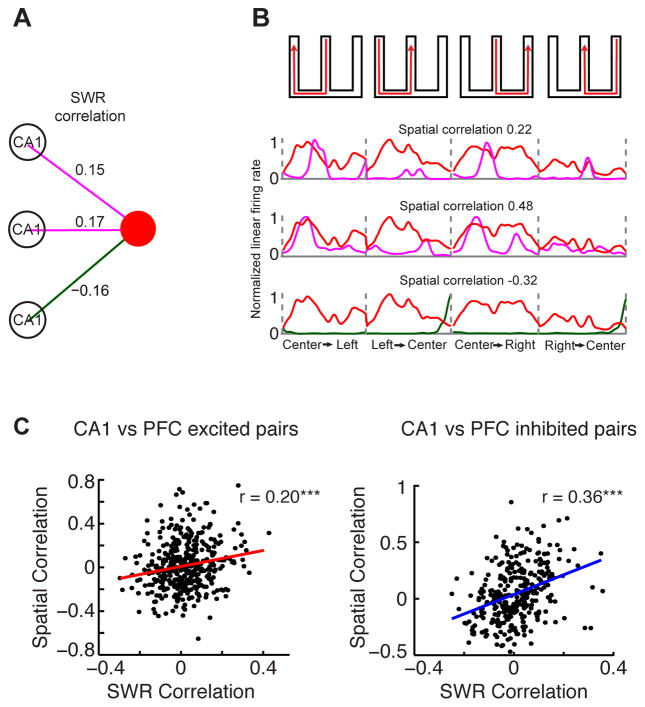
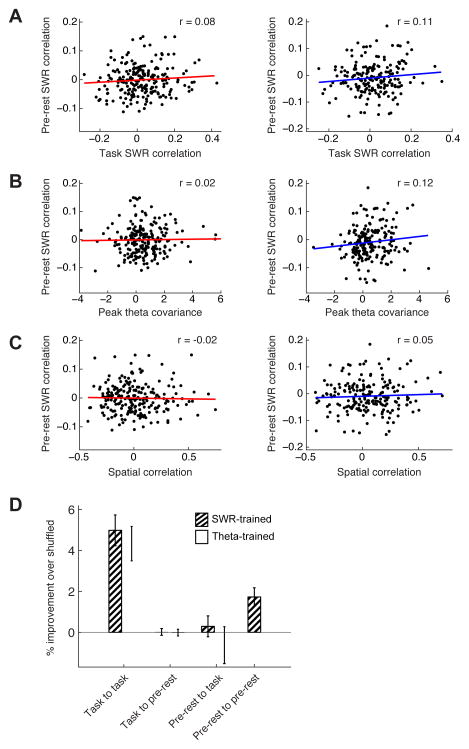
Interactions between the hippocampus and prefrontal cortex (PFC) are critical for learning and memory. Hippocampal activity during awake sharp-wave ripple (SWR) events is important for spatial learning, and hippocampal SWR activity often represents past or potential future experiences. Whether or how this reactivation engages the PFC, and how reactivation might interact with ongoing patterns of PFC activity, remains unclear. We recorded hippocampal CA1 and PFC activity in animals learning spatial tasks and found that many PFC cells showed spiking modulation during SWRs. Unlike in CA1, SWR-related activity in PFC comprised both excitation and inhibition of distinct populations. Within individual SWRs, excitation activated PFC cells with representations related to the concurrently reactivated hippocampal representation, while inhibition suppressed PFC cells with unrelated representations. Thus, awake SWRs mark times of strong coordination between hippocampus and PFC that reflects structured reactivation of representations related to ongoing experience.


Figures

Figure 1
Figure 1. Behavior Paradigms and Recording Locations
(A) W-track. Animals had to learn to alternate between the three arms of the W-track for reward. (B) Y-track. In each trial initiated by poking in the home well, animals had to learn to visit the “silent well” when no sound was presented (75% of trials) and the “sound well” when the target sound was presented (25% of trials). (C) Histology illustrating recording locations. Nissl stained coronal sections showing electrode tracks and lesion location. (C1) W-track: dorsal CA1, (C2) W-track: intermediate CA1, (C3) Y track: dorsal CA1, (C4) W-track: medial PFC, (C5) Y track medial PFC. Scale bars are 1 mm. See also Figure S1 and Table S1.
Figure 2
Figure 2. Two Distinct Network Activity Patterns in the Hippocampus During Behavior
(A) Spike and local field potential (LFP) activity in CA1 region of the hippocampus (green) and PFC (black) as an animal approaches a reward well in the W-track spatial alternation task. From top to bottom, the plot shows respectively: broadband LFP (1–400 Hz) in CA1, ripple band filtered LFP (150–250 Hz) in CA1, raster plot with spikes from 18 CA1 place cells, broadband LFP in PFC, raster plot with spikes from 7 PFC neurons, and animal speed. Linear distance of the animal from the reward well is overlaid on the CA1 raster (grey line). The threshold speed, 4 cm/s, used to detect SWRs is indicated on the speed plot. Vertical gray rectangle backgrounds denote SWRs detected in CA1 LFP. Scale bars are 2 sec (horizontal), and 10 cm/s (vertical). (B) Shaded area over CA1 LFP from (A) on an expanded time scale. Theta filtered LFP (6–12 Hz) is shown overlaid with the broadband LFP. Scale bar = 250 ms. (C) Position of the animal on the W-track as it approaches the center reward well and stops to consume reward. Scale bar = 20 cm. (D) Time period marked by lines from (A) shown on an expanded time scale, illustrating activity in CA1 and PFC when the animal is stationary at the reward well. Note that one of the PFC neurons shows increased spiking during a subset of the hippocampal SWRs (marked by arrows). Scale bar = 500 ms. See also Figure S2.
Figure 3
Figure 3. Modulation of PFC Neuronal Spiking During Awake Hippocampal SWRs
(A) SWR-aligned rasters of example neurons (top), and corresponding average firing rates (bottom). Neurons in columns 1 and 2 showed strong excitation during SWRs (SWR-excited). Neurons in columns 3 and 4 were SWR-inhibited, and the neuron in column 5 was SWR-unmodulated (p’s < 10−3 for modulated neurons; p = 0.4 for unmodulated neuron. (B) SWR-triggered mean firing of all PFC units. Each row shows the z-scored mean SWR-triggered firing of one neuron. Neurons are ordered by their firing amplitude in a 0–200 ms window after SWR onset. Arrows mark the location of example neurons shown in (A). (C) Left, Population PSTHs for CA1, PFC SWR-excited and PFC SWR-inhibited cell populations sorted by the timing of the peak or trough in the SWR-modulated PSTH. Middle, Same plots for neurons recorded only on the W-track. Right, Same plots for neurons recorded only on the Y-track. (D) Population-averaged SWR-triggered PSTHs for CA1, PFC SWR-excited and SWR-inhibited populations. Shaded areas are s.e.m. (E) Left Distribution of the time of the peak of the SWR response for the populations in (D). Right Distribution of the onset rise / fall time of the SWR response for the populations in (D). Both SWR-excited and SWR-inhibited PFC populations had significantly later peaks/troughs and longer time to rise compared to the CA1 population (p’s < 0.001, rank-sum test). (F) Mean standardized cross-covariance during SWRs for CA1 vs. SWR-excited pairs (n = 393), and CA1 vs. SWR-inhibited pairs (n = 320). Insets show area around peaks. See also Table S2.
Figure 4
Figure 4. Phase Locking of PFC Neurons to Hippocampal Theta
(A) Left Normalized firing rates as a function of CA1 theta phase. Each row in the color plot shows the normalized theta-phase aligned histogram of a neuron with significant phase-locking. The rows are sorted by peak theta phase of each neuron. Right Polar plots quantifying the distribution of peak phases for the populations shown on left. Numbers on top right indicate radius of the plot, the scale for number of neurons. (B) Average concentration parameter (κ) quantifying strength of phase locking (*p < 0.01, **p< 0.001, rank-sum test). (C) Average SWR modulation in theta modulated and theta unmodulated PFC populations (**p < 0.01, rank-sum test). See also Table S3.
Figure 5
Figure 5. Evidence for Distinct Functional PFC Populations Related to SWR-Modulation
(A) Example occupancy normalized spatial firing rate maps of PFC cells with varying degrees of spatial coverage of the environment. Numbers in the lower right of each color plot indicate the firing rate corresponding to red. (B) Mean firing rates of SWR-excited, SWR-inhibited and SWR-unmodulated PFC populations (*p < 0.01, **p< 0.001, rank-sum test). (C) Spatial coverage of neurons. The CA1 population is also shown for comparison, and has significantly lower coverage than all the PFC populations (p< 10−4, rank-sum test; *p< 0.01, ***p< 10−4, rank-sum test). (D) Firing rate and speed correlation for a SWR-excited PFC cell (left, positively correlated) and SWR-inhibited PFC cell (right, negatively correlated) ***p< 0.0001, regression test. (E) Distribution of firing rate-speed correlations for the PFC populations. Overlaid are medians of distributions (**p< 0.01, rank-sum test). (F) Firing rate modulation index quantifying difference in pre-SWR periods (−500 to −100 ms before SWR onset) and high-speed periods (> 10 cm/sec). Index varies between −1 to +1, with +1 indicating firing only in the pre-SWR window and −1 indicating firing only during movement (**p< 0.01, rank-sum test). (G) Standardized cross-covariance during theta periods for PFC pairs belonging to different SWR-modulation populations. Left average population cross-covariances. Shaded areas are s.e.m. Right Average peak of the cross-covariance for the populations (**p< 0.001, ***p< 10−4, rank-sum test). See also Figure S3.
Figure 6
Figure 6. CA1-PFC Reactivation During Awake SWRs
(A) Top, number of spikes across all SWRs of one PFC neuron against number of spikes of a simultaneously recorded CA1 neuron. Spike counts were jittered for visualization only (Gaussian jitter with s.d. = 0.05 for x-axis, and s.d. = 0.1 for y-axis). Bottom, standardized cross-covariance of the neuronal pair during theta (r = 0.29, p = 4.5e−5***). (B) Same as in a, for a pair with negative SWR-correlation and low theta cross-covariance (r = −0.22, p = 0.0006***). (C) Left SWR correlation vs. theta cross-covariance for CA1 vs. SWR-excited PFC cells (n = 393 pairs; r = 0.39, p < 10−4). Right SWR correlation vs. theta cross-covariance for CA1 vs. SWR-inhibited PFC cells (n = 320 pairs, r = 0.39, p < 10−4). (D) Left A GLM obtained for an example CA1 ensemble and PFC cell, where spiking of the CA1 ensemble during SWRs was used to predict spiking of the PFC cell during SWRs. Edges represent GLM beta coefficients. Right The network from the left embedded within a larger network that includes the other PFC cells recorded simultaneously. Red dots represent SWR-excited PFC cells, blue dots represent SWR-inhibited PFC cells and cyan dots represent SWR-unmodulated PFC cells. (E) Cross-validated prediction for SWR-associated spiking of PFC SWR-modulated cells. Prediction is plotted as a function of the CA1 ensemble size. SWR-trained (striped bars) prediction performance increased with the size of the CA1 ensemble (1-way ANOVA, cell count group: p< 10−4). Movement-trained (white bars) prediction performance also increased with the size of the CA1 ensemble (1-way ANOVA, cell count group: p< 10−7). See also Figure S4.
Figure 7
Figure 7. CA1-PFC Reactivation reflects Spatial Correlations
(A) Example PFC neuron and three simultaneously recorded CA1 neurons. The purple and green lines represent significant positive and negative SWR-correlations, respectively. The corresponding SWR correlation coefficients are shown above their respective lines. (B) Normalized linear firing rate of the corresponding CA1 neurons from (A) for each of the W-track spatial trajectories, overlaid on the PFC firing rate in red. The spatial correlation coefficients for these CA1-PFC pairs are shown above their respective linear firing rate maps. (C) Spatial correlation vs. SWR correlation for (Left) CA1 vs. SWR-excited PFC cells (n = 393 pairs, r = 0.2, p < 10−3), and (Right) CA1 vs. SWR-inhibited PFC cells (n = 320 pairs; r = 0.36, p < 10−4). The SWR-inhibited population had stronger correlations than SWR-excited population, p < 0.01, shuffle test, n = 1000). See also Figures S5 and S6.
Figure 8
Figure 8. Task Related CA1-PFC Correlations are Not Present in Preceding Rest Periods
(A) SWR response correlation in pre-rest vs. task behavior for all CA1-PFC pairs recorded in both epochs for W-track behavior. (Left) CA1-PFC SWR excited pairs (n = 219, r = 0.08, p = 0.2). (Right) CA1-PFC SWR inhibited pairs (n = 196, r = 0.1, p > 0.1). (B) SWR response correlation vs. peak theta cross-covariance during task behavior vs. during pre-rest periods. (Left) CA1-PFC SWR excited pairs (n = 219, r = 0.02, p > 0.8). (Right) CA1-PFC SWR inhibited pairs (n = 196, r = 0.12, p > 0.1). (C) Pre-rest SWR response correlation vs. spatial correlation during behavior. (Left) CA1-PFC SWR excited pairs (n = 219, r = −0.02, p > 0.7). (Right) CA1-PFC SWR inhibited pairs (n = 196, r = 0.05, p > 0.5). (D) Comparison of cross-validated GLM models for prediction of SWR-associated spiking of PFC cells using CA1 cell activity. Task to task: Behavior model to predict behavioral data (n = 38 PFC SWR-modulated cells). Task to pre-rest: Behavior model to predict pre-rest data (n = 24 cells). Prediction was significantly lower than run-to-run performance (SWR-trained: ranksum test, n = 38 vs. n = 24 cells, p < 10−6 ; Theta-trained: p < 10−5). Pre-rest to task: Pre-sleep model to predict behavioral data (n = 22 cells). Prediction was significantly lower than run-to-run performance (SWR-trained: ranksum test, n = 38 vs. n = 22 cells, p < 10−6 ; Theta-trained: p < 10−4). Pre-rest to pre-rest: Pre-rest model to predict pre-rest data (n = 39 cells). Prediction was significantly higher than either of the two cross-epoch predictions (SWR-trained: ranksum test, n = 39 vs. n = 24 cells, p < 0.01; n = 39 vs. n = 22 cells, p < 0.01). See also Figure S7.

References

    1. Amaral DG, Witter MP. Hippocampal Formation. In: Paxinos C, editor. The Rat Nervous System. Academic Press; 1995. pp. 443–493.
    1. Baeg EH, Kim YB, Huh K, Mook-Jung I, Kim HT, Jung MW. Dynamics of population code for working memory in the prefrontal cortex. Neuron. 2003;40:177–188. - PubMed
    1. Benchenane K, Peyrache A, Khamassi M, Tierney PL, Gioanni Y, Battaglia FP, Wiener SI. Coherent theta oscillations and reorganization of spike timing in the hippocampal-prefrontal network upon learning. Neuron. 2010;66:921–936. - PubMed
    1. Born J, Wilhelm I. System consolidation of memory during sleep. Psychological research. 2012;76:192–203. - PMC - PubMed
    1. Buzsaki G. Two-stage model of memory trace formation: a role for “noisy” brain states. Neuroscience. 1989;31:551–570. - PubMed

Publication types