

Activity-Dependent Plasticity of Spike Pauses in Cerebellar Purkinje Cells
- PMID: 26972012
- PMCID: PMC4805497
- DOI: 10.1016/j.celrep.2016.02.054
Activity-Dependent Plasticity of Spike Pauses in Cerebellar Purkinje Cells
Abstract
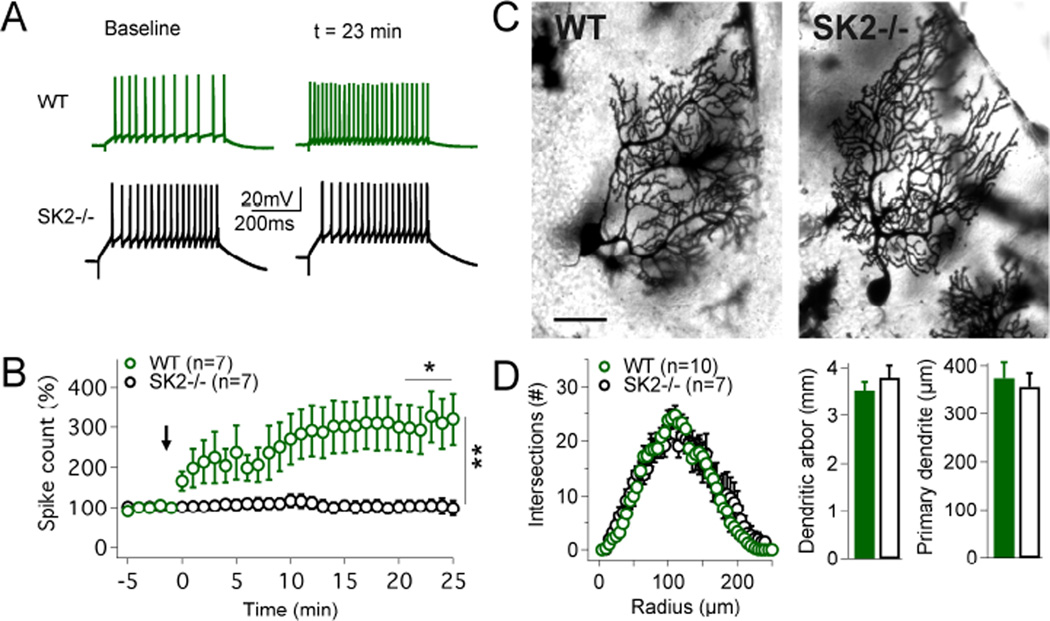
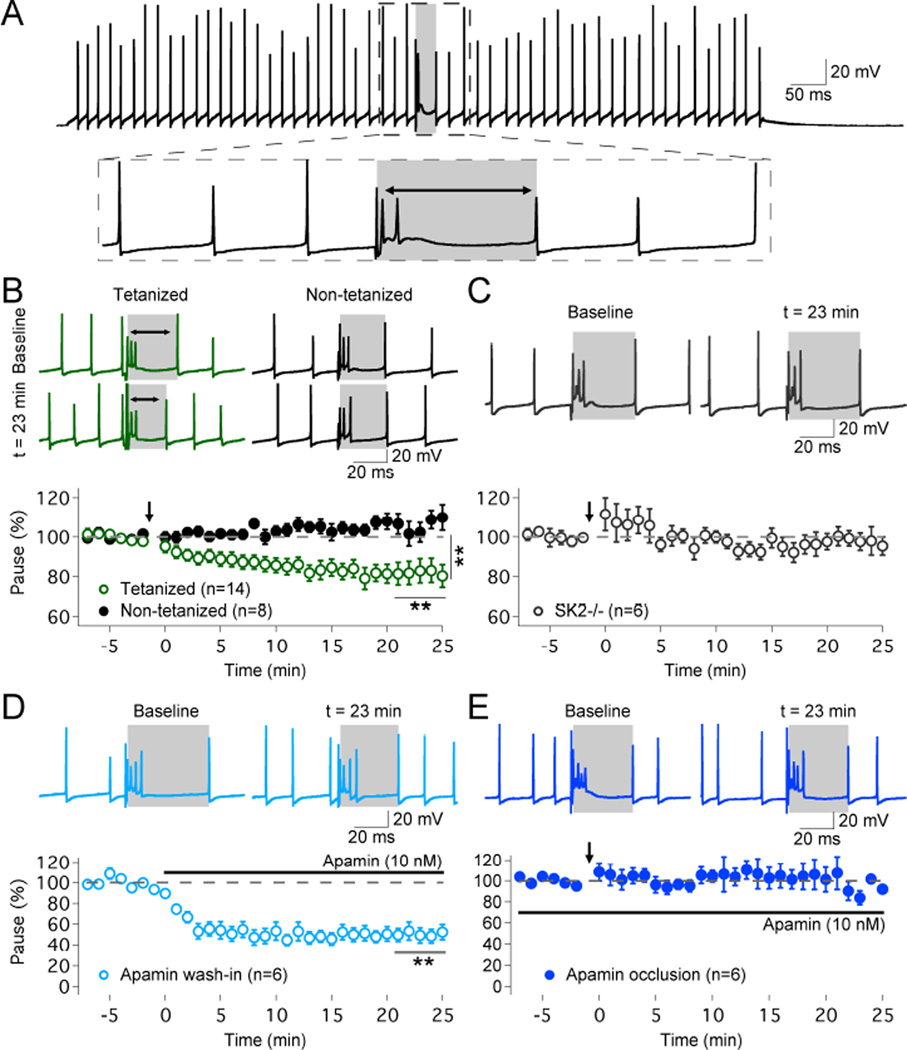
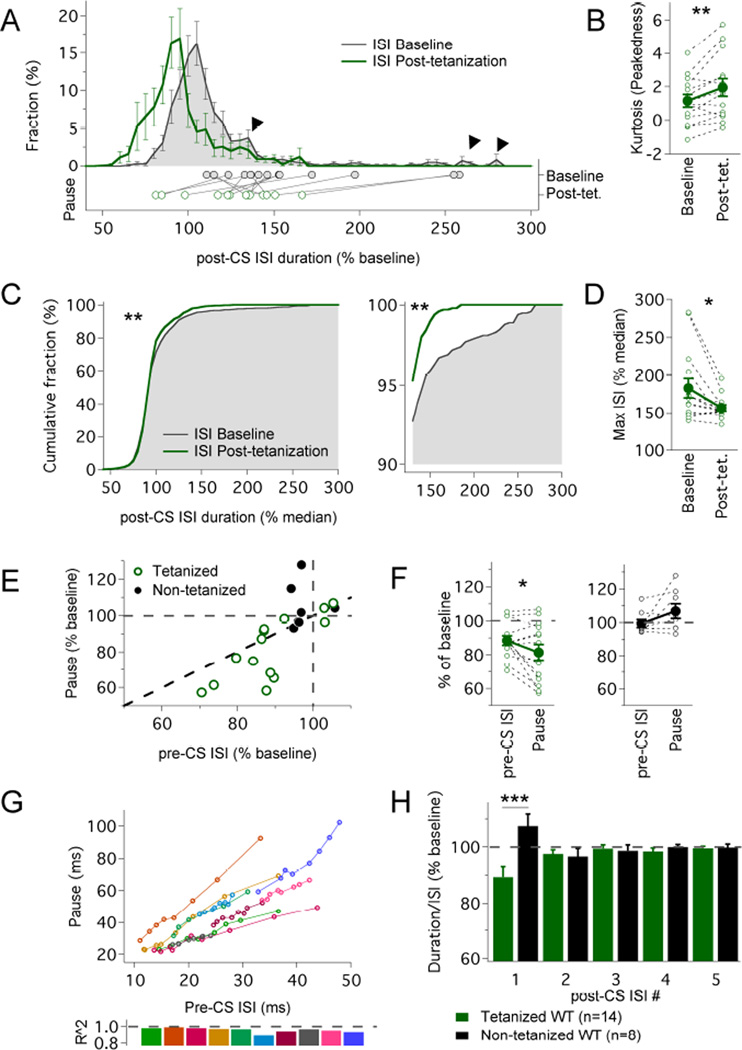
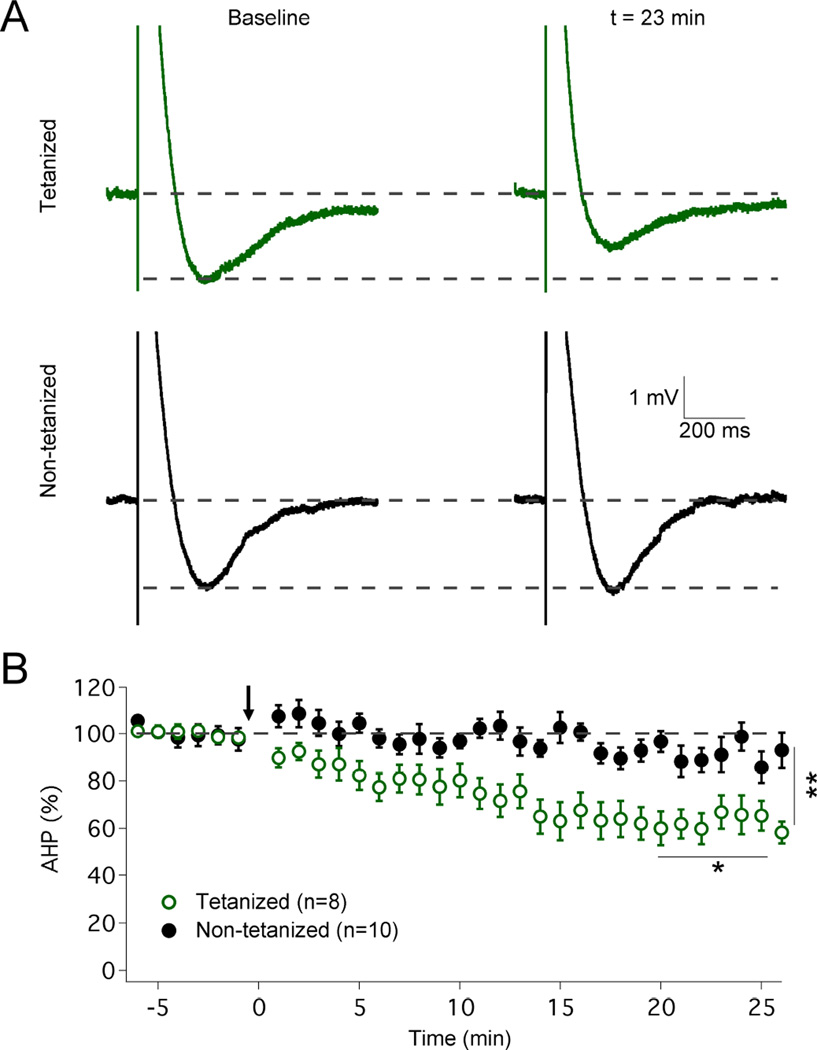
The plasticity of intrinsic excitability has been described in several types of neurons, but the significance of non-synaptic mechanisms in brain plasticity and learning remains elusive. Cerebellar Purkinje cells are inhibitory neurons that spontaneously fire action potentials at high frequencies and regulate activity in their target cells in the cerebellar nuclei by generating a characteristic spike burst-pause sequence upon synaptic activation. Using patch-clamp recordings from mouse Purkinje cells, we find that depolarization-triggered intrinsic plasticity enhances spike firing and shortens the duration of spike pauses. Pause plasticity is absent from mice lacking SK2-type potassium channels (SK2(-/-) mice) and in occlusion experiments using the SK channel blocker apamin, while apamin wash-in mimics pause reduction. Our findings demonstrate that spike pauses can be regulated through an activity-dependent, exclusively non-synaptic, SK2 channel-dependent mechanism and suggest that pause plasticity-by altering the Purkinje cell output-may be crucial to cerebellar information storage and learning.
Copyright © 2016 The Authors. Published by Elsevier Inc. All rights reserved.
Conflict of interest statement
The authors declare no conflict of interest.
Figures
Similar articles
-
SK2 channel modulation contributes to compartment-specific dendritic plasticity in cerebellar Purkinje cells.Neuron. 2012 Jul 12;75(1):108-20. doi: 10.1016/j.neuron.2012.05.025. Neuron. 2012. PMID: 22794265 Free PMC article.
-
Iberiotoxin-sensitive large conductance Ca2+ -dependent K+ (BK) channels regulate the spike configuration in the burst firing of cerebellar Purkinje neurons.Brain Res. 2008 May 30;1212:1-8. doi: 10.1016/j.brainres.2008.03.030. Epub 2008 Mar 27. Brain Res. 2008. PMID: 18439989
-
Developmental regulation of small-conductance Ca2+-activated K+ channel expression and function in rat Purkinje neurons.J Neurosci. 2002 Jun 1;22(11):4456-67. doi: 10.1523/JNEUROSCI.22-11-04456.2002. J Neurosci. 2002. PMID: 12040053 Free PMC article.
-
SK2 channel expression and function in cerebellar Purkinje cells.J Physiol. 2011 Jul 15;589(Pt 14):3433-40. doi: 10.1113/jphysiol.2011.205823. Epub 2011 Apr 26. J Physiol. 2011. PMID: 21521760 Free PMC article. Review.
-
Patterns and pauses in Purkinje cell simple spike trains: experiments, modeling and theory.Neuroscience. 2009 Sep 1;162(3):816-26. doi: 10.1016/j.neuroscience.2009.02.040. Epub 2009 Feb 26. Neuroscience. 2009. PMID: 19249335 Review.
Cited by
-
SK2 Channels Associate With mGlu1α Receptors and CaV2.1 Channels in Purkinje Cells.Front Cell Neurosci. 2018 Sep 19;12:311. doi: 10.3389/fncel.2018.00311. eCollection 2018. Front Cell Neurosci. 2018. PMID: 30283304 Free PMC article.
-
Protein kinase Cγ in cerebellar Purkinje cells regulates Ca2+-activated large-conductance K+ channels and motor coordination.Proc Natl Acad Sci U S A. 2022 Feb 15;119(7):e2113336119. doi: 10.1073/pnas.2113336119. Proc Natl Acad Sci U S A. 2022. PMID: 35145028 Free PMC article.
-
Muscarinic Modulation of SK2-Type K+ Channels Promotes Intrinsic Plasticity in L2/3 Pyramidal Neurons of the Mouse Primary Somatosensory Cortex.eNeuro. 2020 Mar 16;7(2):ENEURO.0453-19.2020. doi: 10.1523/ENEURO.0453-19.2020. Print 2020 Mar/Apr. eNeuro. 2020. PMID: 32005752 Free PMC article.
-
Inferior Olive HCN1 Channels Coordinate Synaptic Integration and Complex Spike Timing.Cell Rep. 2018 Feb 13;22(7):1722-1733. doi: 10.1016/j.celrep.2018.01.069. Cell Rep. 2018. PMID: 29444426 Free PMC article.
-
Mechanisms of Spontaneous Climbing Fiber Discharge-Evoked Pauses and Output Modulation of Cerebellar Purkinje Cell in Mice.Front Cell Neurosci. 2017 Aug 22;11:247. doi: 10.3389/fncel.2017.00247. eCollection 2017. Front Cell Neurosci. 2017. PMID: 28878623 Free PMC article.
References
-
- Aizenman CD, Linden DJ. Rapid, synaptically driven increases in the intrinsic excitability of cerebellar deep nuclear neurons. Nat. Neurosci. 2000;3:109–111. - PubMed
-
- Bell CC, Grimm RJ. Discharge properties of Purkinje cells recorded on single and double microelectrodes. J. Neurophysiol. 1969;32:1044–1055. - PubMed
Publication types
MeSH terms
Substances
Grants and funding
LinkOut - more resources
Full Text Sources
Other Literature Sources
Molecular Biology Databases
Miscellaneous
