Review
. 2016 Jul;1858(7 Pt B):1594-609.
doi: 10.1016/j.bbamem.2016.03.012. Epub 2016 Mar 10.

Membrane remodeling and mechanics: Experiments and simulations of α-Synuclein

Affiliations
Review

Membrane remodeling and mechanics: Experiments and simulations of α-Synuclein

Ana West et al. Biochim Biophys Acta. 2016 Jul.

Abstract

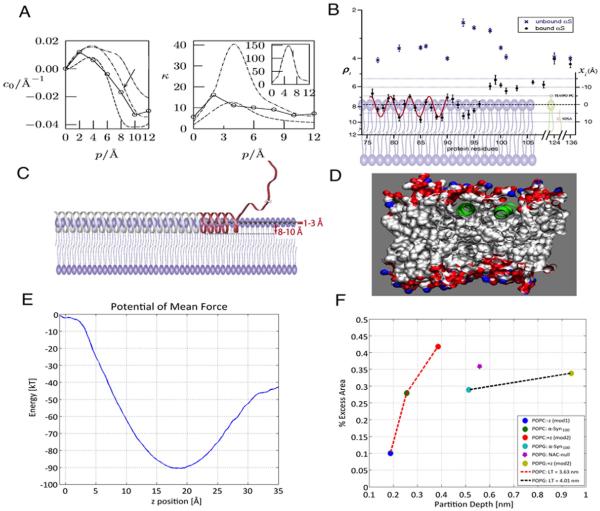
We review experimental and simulation approaches that have been used to determine curvature generation and remodeling of lipid bilayers by membrane-bending proteins. Particular emphasis is placed on the complementary approaches used to study α-Synuclein (αSyn), a major protein involved in Parkinson's disease (PD). Recent cellular and biophysical experiments have shown that the protein 1) deforms the native structure of mitochondrial and model membranes; and 2) inhibits vesicular fusion. Today's advanced experimental and computational technology has made it possible to quantify these protein-induced changes in membrane shape and material properties. Collectively, experiments, theory and multi-scale simulation techniques have established the key physical determinants of membrane remodeling and rigidity: protein binding energy, protein partition depth, protein density, and membrane tension. Despite the exciting and significant progress made in recent years in these areas, challenges remain in connecting biophysical insights to the cellular processes that lead to disease. This article is part of a Special Issue entitled: Membrane Proteins edited by J.C. Gumbart and Sergei Noskov.

Keywords: Bilayer rigidity; Coarse-grained molecular dynamics (CGMD); Membrane curvature; Parkinson's disease; Synaptic vesicles; Tubulation; α-Synuclein.


Figures

Fig. 1
Fig. 1
Cartoon representations to differentiate between the two conceptual models typically used to explain protein-imparted curvatures: (A) In the scaffolding mechanism, several rigid protein domains (coiled-coil structural motifs) adhere to and bend the bilayer. The Amphiphysin N-Bar domain, which induces positive curvature is shown on the left, and the I-BAR (inverse BAR) domain, which induces negative curvature, is shown on the right (for additional examples see also http://www.endocytosis.org/BARdomains/BARs.html). (B) In the ‘wedging’ or the ‘protein insertion’ mechanism, a single rigid α-helix lodges itself inside the bilayer at an interfacial location referred to as the protein's partition depth, causing the bilayer to bend away from the protein. We illustrate this method by showing αSyn embedded in a lipid bilayer. The partition depth is determined by the chemical nature of the amino acids and the physicochemical properties of the bilayer.
Fig. 2
Fig. 2
αSyn-imparted curvatures in POPC–POPS bilayers from coarse-grained molecular dynamics (CGMD) simulations. (A) <k1> is the maximum principle curvature from which the diameter D is calculated (D = 2/<k1>). (B) Both positive and negative Gaussian curvatures (<Kg>) resulted, consistent with Helfrich's hat model [91]. (C) Representative height surfaces, h(x,y) = z for the outer leaflet of a POPC–POPS bilayer with multiple αSyn monomers show that the effect in (A) remains when the protein density is increased. Color map units are nanometers. In all panels, the white star indicates the N-terminus of αSyn. All images are from Braun et al. (2012) [74], reproduced with the author's permission.
Fig. 3
Fig. 3
αSyn's partition depth from theory, simulations, and experiments: (A) Spontaneous curvature and bending rigidity vary with partition depth. Left: Spontaneous curvature (co) vs. protein partition depth (p). Right: Bending rigidity constant (kc, units of kbT) vs. the protein's partition depth (p). The lines in both panels correspond to three non-equilibrium hydrophobic bilayer thicknesses: 26 Å, 24 Å, and 22 Å. The arrow indicates the system with intermediate thickness and the dashed line belongs to the thinnest bilayer. The curve marked with open circles represents the equilibrium bilayer thickness. (Figure by Zemel et al. (2008) [102] reproduced with permission from the author.) (B) NMR relaxometry data, specifically Overhauser dynamic nuclear polarization (ODNP) shows retardation factor (ρt) vs. distance (xi) for αSyn residues with respect to the phosphate group of POPC–POPS bilayer. (C) A composite figure compares this ODNP data (red ribbon) with prior (EPR) data (gray ribbon) [36,37]. The black dashed line shows the center of the helix. (The original figures, (B) and (C), were published by Cheng et al. (2013) [38] and are included here with permission from the author.) (D) VMD snapshot shows αSyn's partition depth in a DOPS bilayer from an atomistic molecular dynamics (MD) simulation. (Image by Perlmutter et al. (2009) [108], published here with permission from the author.) (E) Potential of mean force profile (PMF) obtained using coarse-grained molecular dynamics (CGMD) simulations reveals αSyn's partition depth in a POPC–POPS bilayer. (The PMF was originally published by Braun et al. (2012) in the supplemental information of reference [74] and included here with permission from the author.) (F) Comparison between αSyn variants adsorbed to neutral POPC, or anionic POPG, lipid bilayers shows how the excess area in the bilayer changes with partition depth. The bilayers differ in lipid head-group charge and hydrophobic thicknesses (2DC). The ‘mod1’ and ‘mod2’ refer to αSyn variants changed to make the peptide more hydrophobic or more hydrophilic, respectively. For a description of how the amino-acids were changed, see the supplement of Braun et al. (2014) [23]. The figure is reproduced from this study with the author's permission.
Fig. 4
Fig. 4
Protein-induced tubulation from experiments and simulations: (A) Remodeling by Amphiphysin N-BAR protein is shown using a mesoscale simulation in the two images on the left, and with an electron microscopy (EM) micrograph on the right. These images show strikingly similar tube diameters and void shapes. (For a detailed description of the colors in the two simulation images, see Atyon et al. (2009) [39], from which we reproduced these images with the author's permission.) (B) Wild-type (wt) αSyn's ability to impress tubulation is shown using EM. The arrows show smaller tubes extending out of larger tubes. The black scale bar is 100 nm. The lipid composition is POPG:POPC (1:4 molar ratio) and 1:10 protein to lipid ratio. (This image was produced by Varkey et al. (2010) [7] and it is included here with permission from the author.) (C) The protein's binding affinity was determined from fluorescence correlation spectroscopy (FCS) curves of large unilamellar vesicles (LUVs) made of either pure POPG, 100% POPG + wt-αSyn, or (1:1 ratio) POPG:POPC + wt-αSyn. A greater shift to the right indicates a larger fraction of αSyn bound to vesicles. (D) A vesicle clearance assay captures significant tubulation in 100% POPG with added wt-αSyn (inset). The resulting tubulation capacity is displayed as a bar graph. (E) Another vesicle clearance assay show that the NAC-null variant reduces tubulation capacity in a 100% POPG system relative to wt-αSyn. (F) and (G) show curvature fields from CGMD simulations of anionic POPG bilayers with wt-αSyn and the NAC-null variant, respectively. The images display the evolution in bilayer height (<h(x,y)>) under high density protein coverage (400:1 lipid to protein ratio). (H) CGMD simulation results compare the (%) excess area per protein in low protein density bilayers (1600:1, blue) conditions to the excess area under in higher protein density bilayers (400:1, green) for both wt-αSyn and the NAC-null variant. The tubulation measured in experiment (D) correlates with the (%) excess area values shown here. (Panels (C) through (H) were all originally published in the main body or in the supporting information of Braun et al. (2014) [23] and are included here with permission from the author.
Fig. 5
Fig. 5
wt-αSyn's ability to initiate tubulation determined from coarse-grain molecular dynamics (CGMD) simulations. (A) The figure shows a VMD representation of the evolved tubule at 300 ns. This system consists of ~85,000 POPG lipids and 48 αSyn proteins adsorbed unto the bilayer in the extended-helix conformation. The height to the top of the mound from the flat region at the base is ~25 nm. (B) Lipid tail ordering asymmetry ΔSz determined as the difference of mean order parameter of each monolayer is shown across the 850 ns CGMD trajectory. (C) The total number of inter-leaflet contacts found near the protein is compared to the number of contacts in the bulk bilayer region. The inset shows the contacts found within the first shell. All figures were reproduced from Braun et al. (2014) [23], with the author's permission.
Fig. 6
Fig. 6
Experiment and simulation strategies to study pure and the protein-added bilayer structures. (A) The image displays the form factor from Low-Angle X-ray Scattering (LAXS) experiment of POPC–POPS bilayer stacks with added protein (200:1). Comparing the red line (added protein) to the black (pure bilayer) shows that αSyn thins the bilayer (q shift to higher values). The inset shows the resulting electron density profile (EDP). (B) Detected changes in bilayer thickness (ΔDPP) from coarse-grained molecular dynamics (CGMD) Martini simulations due to bound αSyn are shown. ΔDPP was evaluated using methodology derived by our group to eliminate the thermal undulations effects [132]. The figure is from Braun et al. (2012) [74], reproduced here with the author's permission.
Fig. 7
Fig. 7
Bilayer rigidity in experiments and computational models: (A) Diffuse x-ray scattering intensities for a DOPC–DOPE (1:1) bilayer at a fraction x = 0.034 HIV-1 Tat protein. (B) Bending rigidity constants (kc) obtained from diffuse scattering profiles are shown with changing protein concentration and lipid composition (P: protein concentration, L: lipid concentration). In all instances, increasing the protein concentration softens the bilayers. The nuclear membrane mimic shows a more pronounced drop in rigidity with increasing the HIV-1 Tat concentration (◆ symbol, turquoise color), than the other compositions. (Images (A) and (B) are from Akabori et al. (2014) [43] and are displayed here with the author's permission.) (C) Undulation spectra (Su(q)) and number density structure factors (Sρ(q)) of pure bilayers determined from molecular dynamics (MD) simulations. Two different force field representations were employed, the united atom (UA) and the coarse grain (CG). The resulting kc values differ by a factor of ~2 (kc = 7.5 × 10⁻²⁰ J from UA and kc = 15 × 10−20 J from CG). (The image was originally published by Brandt et al. (2011) [72].) (D) Variations in bending modulus (left axis) and imparted spontaneous curvatures (right axis) with increasing the protein surface coverage at three bilayer heights. The computational technique used in this study is the continuum elastic modeling (CEM) [77]. Image by Sodt and Pastor (2014) [159], reproduced with permission from the author.
Fig. 8
Fig. 8. Rigidity of lipid vesicles from experiments and simulations
(A) An AFM topography image of a DMPC vesicle obtained using pulsed-force mode imaging. (B) Example force curve during vesicle indentation. (C) Stiffness image of the DMPC vesicle shown in (A). The stiffness is obtained by fitting the slope of the curve shown in (B) (the black box). Lighter colors represent lower stiffness values than darker colors. (D) A 9 μs snapshot from a coarse-grained molecular dynamics simulation of viral capsid indentation with an AFM probe tip. The tip is orange, the substrate is grey and the capsid proteins are green, red, blue, and yellow (Used with permission from Arkhipov et al. (2009) [179]). (E) Snapshot from a coarse-grained molecular dynamics (CGMD ) simulation of a DPPC vesicle coated with αSyn monomers. (F) Lateral pressure profiles of pure DPPC(−) and DPPC + αSyn (−) vesicles that indicate a softening due to the added protein. The arrows point to the significant pressure profile changes introduced by αSyn. (G) Fluctuation spectra <|alm|2> for DPPC and DPPC + αSyn vesicles in CGMD simulations. The higher fluctuations in the DPPC + αSyn case (red symbols), describe a softer vesicle. (Panels (E), (F), and (G) were originally published by Braun and Sachs (2015) [70], and are reproduced here with permission from the author).

References

    1. Nakamura K, Nemani VM, Azarbal F, Skibinski G, Levy JM, Egami K, Munishkina L, Zhang J, Gardner B, Wakabayashi J, Sesaki H, Cheng Y, Finkbeiner S, Nussbaum RL, Masliah E, Edwards RH. Direct membrane association drives mitochondrial fission by the Parkinson disease-associated protein alpha-synuclein. J. Biol. Chem. 2011;286:20710–20726. - PMC - PubMed
    1. Safari F, Suetsugu S. The BAR Domain superfamily proteins from subcellular structures to human diseases. Membranes (Basel) 2012;2:91–117. - PMC - PubMed
    1. Mim C, Cui H, Gawronski-Salerno JA, Frost A, Lyman E, Voth GA, Unger VM. Structural basis of membrane bending by the N-BAR protein endophilin. Cell. 2012;149:137–145. - PMC - PubMed
    1. Frost A, Unger VM, De Camilli P. The BAR domain superfamily: membrane-molding macromolecules. Cell. 2009;137:191–196. - PMC - PubMed
    1. Cui H, Lyman E, Voth GA. Mechanism of membrane curvature sensing by amphipathic helix containing proteins. Biophys. J. 2011;100:1271–1279. - PMC - PubMed

Publication types