

Differential network analysis reveals the genome-wide landscape of estrogen receptor modulation in hormonal cancers
- PMID: 26972162
- PMCID: PMC4789788
- DOI: 10.1038/srep23035
Differential network analysis reveals the genome-wide landscape of estrogen receptor modulation in hormonal cancers
Abstract
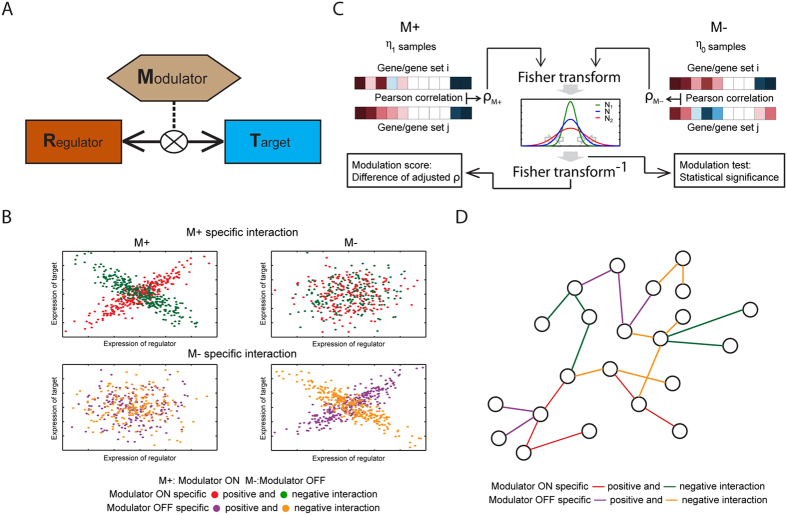
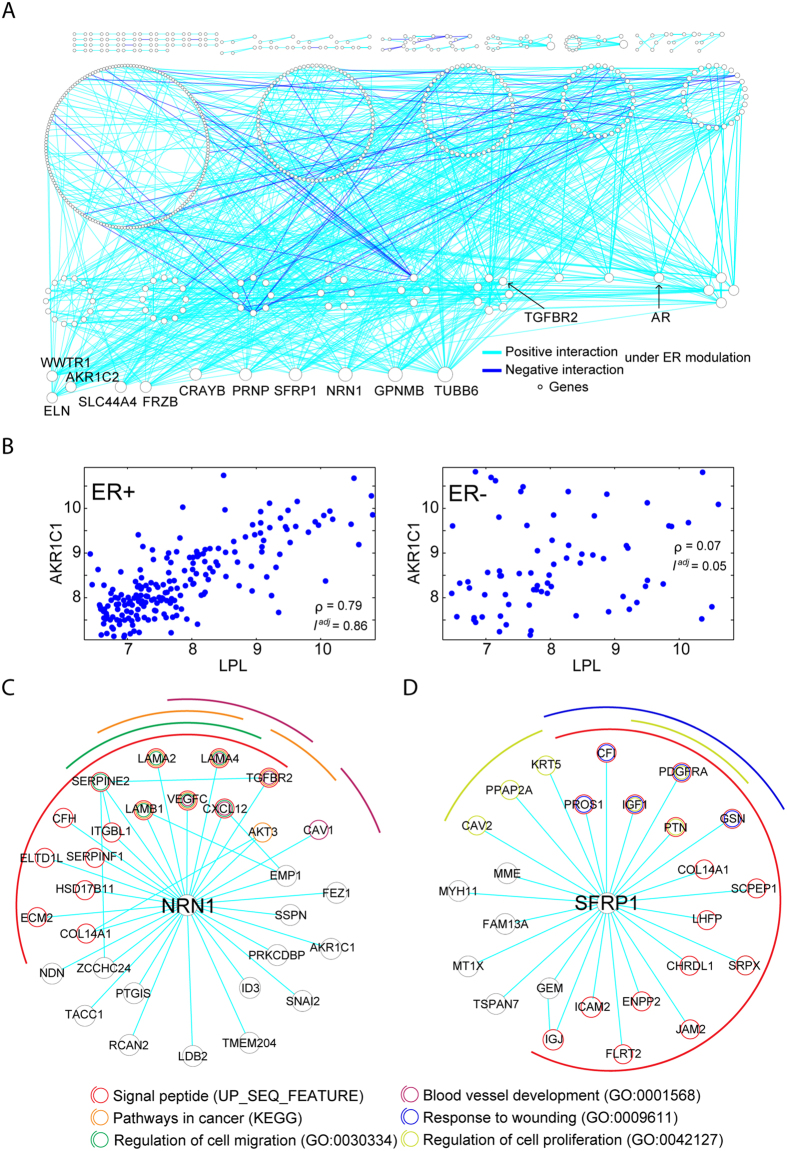
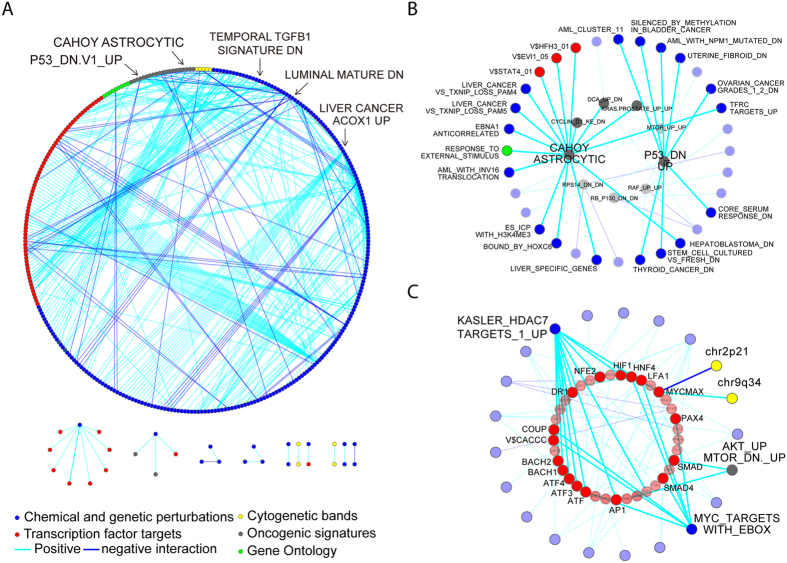
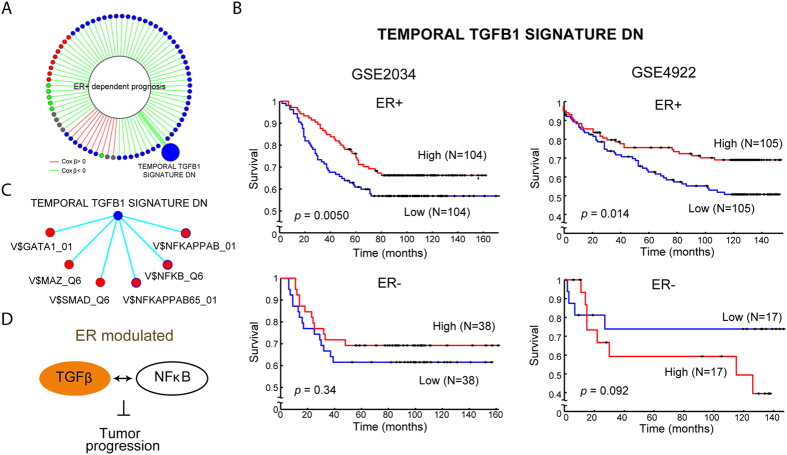
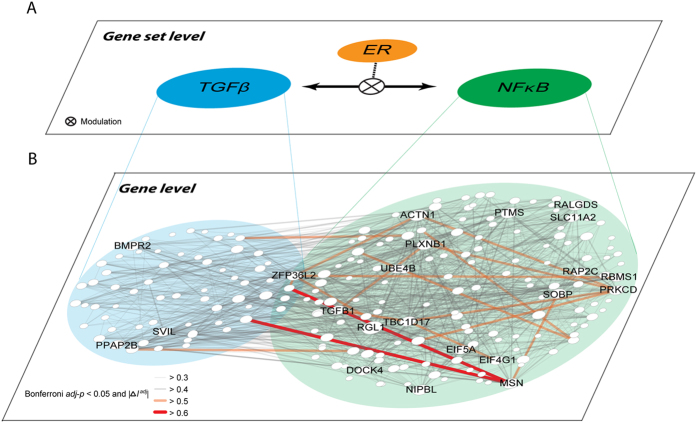
Several mutual information (MI)-based algorithms have been developed to identify dynamic gene-gene and function-function interactions governed by key modulators (genes, proteins, etc.). Due to intensive computation, however, these methods rely heavily on prior knowledge and are limited in genome-wide analysis. We present the modulated gene/gene set interaction (MAGIC) analysis to systematically identify genome-wide modulation of interaction networks. Based on a novel statistical test employing conjugate Fisher transformations of correlation coefficients, MAGIC features fast computation and adaption to variations of clinical cohorts. In simulated datasets MAGIC achieved greatly improved computation efficiency and overall superior performance than the MI-based method. We applied MAGIC to construct the estrogen receptor (ER) modulated gene and gene set (representing biological function) interaction networks in breast cancer. Several novel interaction hubs and functional interactions were discovered. ER+ dependent interaction between TGFβ and NFκB was further shown to be associated with patient survival. The findings were verified in independent datasets. Using MAGIC, we also assessed the essential roles of ER modulation in another hormonal cancer, ovarian cancer. Overall, MAGIC is a systematic framework for comprehensively identifying and constructing the modulated interaction networks in a whole-genome landscape. MATLAB implementation of MAGIC is available for academic uses at https://github.com/chiuyc/MAGIC.
Figures
Similar articles
-
Genome-wide identification of key modulators of gene-gene interaction networks in breast cancer.BMC Genomics. 2017 Oct 3;18(Suppl 6):679. doi: 10.1186/s12864-017-4028-4. BMC Genomics. 2017. PMID: 28984209 Free PMC article.
-
SERPINA1 is a direct estrogen receptor target gene and a predictor of survival in breast cancer patients.Oncotarget. 2015 Sep 22;6(28):25815-27. doi: 10.18632/oncotarget.4441. Oncotarget. 2015. PMID: 26158350 Free PMC article.
-
Pathway Relevance Ranking for Tumor Samples through Network-Based Data Integration.PLoS One. 2015 Jul 28;10(7):e0133503. doi: 10.1371/journal.pone.0133503. eCollection 2015. PLoS One. 2015. PMID: 26217958 Free PMC article.
-
Is gene array testing to be considered routine now?Breast. 2011 Oct;20 Suppl 3:S87-91. doi: 10.1016/S0960-9776(11)70301-0. Breast. 2011. PMID: 22015300 Review.
-
Boosting signal-to-noise in complex biology: prior knowledge is power.Cell. 2011 Mar 18;144(6):860-3. doi: 10.1016/j.cell.2011.03.007. Cell. 2011. PMID: 21414478 Free PMC article. Review.
Cited by
-
FACS-Seq analysis of Pax3-derived cells identifies non-myogenic lineages in the embryonic forelimb.Sci Rep. 2018 May 16;8(1):7670. doi: 10.1038/s41598-018-25998-1. Sci Rep. 2018. PMID: 29769607 Free PMC article.
-
Differential co-expression-based detection of conditional relationships in transcriptional data: comparative analysis and application to breast cancer.Genome Biol. 2019 Nov 14;20(1):236. doi: 10.1186/s13059-019-1851-8. Genome Biol. 2019. PMID: 31727119 Free PMC article.
-
Higher HOPX expression is associated with distinct clinical and biological features and predicts poor prognosis in de novo acute myeloid leukemia.Haematologica. 2017 Jun;102(6):1044-1053. doi: 10.3324/haematol.2016.161257. Epub 2017 Mar 24. Haematologica. 2017. PMID: 28341738 Free PMC article.
-
GSAE: an autoencoder with embedded gene-set nodes for genomics functional characterization.BMC Syst Biol. 2018 Dec 21;12(Suppl 8):142. doi: 10.1186/s12918-018-0642-2. BMC Syst Biol. 2018. PMID: 30577835 Free PMC article.
-
Classification of Cancer Types Using Graph Convolutional Neural Networks.Front Phys. 2020 Jun;8:203. doi: 10.3389/fphy.2020.00203. Epub 2020 Jun 17. Front Phys. 2020. PMID: 33437754 Free PMC article.
References
Publication types
MeSH terms
Substances
Grants and funding
LinkOut - more resources
Full Text Sources
Other Literature Sources
Medical
