. 2016 Apr;37(4):483-96.
doi: 10.1038/aps.2015.167. Epub 2016 Mar 14.

Rutaecarpine ameliorates hyperlipidemia and hyperglycemia in fat-fed, streptozotocin-treated rats via regulating the IRS-1/PI3K/Akt and AMPK/ACC2 signaling pathways

Affiliations

Rutaecarpine ameliorates hyperlipidemia and hyperglycemia in fat-fed, streptozotocin-treated rats via regulating the IRS-1/PI3K/Akt and AMPK/ACC2 signaling pathways

Xu-qiang Nie et al. Acta Pharmacol Sin. 2016 Apr.

Abstract

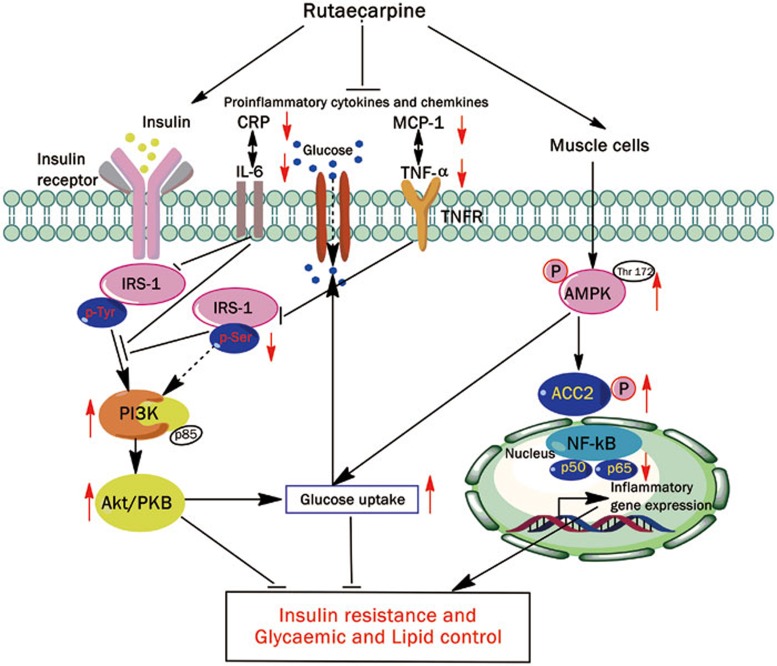
Aim: We have shown that rutaecarpine extracted from the dried fruit of Chinese herb Evodia rutaecarpa (Juss) Benth (Wu Zhu Yu) promotes glucose consumption and anti-inflammatory cytokine expression in insulin-resistant primary skeletal muscle cells. In this study we investigated whether rutaecarpine ameliorated the obesity profiles, lipid abnormality, glucose metabolism and insulin resistance in rat model of hyperlipidemia and hyperglycemia.

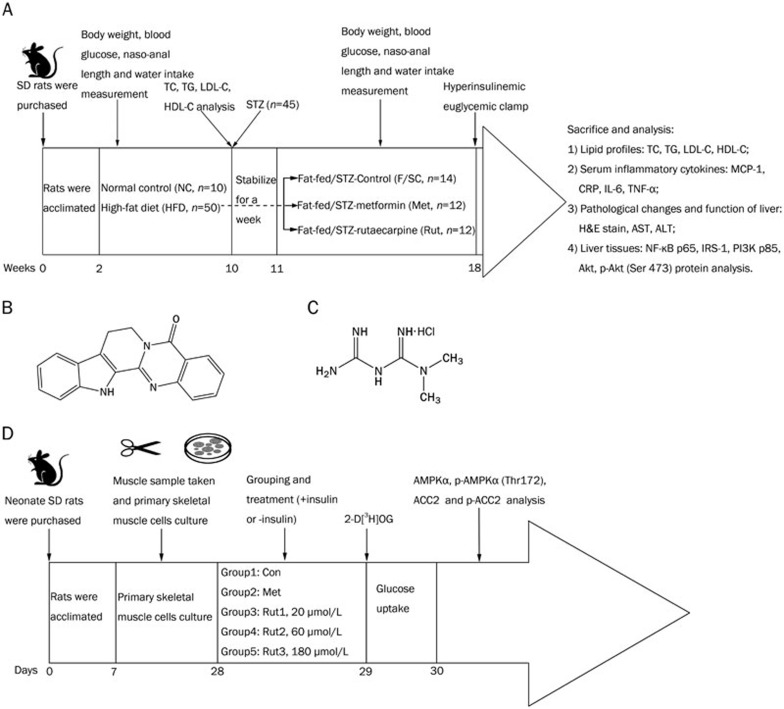
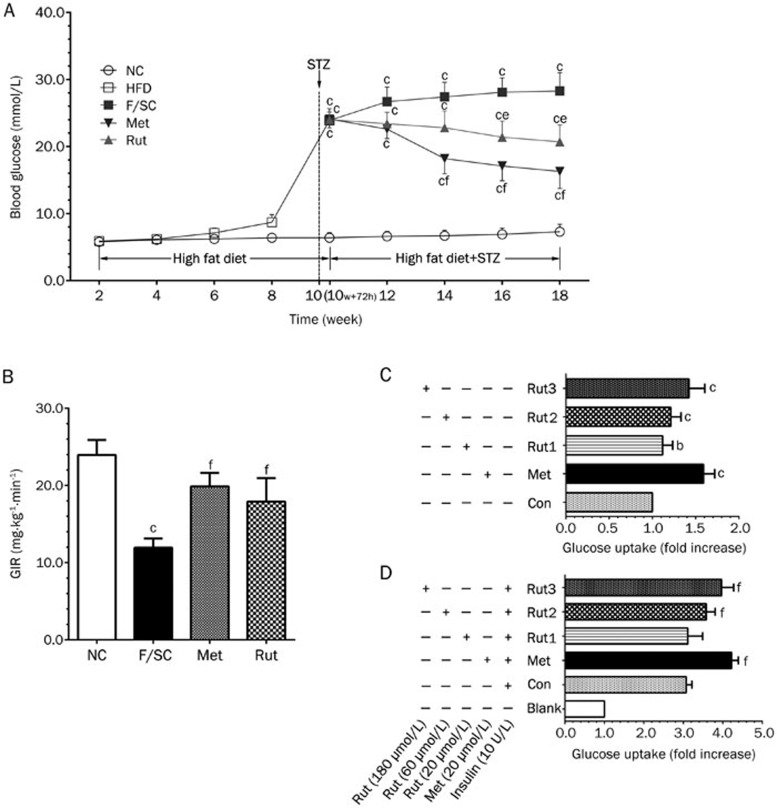
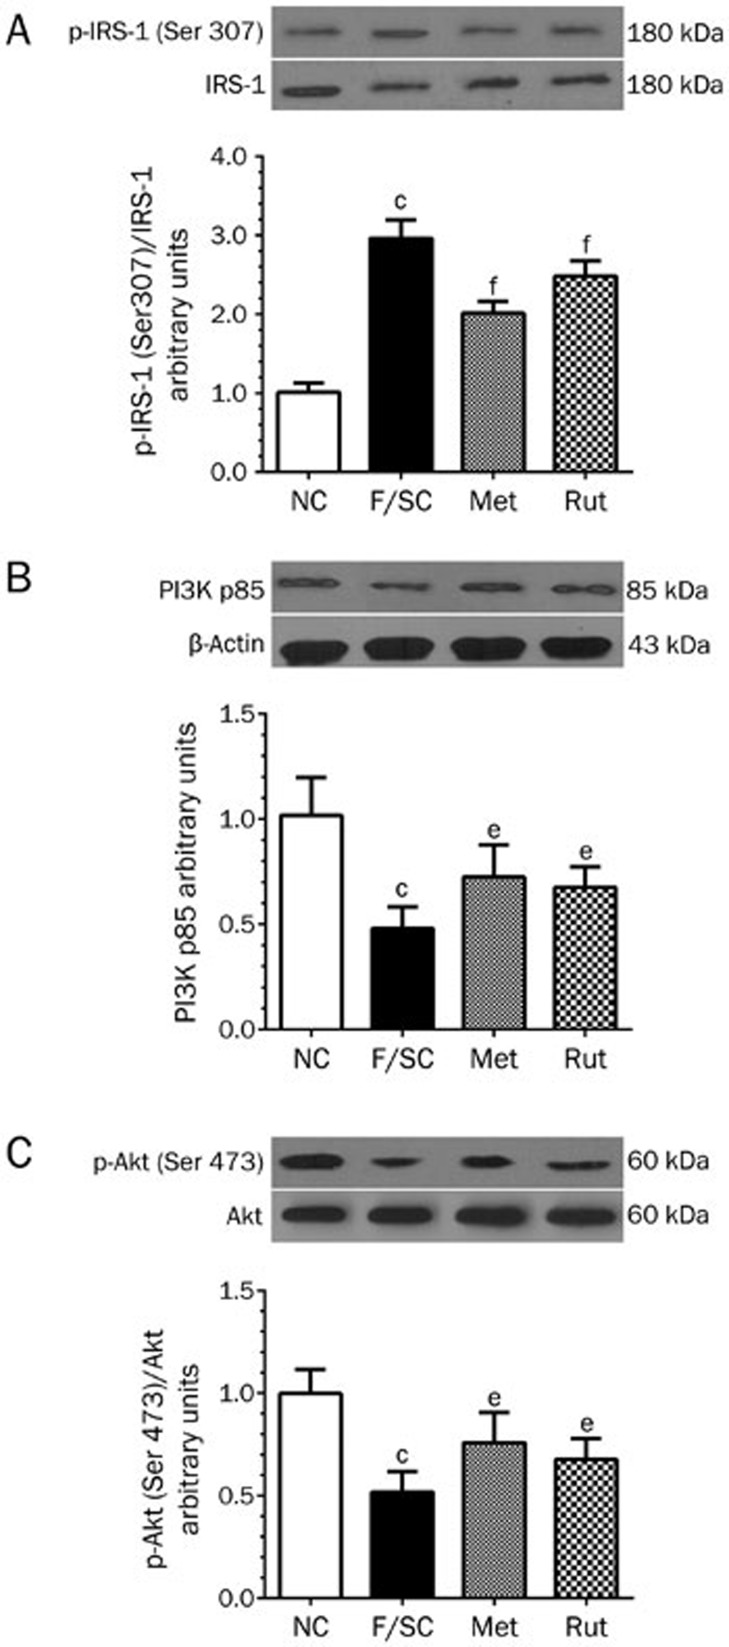
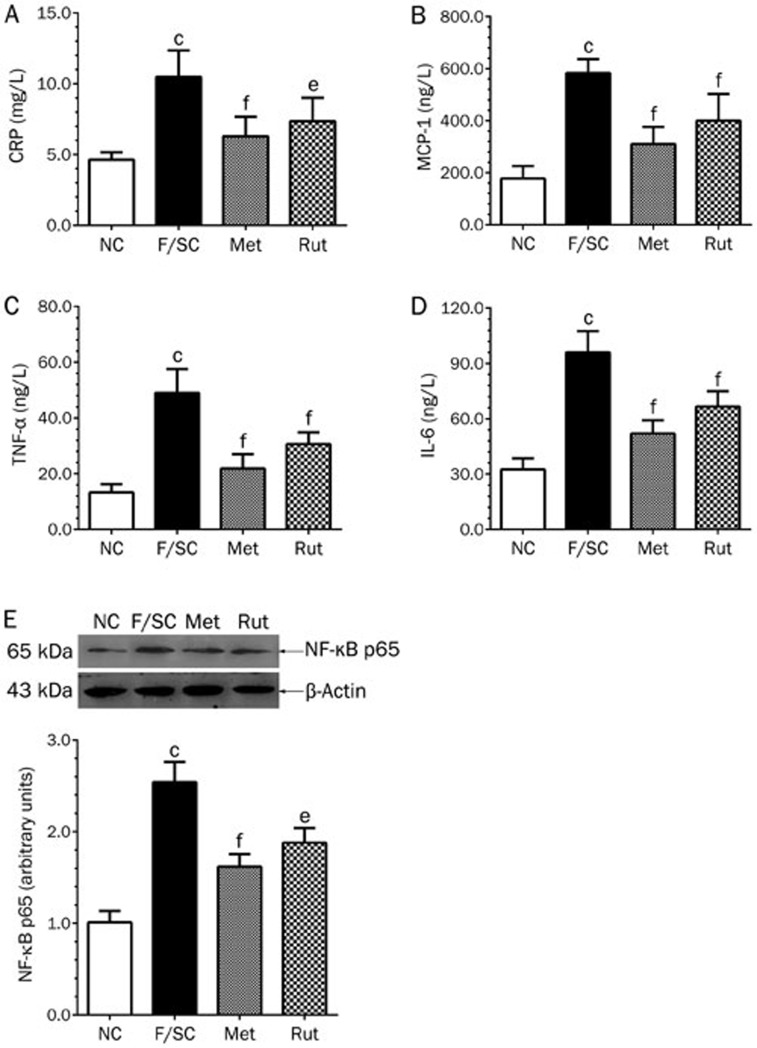
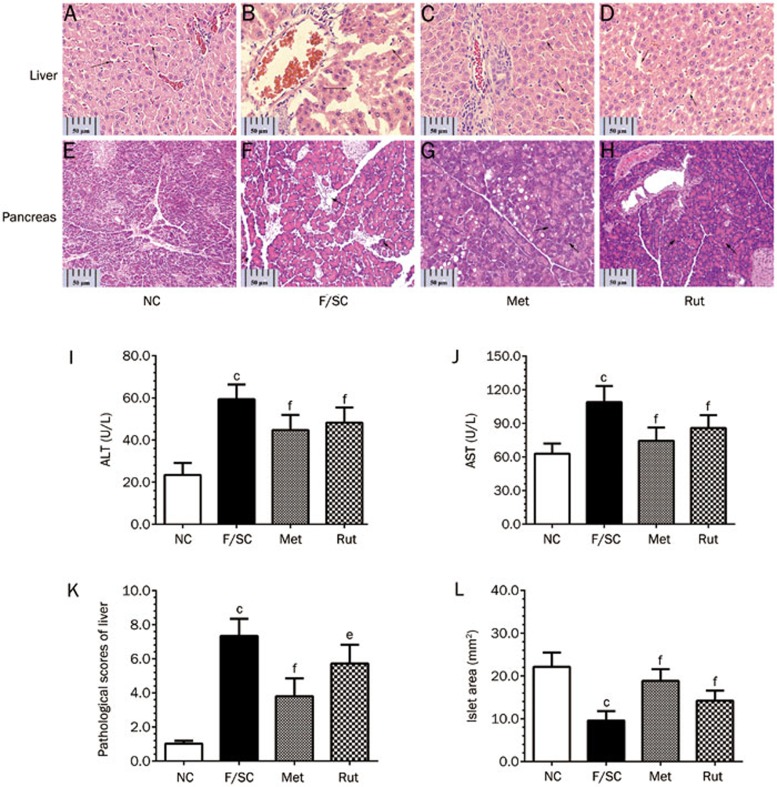
Methods: Rats fed on a high-fat diet for 8 weeks, followed by injection of streptozotocin (30 mg/kg, ip) to induce hyperlipidemia and hyperglycemia. One week after streptozotocin injection, the fat-fed, streptozotocin-treated rats were orally treated with rutaecarpine (25 mg·kg(-1)·d(-1)) or a positive control drug metformin (250 mg·kg(-1)·d(-1)) for 7 weeks. The body weight, visceral fat, blood lipid profiles and glucose levels, insulin sensitivity were measured. Serum levels of inflammatory cytokines were analyzed. IRS-1 and Akt/PKB phosphorylation, PI3K and NF-κB protein levels in liver tissues were assessed; pathological changes of livers and pancreases were examined. Glucose uptake and AMPK/ACC2 phosphorylation were studied in cultured rat skeletal muscle cells in vitro.

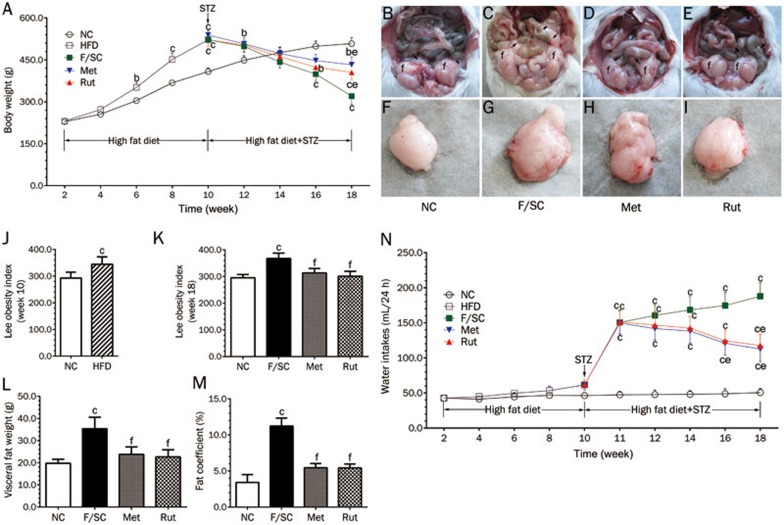
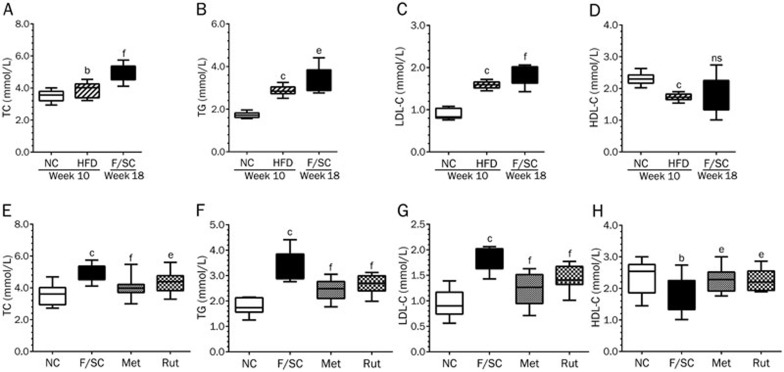
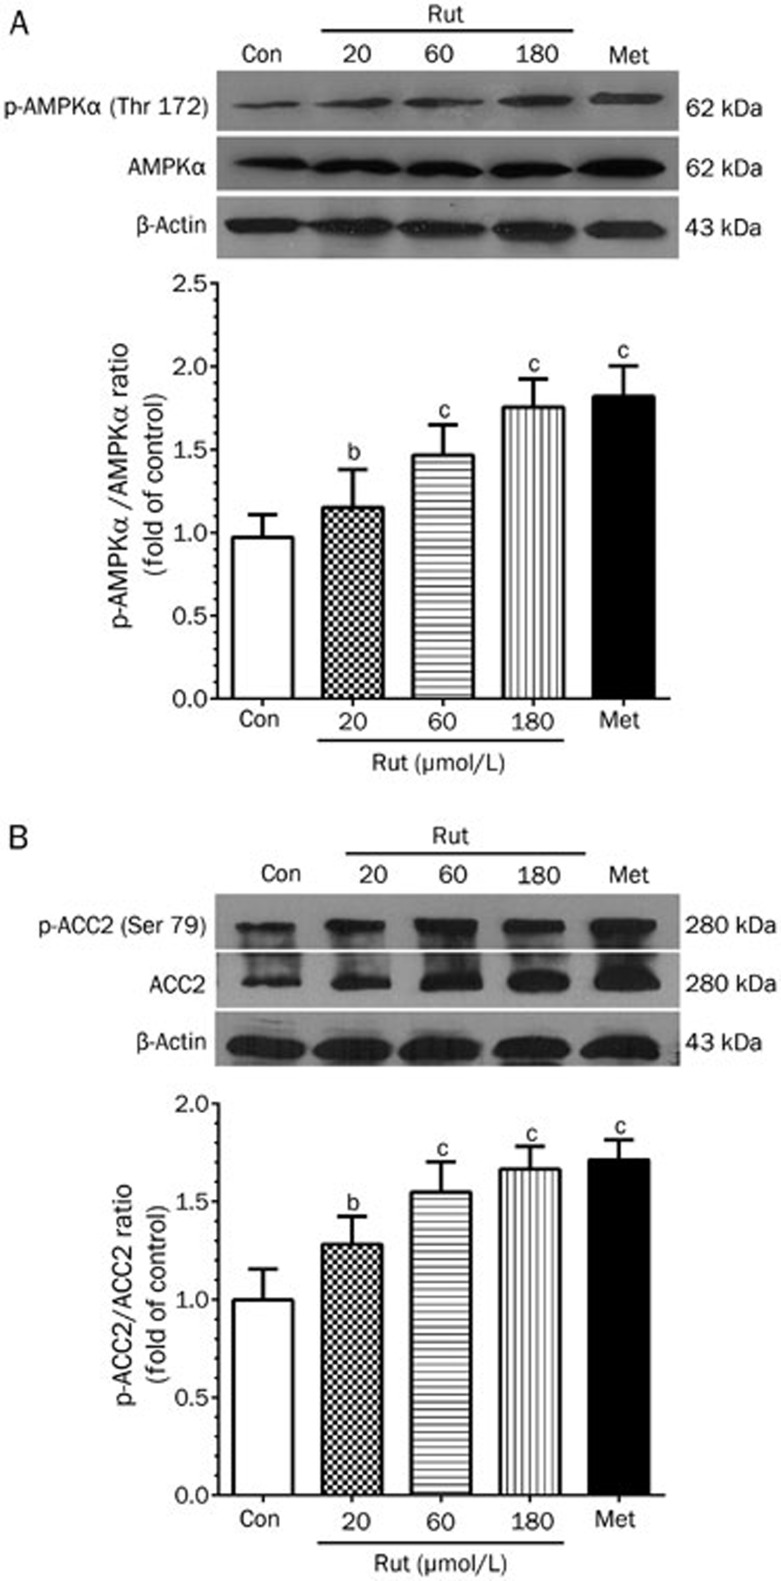
Results: Administration of rutaecarpine or metformin significantly decreased obesity, visceral fat accumulation, water consumption, and serum TC, TG and LDL-cholesterol levels in fat-fed, streptozotocin-treated rats. The two drugs also attenuated hyperglycemia and enhanced insulin sensitivity. Moreover, the two drugs significantly decreased NF-κB protein levels in liver tissues and plasma TNF-α, IL-6, CRP and MCP-1 levels, and ameliorated the pathological changes in livers and pancreases. In addition, the two drugs increased PI3K p85 subunit levels and Akt/PKB phosphorylation, but decreased IRS-1 phosphorylation in liver tissues. Treatment of cultured skeletal muscle cells with rutaecarpine (20-180 μmol/L) or metformin (20 μmol/L) promoted the phosphorylation of AMPK and ACC2, and increased glucose uptake.

Conclusion: Rutaecarpine ameliorates hyperlipidemia and hyperglycemia in fat-fed, streptozotocin-treated rats via regulating IRS-1/PI3K/Akt signaling pathway in liver and AMPK/ACC2 signaling pathway in skeletal muscles.


Figures

Figure 1
Figure 1
Animal and cell study protocols and chemical structures of rutaecarpine, metformin hydrochloride and streptozocin. (A) Animal study protocol and the effects of rutaecarpine on glycaemic and lipid profile of Fat-fed/STZ rats in vivo. (B) Chemical structure of rutaecarpine (C18H13N3O, molecular weight: 287.32). (C) Chemical structure of metformin hydrochloride (C4H11N5·HCl, molecular weight: 165.62). (D) Effects of rutaecarpine (20, 60, and 180 μmol/L) on glucose uptake and AMPKα, p-AMPKα, ACC2 and p-ACC2 in primary skeletal muscle cells in vitro.
Figure 2
Figure 2
Changes in body weight, Lee obesity index, visceral fat and water consumption in NC, F/SC, Met, Rut groups. (A) The body weight is increased with aging and facilitated by high fat diet (HFD). STZ single dose injection (week 10) decreased body weights which were reversed by rutaecarpine (Rut) and metformin (Met) at week 18 (F/SC: The rats treated with HFD plus low dose STZ as control group). (B) The head of the epididymis of a NC rat (arrow) with a slight mesenteric fat deposit (arrowhead) and epididymal fat (f). (C) The hidden epididymal head by the large amount of fat (arrow) and a high fatty deposit in the mesenterium (arrowhead) and epididymal fat (f) of a F/SC rat. (D and E) The hidden epididymal head by the middle amount of fat (arrow) and a high fatty deposit in the mesenterium (arrowhead) and epididymal fat (f) of Met and Rut rats. (F-I) Effect of rutaecarpine on visceral fat morphology of Fat-fed/STZ rats. (J) High fat diet (HFD) increases the Lee obesity index (measured at week 10). (K) The high-fat diet plus STZ treatment increase the Lee obesity index (measured at week 18) which is attenuated by rutaecarpine or metformin administration. (L) Visceral fat (epididymal, perirenal, and mesenteric; collected at week 18) and fat coefficient (M) were higher in F/SC group. Met and Rut markedly inhibited visceral fat weight. (N) The water consumption of individual rats were measured longitudinally before and after treatment. Values are mean±SD, n=10 in NC, n=50 in HFD, n=10 for F/SC, Met and Rut group respectively. bP<0.05, cP<0.01 vs NC; eP<0.05, fP<0.01 vs F/SC.
Figure 3
Figure 3
The high fat diet (HFD) (week 10) and HFD plus STZ injection (F/SC) (week 18) elevated TC, TG, LDL-C and attenuated HDL-C (A–D). Seven weeks treatment with rutaecarpine or metformin in Fat-fed/STZ rats markedly decreased TC, TG, LDL-C and increased HDL-C (E–H). Values are expressed as mean±SD, n=50 in HFD group, n=10 in NC, F/SC, Met and Rut groups. bP<0.05, cP<0.01 vs NC; eP<0.05, fP<0.01 vs F/SC. No significance (ns) means P>0.05.
Figure 4
Figure 4
Rutaecarpine effect on glycaemic profile. (A) The high fat diet (HFD; week 2 to 10) did not inference the blood glucose levels significantly in all groups. Blood glucose is significantly increased 72 h post STZ injection (week 10+72 h). Treatment of herb element and metformin (1 week post STZ injection) in F/SC rats gradually decreased glucose levels. Values are expressed as mean±SD, n=50 in HFD group, n=10 in NC, F/SC, Met and Rut groups. (B) Changes of glucose infusion rate (GIR) by rutaecarpine. The hyperinsulinemic euglycemic clamp study shows that herb element (7 Weeks treatment) increased GIR markedly. Values are mean±SD, n=10. bP<0.05, cP<0.01 vs NC; eP<0.05, fP<0.01 vs F/SC. (C) Glucose uptake in skeletal muscle without insulin treatment. Rutaecarpine (Rut1: 20 μmol/L; Rut2: 60 μmol/L and Rut3: 180 μmol/L; 24 h treatment) dose-dependently facilitated glucose uptake. Values are mean±SD, n=6. bP<0.05, cP<0.01 compared to the Con (−insulin); (D) Skeletal muscle glucose uptake under inference of insulin (10 U/L). As the rutaecarpine concentration increasing, the glucose uptake of insulin-stimulated skeletal muscle cells also increased. Values are mean±SD, n=6 in each group. eP<0.05, fP<0.01 compared to the Con (+Insulin) group.
Figure 5
Figure 5
The changes of protein phosphorylation levels of AMPK (Thr 172) (A) and ACC2 (B) by 24 h treatment of metformin (20 μmol/L) and rutaecarpine (20, 60 and 180 μmol/L) in skeletal muscle cells. The intensity of the phosphor-signals was detected with Western blot and presented as mean grey scale of corresponding bands in bar graph. Values are expressed as mean±SD, n=6 in each group. bP<0.05, cP<0.01 compared to the Con group.
Figure 6
Figure 6
The effects of rutaecarpine on IRS-1-PI3K-Akt insulin receptor mediated pathway were analyzed by Western blot with liver tissues. The 7 weeks treatment of rutaecarpine (25 mg/kg) or metformin (250 mg/kg) inhibited IRS-1 phosphorylation (A); promoted expression of PI3K p85 (B); and enhanced phosphorylation of Akt (C). The protein expressions were expressed as mean grey scale of corresponding bands in bar graph. Values are mean±SD, n=6 in each group. bP<0.05, cP<0.01 vs NC; eP<0.05, fP<0.01 vs F/SC.
Figure 7
Figure 7
Effect of rutaecarpine on serum inflammatory cytokines CRP (A), MCP-1 (B), TNF-α (C), IL-6 (D) and liver NF-κB protein (E) of Fat-fed/STZ rats. Panels show representative bands and histograms represent optical density values normalized to the corresponding β-actin. Values are mean±SD, n=6 or 10 in each group. bP<0.05, cP<0.01 vs NC; eP<0.05, fP<0.01 vs F/SC.
Figure 8
Figure 8
Pathological changes of liver, pancreas (H&E stain, magnification: ×400) and hepatic AST, ALT of Fat-fed/STZ rats. (A–D) The liver of F/SC group shows hepatocellular degeneration with dilated sinusoids, and infiltrated inflammatory cells. (E-H) Histopathology of pancreas of Fat-fed/STZ rats treated with rutaecarpine. Treatment of metformin (250 mg/kg) or rutaecarpine (25 mg/kg) prevented pathological changes and reversed pathological scores of liver (K). The elevated ALT (I), AST (J) and islet area of pancreas (L) in F/SC group were also significantly reduced by the treatments (scale bar=50 μm). Values are mean±SD, n=6 or 10 in each group. bP<0.05, cP<0.01 vs NC; eP<0.05, fP<0.01 vs F/SC.
Figure 9
Figure 9
Schematic action model of rutaecarpine which exert caloric restrict acting on cell metabolism at multiple levels and reduce energy-consuming processes in vivo and in vitro. Both AMPK-ACC2 and IRS-1-PI3K-Akt pathway participate regulatory pathway stimulated by rutaecarpine. The inhibitory effect on broad range of inflammatory cytokines may further suggest the multi-targets of rutaecarpine. The arrows indicate the potential targets of rutaecarpine. However, their role in the mechanism still need validation.

Similar articles

Cited by

References

    1. Fu J, Prasad HC. Changing epidemiology of metabolic syndrome and type 2 diabetes in Chinese youth. Curr Diab Rep 2014; 14: 447. - PubMed
    1. Beagley J, Guariguata L, Weil C, Motala AA. Global estimates of undiagnosed diabetes in adults. Diabetes Res Clin Pract 2014; 103: 150–60. - PubMed
    1. Kuivenhoven JA, Groen AK. Beyond the genetics of HDL: why is HDL cholesterol inversely related to cardiovascular disease? Handb Exp Pharmacol 2015; 224: 285–300. - PubMed
    1. Via-Sosa MA, Toro C, Trave P, March MA. Screening premorbid metabolic syndrome in community pharmacies: a cross-sectional descriptive study. BMC Public Health 2014; 14: 487. - PMC - PubMed
    1. Orme M, Fenici P, Lomon ID, Wygant G, Townsend R, Roudaut M. A systematic review and mixed-treatment comparison of dapagliflozin with existing anti-diabetes treatments for those with type 2 diabetes mellitus inadequately controlled by sulfonylurea monotherapy. Diabetol Metab Syndr 2014; 6: 73. - PMC - PubMed

Publication types

MeSH terms