. 2016 Feb 1;60(1):2557.
doi: 10.4081/ejh.2016.2557.

Molecules implicated in glucose homeostasis are differentially expressed in the trachea of lean and obese Zucker rats

Affiliations

Molecules implicated in glucose homeostasis are differentially expressed in the trachea of lean and obese Zucker rats

F Merigo et al. Eur J Histochem. .

Abstract

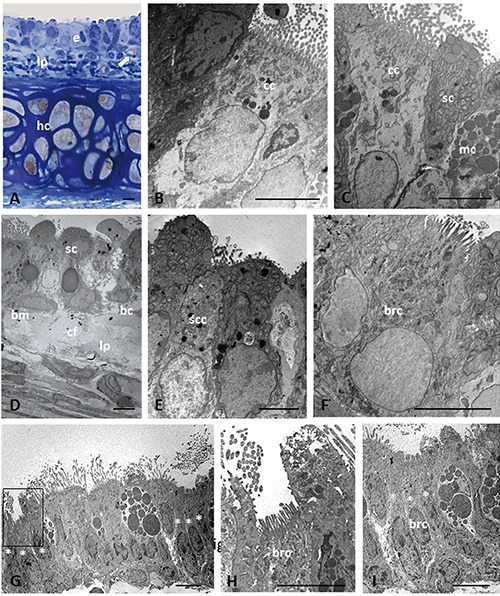
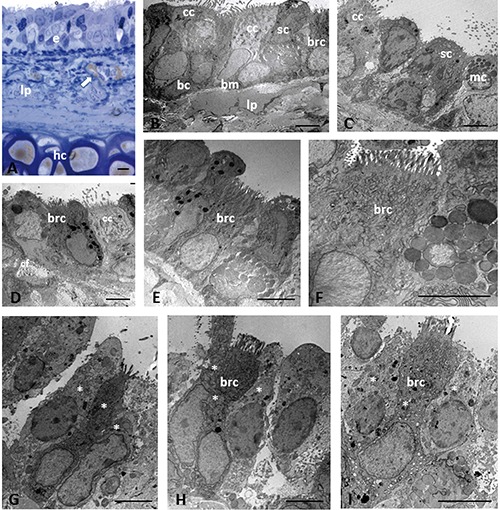
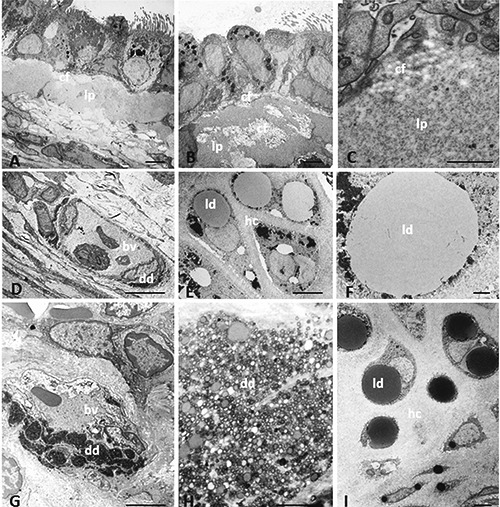
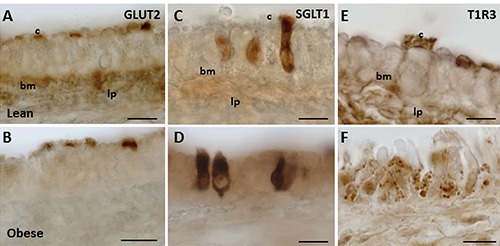
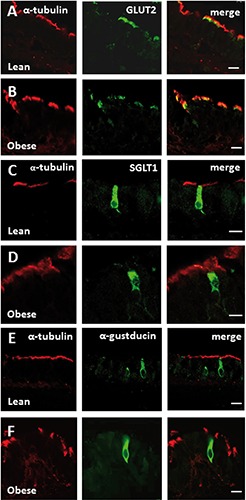
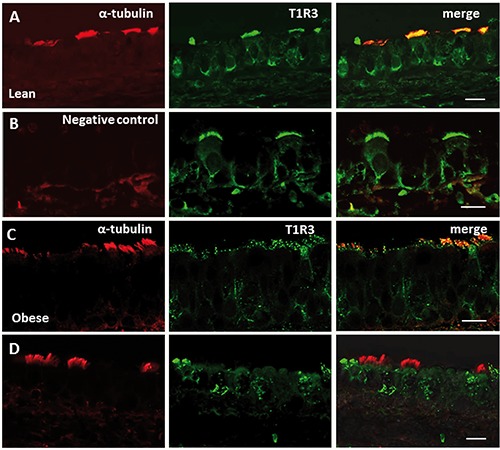
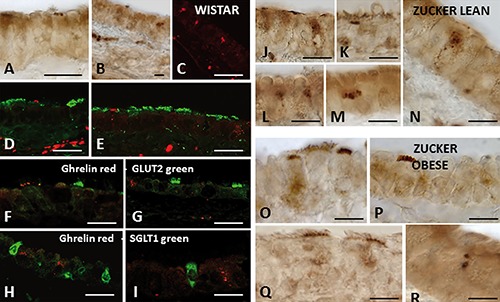
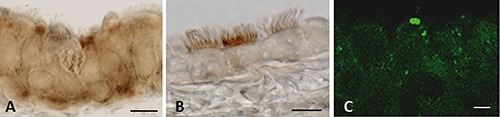
Recent studies indicate that the processes mediated by the (T1R2/T1R3) glucose/sugar receptor of gustatory cells in the tongue, and hormones like leptin and ghrelin contribute to the regulation of glucose homeostasis. Altered plasma levels of leptin and ghrelin are associated with obesity both in humans and rodents. In the present study, we evaluated the ultrastructure of the mucosa, and the expression of molecules implicated in the regulation of glucose homeostasis (GLUT2, SGLT1, T1R3, ghrelin and its receptor) in the trachea of an animal model of obesity (Zucker rats). We found that the tracheal epithelium of obese animals was characterized by the presence of poorly differentiated cells. Ciliated and secretory cells were the cell lineages with greatest loss of differentiation. Severe epithelial alterations were associated with marked deposit of extracellular matrix in the lamina propria. The expression pattern of GLUT2 and SGLT1 glucose transporters was similar in the trachea of both the Zucker rat genotypes, whereas that of T1R3 was reduced in ciliated cells of obese rats. A different immunolocalization for ghrelin was also found in the trachea of obese rats. In conclusion, the tracheal morphological alterations in obese animals seem to compromise the expression of molecules involved in the homeostasis of glucose.


Figures

Figure 1.
Figure 1.
Light (A) and electron microscopy (B-I) showing histological and ultrastructural examinations of epithelium in trachea of lean Zucker rats. Histological section stained with toluidine blue (A). Arrow in (A) indicates lipid droplet. Asterisk indicates the cells that compose a cluster of solitary chemosensory cells. The boxed area on the left in panel G is shown at higher magnification in (H); the cells marked with asterisks on the right in (G) are shown at higher magnification in panel I. bc, basal cell; bm, basement membrane; brc, brush cell; cc, ciliated cell; cf, collagen fibers; hc, hyaline cartilage; e, epithelium; lp, lamina propria; mc, mucous cell; sc, secretory cell; scc, solitary chemosensory cell. Scale bars: 5 µm.
Figure 2.
Figure 2.
Light (A) and electron microscopy (B-I) showing histological and ultrastructural examinations of epithelium in trachea of obese Zucker rats. Histological section stained with toluidine blue (A). Arrow in (A) indicates lipid droplet. Asterisk indicates the cells that compose a cluster of solitary chemosensory cells. bc, basal cell; bm, basement membrane; brc, brush cell; cc, ciliated cell; hc, hyaline cartilage; e, epithelium; lp, lamina propria; mc, mucous cell; sc, secretory cell. Scale bars: 5 µm.
Figure 3.
Figure 3.
Transmission electron microscopy showing ultrastructural characteristics of trachea in lean and obese Zucker rats. Amorphous material is present in lamina propria of obese Zucker rats (A-C). Dense deposits are present in microvascular structure in lean (D) and obese (G) Zucker rats. The dense deposit in (G) is shown at higher magnification in (H). Lipid droplets are visible in hyaline cartilage of lean (E, F) and obese (I) Zucker rats. bv, blood vessel; cf, collagen fibers; dd, dense deposit; hc, hyaline cartilage; ld, lipid droplet; lp, lamina propria. Scale bars: A,B,D,E,G,I) 5 µm; C,F,H) 1 µm.
Figure 4.
Figure 4.
GLUT2, SGLT1, and T1R3 expression in trachea of Wistar and Zucker rats. The immunoperoxidase staining is shown in the epithelium of lean (A,C,E), and obese Zucker (B,D,F) rats. bm, basement membrane; c, cilia; lp, lamina propria. Scale bars: 10 µm.
Figure 5.
Figure 5.
Double-confocal microscopy for α-tubulin with GLUT2, SGLT1, α-gustducin in trachea of Zucker rats. The immunofluorescence staining shows expression of α-tubulin (red) with GLUT2 (green; lines A, B), or SGLT1 (green; lines C, D), or α-gustducin (green; lines E, F) in the epithelium of lean (lines A, C, E) and obese (lines B, D, F) Zucker rats. Immunostaining for GLUT2 is expressed by α-tubulin immunoreactive cells. SGLT1 and α-gustducin immunoreactivities are observed in α-tubulin-negative cells identified as solitary chemosensory cells. Scale bars: 10 µm.
Figure 6.
Figure 6.
Double-confocal microscopy for α-tubulin with T1R3 in trachea of Zucker rats. The immunofluorescence staining shows expression of α-tubulin (red) with T1R3 (green) in the epithelium of lean (lines A, B) and obese (lines C, D) Zucker rats. In lean rats, α-tubulin and T1R3 are colocalized in some spots on the cilia of tracheal cells (line A). T1R3 labeling is also observed in the apical cytoplasm beneath the cilia, and on the basolateral membrane of ciliated cells. Double-labeling is not observed when anti-α-tubulin antibody was omitted (line B). A reduced colabelling pattern of α-tubulin and T1R3 is observed in obese compared with lean rats, (line C). α-tubulin-positive cells lacking T1R3 expression, and only T1R3-positive cells are also observed (line D). Scale bars: 10 µm.
Figure 7.
Figure 7.
Ghrelin expression in trachea of Wistar and Zucker rats. Immunoperoxidase (A, B, J-R) and immunofluorescent (C-I) staining shows ghrelin immunoreactivity in the epithelium of Wistar (A-I), lean (J-N), and obese (O-R) Zucker rats. Double-immunofluorescent confocal microscopy shows ghrelin immunoreactivity (red) in cells negative for α-tubulin (green; D, E), or GLUT2 (green; F, G), or SGLT1 (green; H, I). Scale bars: A-I) 20 µm; J-R) 15 µm.
Figure 8.
Figure 8.
Ghrelin receptor (GRLN-R) expression in trachea of Wistar and Zucker rats. Immunoperoxidase (A, B) and immunofluorescent (C) staining shows GRLN-R immunoreactivity in the epithelium of Wistar (A), lean (B), and obese (C) Zucker rats. Scale bars: 9 µm.

References

    1. Mace OJ, Affleck J, Patel N, Kellett GL. Sweet taste receptors in rat small intestine stimulate glucose absorption through apical GLUT2. J Physiol 2007;582:379-92. - PMC - PubMed
    1. Margolskee RF, Dyer J, Kokrashvili Z, Salmon KS, Ilegems E, Daly K, et al. T1R3 and gustducin in gut sense sugars to regulate expression of Na+-glucose cotransporter 1. Proc Natl Acad Sci 2007;104: 15075-80. - PMC - PubMed
    1. Lindemann B. Receptors and transduction in taste. Nature 2001;413:219-25. - PubMed
    1. Margolskee R F. Molecular mechanisms of bitter and sweet taste transduction. J Biol Chem 2002;277:1-4. - PubMed
    1. Sbarbati A, Osculati F. The taste cell-related diffuse chemosensory system. Prog Neurobiol 2005;75:295-07. - PubMed