. 2016 Mar 14:7:10791.
doi: 10.1038/ncomms10791.

IL-1 receptor antagonist ameliorates inflammasome-dependent inflammation in murine and human cystic fibrosis

Affiliations

IL-1 receptor antagonist ameliorates inflammasome-dependent inflammation in murine and human cystic fibrosis

Rossana G Iannitti et al. Nat Commun. .

Abstract

Dysregulated inflammasome activation contributes to respiratory infections and pathologic airway inflammation. Through basic and translational approaches involving murine models and human genetic epidemiology, we show here the importance of the different inflammasomes in regulating inflammatory responses in mice and humans with cystic fibrosis (CF), a life-threatening disorder of the lungs and digestive system. While both contributing to pathogen clearance, NLRP3 more than NLRC4 contributes to deleterious inflammatory responses in CF and correlates with defective NLRC4-dependent IL-1Ra production. Disease susceptibility in mice and microbial colonization in humans occurs in conditions of genetic deficiency of NLRC4 or IL-1Ra and can be rescued by administration of the recombinant IL-1Ra, anakinra. These results indicate that pathogenic NLRP3 activity in CF could be negatively regulated by IL-1Ra and provide a proof-of-concept evidence that inflammasomes are potential targets to limit the pathological consequences of microbial colonization in CF.


Figures
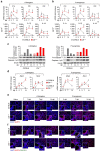
Figure 1
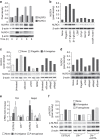
Figure 1. Dysregulated inflammasome activity in murine CF.
C57BL/6 and Cftr−/−mice (n=6 for all groups) were infected intranasally with live A. fumigatus conidia or P. aeruginosa and assessed for IL-1β, IL-18 and IL-1α gene expression and cytokine production in lung homogenates of A. fumigatus- (a) or P. aeruginosa- (b) infected mice at different days post-infection (dpi) by RT–PCR and specific ELISA; (c) Caspase-1 cleavage by immunoblotting with specific antibodies and corresponding pixel density ratio normalized against corresponding β-actin; Nlrp3 and Nlrc4 gene expression (d) by RT–PCR in lung tissues and protein expression (e,f) by lung immunofluorescence staining with anti-NLRP3 antibody followed by anti-rabbit TRICT (e) and (f) anti-NLRC4 antibody and anti-phospho(p)NLRC4 followed by anti-rabbit TRICT and anti-hamster FITC. Cell nuclei were stained blue with DAPI. Representative images were acquired with a high-resolution Microscopy Olympus DP71 with a × 20 objective. Scale bars, 200 μm, inset 50 μm. Note the expression on lung epithelium cells in the inset. Scanning densitometry was done with Image Lab 3.1.1 software. Data are representative (immunoblotting) or pooled from three experiments and presented as mean±s.d. for all bar graphs. *P<0.05, **P<0.01, ***P<0.001, ****P<0.0001, C57BL/6 versus Cftr−/−mice at different dpi, Two-way ANOVA, Bonferroni post hoc test. For NLRP3 or NLRC4 quantification, see Supplementary Fig. 1.
Figure 2
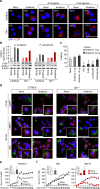
Figure 2. Different NLRP3 and NLRC4 expression in lung cells from CF mice.
C57BL/6 and Cftr−/−mice (n=6 for all groups) were infected intranasally with live A. fumigatus conidia or P. aeruginosa and assessed for (a) NLRP3 and (b) NLRC4 protein expression in the lungs and lung epithelial and myeloid cells (magnified in the insets) by immunohistochemistry. Cell nuclei were counterstained with haematoxylin. Representative images of two independent experiments were acquired with a × 20 and × 60 (inset, using EVOS FL Color Imaging System) objective. Scale bar, 200 μm. Immunofluorescence staining with (c) NLRP3 followed by anti-rabbit TRICT or (d) pNLRC4 and NLRC4 of epithelia cells and macrophages purified from lungs and neutrophils from the peritoneal cavity of C57BL/6 and Cftr−/− uninfected mice exposed in vitro to LPS+ATP, flagellin, A. fumigatus live conidia or P. aeruginosa. Cell nuclei were counterstained blue with DAPI. Images were acquired a high-resolution Microscopy Olympus DP71 using a × 100 objective. Scale bar, 12.5 μm. For number of cells with positive NLRP3 or NLRC4 expression quantification, see Supplementary Fig. 1.
Figure 3
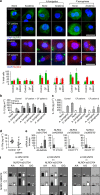
Figure 3. The TLR5/NAIP5 pathway of NLRC4 activation is defective in murine CF.
RAW 247.3 macrophages were exposed to (a) A. fumigatus live conidia before the assessment for NLRP3 or NLRC4 protein expression at different times by immunoblotting with specific antibodies or to (b) various fungal antigens for 2 h at 37 °C before NLRC4 protein expression by western blotting. (c) Cells were pretreated with specific siRNA for Tlr5, Naip2, Naip5 or scrambled siRNA (siScram) or the NF-κB inhibitor SN50 (100 μM), exposed to Aspergillus conidia or flagellin for 2 h at 37 °C and assessed for NLRC4 protein expression by western blotting. All immunoblots were normalized against the corresponding β-actin. (d) C57BL/6 mice were given siRNA intranasally twice, 2 days before and 3 days after the infection before the assessment of NLRC4 protein expression at 4 dpi. (e) Tlr5, Naip2 and Naip5 expression by RT–PCR in lungs of C57BL/6 and Cftr−/− mice infected with A. fumigatus or P. aeruginosa (n=6 for all groups) 3 days before. (f) NLRC4 and phospho(p)NLRC4 expression in purified lung marcrophages from C57BL/6 and Cftr−/− mice stimulated with live A. fumigatus conida or P. aeruginosa at the ratio cells:microbes (1:1) in the presence of EDTA at 37 °C. The expression of pNLRC4 was normalized against the corresponding β-actin. Data pooled from three experiments and presented as mean±s.d. for all bar graphs. *P<0.05, ***P<0.001, ****P<0.0001, None versus infected mice, Two-way ANOVA, Bonferroni post hoc test.
Figure 4
Figure 4. NLRP3 and NLRC4 are non-redundantly activated in lung infections.
C57BL/6, Nlrp3−/− and Nlrc4−/− mice (n=6 for all groups) were infected intranasally with live A. fumigatus conidia or P. aeruginosa and assessed for (a) fungal or bacterial growth at different dpi; (b) IL-1β production in BAL fluids (c) and lung histology at 7 dpi (periodic acid-Schiff staining) (% of neutrophils in the bronchoalveolar lavage are shown in the insets). (d) Survival, (e) fungal growth and (f) lung histology of C57BL/6 and Cftr−/−mice infected with A. fumigatus conidia and treated with specific Nlrp3, Nlrc4 siRNA or scrambled siRNA. Fungal growth (log CFU, mean±s.d.) and histology were assessed at 7 dpi In f, periodic acid-Schiff staining and increased deposition of DNA on lung parenchyma cells on TUNEL staining. Cell nuclei were stained blue with DAPI. Representative images of two independent experiments were acquired using EVOS FL Color Imaging System with a × 40 objective for histology (Scale bar, 100 μm) and a high-resolution Microscopy Olympus DP71 using a × 20 objective for TUNEL (Scale bar, 50 μm). Data pooled from three experiments and presented as mean±s.d. for all bar graphs. *P<0.05, **P<0.01, ***P<0.001, ****P<0.0001, C57BL/6 versus Nlrp3−/−, Nlrc4−/−or Cftr−/−mice at different dpi (a,b) or untreated (none) versus siRNA treated mice (e), Two-way (a,b) and One-way ANOVA (e) Bonferroni post hoc test.
Figure 5
Figure 5. NLRC4 produces IL-1Ra.
C57BL/6, Nlrp3−/−, Nlrc4−/− and Cftr−/− mice (n=6 for all groups) were infected intranasally with live A. fumigatus conidia or P. aeruginosa. NLRP3 gene (a) and protein (b) expression by RT–PCR or immunofluorescence staining (anti-NLRP3 antibody followed by anti-goat TRICT secondary antibody) of lungs at 7 dpi. Cell nuclei were stained blue with DAPI. Representative images of two independent experiments were acquired with a high-resolution Microscopy Olympus DP71 using a × 20 objective. Scale bar, 200 μm, inset 50 μm. IL-1Ra production (quantified by specific ELISA) in (c) supernatants of purified lung epithelial cells exposed to the different stimuli, with and without 2 mM of EDTA for 6 h at 37 °C and (d) lung homogenates at different dpi. Data are representative (immunofluorescence) or pooled from three experiments and presented as mean±s.d. for all bar graphs. *P<0.05, **P<0.01, ***P<0.001, ****P<0.0001, C57BL/6 versus Nlrp3−/−, Nlrc4−/− and Cftr−/− mice at different dpi. Two-way ANOVA Bonferroni post hoc test. For NLRP3 quantification, see Supplementary Fig. 1.
Figure 6
Figure 6. Anakinra protects Cftr−/−mice from infections and NLRP3 inflammation.
C57BL/6 and Cftr−/− mice (n=6 for all groups) were infected intranasally with live A. fumigatus conidia or P. aeruginosa and treated with anakinra (100 mg kg−1 per day) throughout the infection. (a,g) Survival, (b,h) microbial growth (log CFU, mean±s.d.), (c,i) lung histology (periodic acid-Schiff staining) and reduced deposition of DNA on lung parenchyma cells by TUNEL; (d) caspase-1 cleavage by immunoblotting with specific antibodies (scanning densitometry was done with Image Lab 3.1.1 software. Representative of three independent experiments and corresponding pixel density ratio normalized against actin); (e,j) IL-1β levels in lung homogenates; NLRP3 protein expression by immunofluorescence staining (f) and immunoblotting (k) of lungs of anakinra-treated mice. Assays were done at 7 dpi. (l) Fungal growth (log CFU, mean±s.d.) and (m) lung histology (periodic acid-Schiff staining and NLRP3 immunofluorescence staining in the inset) of A. fumigatus-infected and anakinra-treated Il1ra−/− mice. Representative images of two independent experiments were acquired using EVOS FL Color Imaging System with a × 40 objective for histology (Scale bar, 100 μm) and a high-resolution Microscopy Olympus DP71 using a × 20 objective for TUNEL and immunofluorescent staining (Scale bar, 200 μm, inset 50 μm). Data pooled from three experiments and presented as mean±s.d. for all bar graphs. *P<0.05, **P<0.01, ***P<0.001, anakinra treated versus untreated mice (none), One-way ANOVA (b,h), Two-way ANOVA (e,j) Bonferroni post hoc test and two-sides Student's t-test. (l) For NLRP3 quantification, see Supplementary Fig. 1.
Figure 7
Figure 7. Anakinra promotes the autophagy and proteasomal degradation pathway.
(a) Autophagy on purified lung macrophages from C57BL/6 or Cftr−/−mice stimulated with Aspergillus conidia or P. aeruginosa in the presence of 10 μg ml−1 anakinra and incubated with anti-LC3 antibody followed by PE secondary antibody. Representative images (original magnification, × 40) are shown. DAPI was used to detect nuclei. Numbers refer to % positive cells. Scale bar, 12.5 μm. (b) Density of bands from western blots of LC3b-I and II in homogenates of lungs of naive, Aspergillus- or Pseudomonas-infected untreated (none), or infected and anakinra-treated mice at 7 dpi. (c) Conidiocidal activity of RAW264.7 cells pretreated with DPI, 3-MA, lactacystin or chloroquine before the exposure to live A. fumigatus resting conidia for 2 h in the presence of anakinra. Conidiocidal activity refers to inhibition of CFUs (expressed as mean percentage±s.d. for all bar graphs, data pooled from three experiments). Each treatment had no effects on fungal growth in the absence of effector cells. *P<0.05, ****P<0.0001, pretreated versus anakinra 10 μg ml−1 only, one-way ANOVA, Bonferroni post hoc test. (d) Immunofluorescence imaging of purified alveolar macrophages from lungs of C57BL/6 or Cftr−/−mice after in vitro exposure to GFP-conidia at 37 °C for 2 h and chasing for 15 and 45 min. Formaldehyde-fixed cells were incubated with primary antibodies against Lamp1 or 20S followed by secondary anti-rabbit IgG–TRITC antibody. Nuclei were counterstained with DAPI. Images were acquired using EVOS FL Color Imaging System with × 40 objective. Shown are merged images of cells (a single cell is magnified in the inset) pulsed with GFP-conidia and red-stained for each compartment. Shown are representative data from three independent experiments.(e,f) RAW 247.3 (e) and HBE (f) cells from control or CF patients were stimulated with Aspergillus conidia in the presence of anakinra for 4 h and the amount of pmols of proteolytic activity was analysed with the proteasome activity assay kit (Abcam) Shown in the insets the relative slope with error bars representing the mean±s.d. *P<0.05, ***P<0.001, None versus anakinra, Student's t-test.
Figure 8
Figure 8. Anakinra inhibits inflammasome activation in human CF.
(a) NLRP3 or NLRC4 staining of human bronchial epithelial (HBE) cells homozygous for ΔF508 mutation and control cells exposed to P. aeruginosa or A. fumigatus conidia at cells:microbes ratio of 2:1, and/or 10 μg ml−1 of anakinra. Images were acquired using the Olympus BX51 fluorescence microscope with a × 40 objective. Scale bar, 12.5 μm. DAPI was used to detect nuclei. Representative images of two independent experiments from three patients. Histograms indicate per cent of human bronchial epithelial cells with positive NLRP3 or NLRC4 expression. (b) IL-1β or (c) IL-1Ra in the supernatants of HBE cells from control or two CF patients exposed as above and (d) IL-1Ra levels in expectorates from control or CF patients (ELISA). (e) NLRC4 expression by RT–PCR of CF patients carrying diverse genotypes at rs212704, rs455060, rs7562653 and rs385076. (f) Best three-factor model. Dark grey and light grey boxes correspond to the high- and low-risk genotype combinations, respectively. The left and right bars within each box correspond to Pseudomonas+ and Pseudomonas, respectively. The top number above each bar is the sum of scores for the corresponding group of individuals. The heights of the bars are proportional to the sum of scores in each group. Data pooled from two experiments and presented as mean±s.d. for all bar graphs. *P<0.05, **P<0.01, ***P<0.001, treated versus untreated (none) (a,b) or control versus CF patient (c,d), Two-way ANOVA (ac) Bonferroni post hoc test and two-sides Student's t-test (d).

References

    1. Cohen T. S. & Prince A. Cystic fibrosis: a mucosal immunodeficiency syndrome. Nat. Med. 18, 509–519 (2012). - PMC - PubMed
    1. Corvol H. et al. Distinct cytokine production by lung and blood neutrophils from children with cystic fibrosis. Am. J. Physiol. Lung. Cell Mol. Physiol. 284, L997–L1003 (2003). - PubMed
    1. Iannitti R. G. et al. Th17/Treg imbalance in murine cystic fibrosis is linked to indoleamine 2,3-dioxygenase deficiency but corrected by kynurenines. Am. J. Respir. Crit. Care Med. 187, 609–620 (2013). - PubMed
    1. Robinson K. M. & Alcorn J. F. T-cell immunotherapy in cystic fibrosis: weighing the risk/reward. Am. J. Respir. Crit. Care Med. 187, 564–566 (2013). - PubMed
    1. dos Santos G., Kutuzov M. A. & Ridge K. M. The inflammasome in lung diseases. Am. J. Physiol. Lung. Cell Mol. Physiol. 303, L627–L633 (2012). - PMC - PubMed

Publication types

MeSH terms