. 2016 Mar 14:7:10871.
doi: 10.1038/ncomms10871.

Stabilin-2 modulates the efficiency of myoblast fusion during myogenic differentiation and muscle regeneration

Affiliations

Stabilin-2 modulates the efficiency of myoblast fusion during myogenic differentiation and muscle regeneration

Seung-Yoon Park et al. Nat Commun. .

Abstract

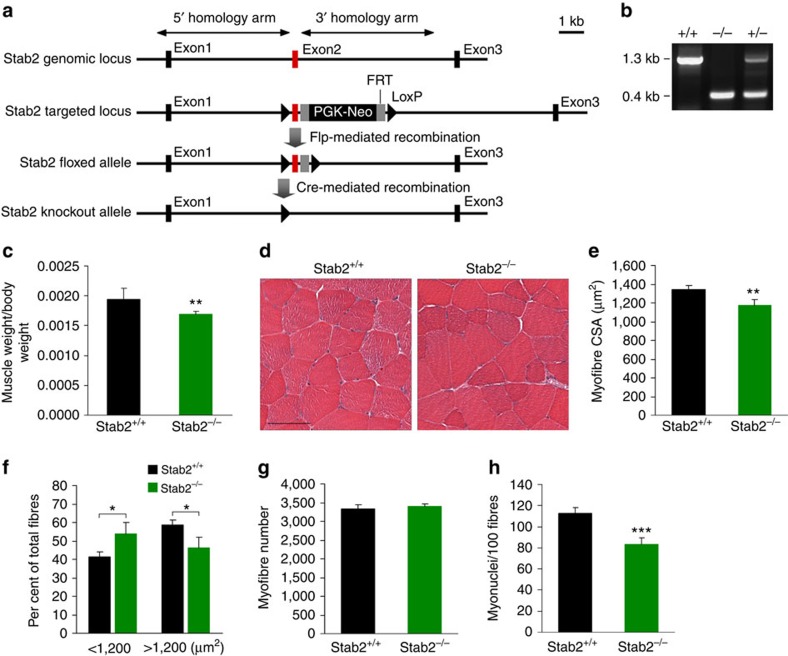
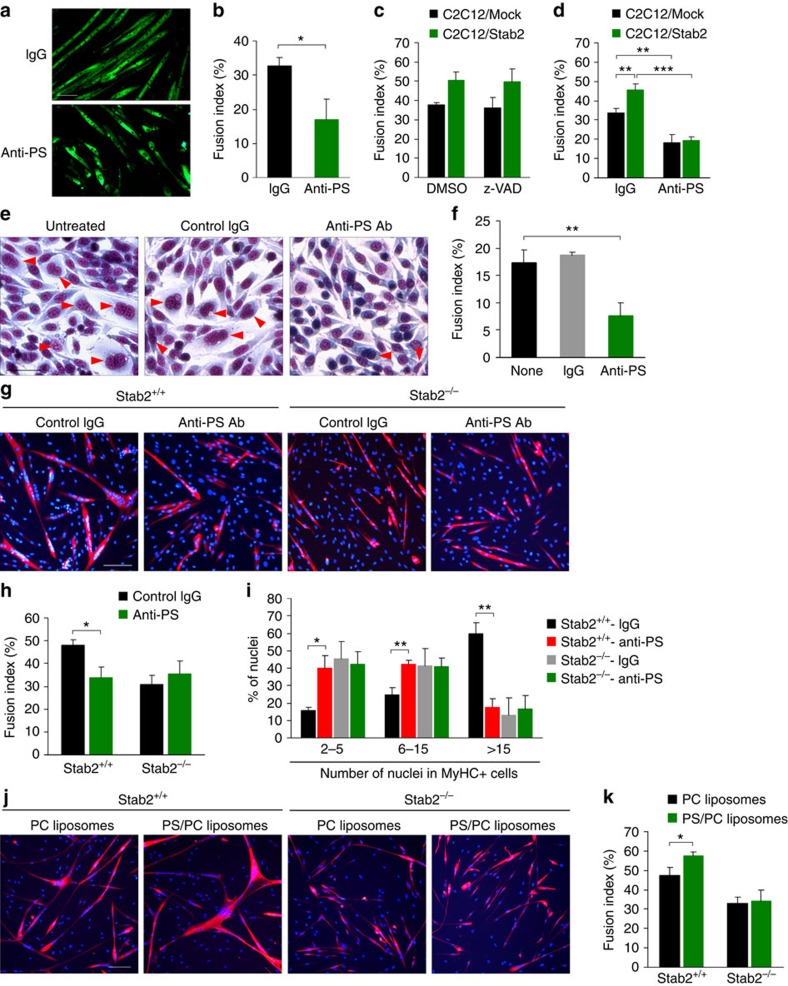
Myoblast fusion is essential for the formation of skeletal muscle myofibres. Studies have shown that phosphatidylserine is necessary for myoblast fusion, but the underlying mechanism is not known. Here we show that the phosphatidylserine receptor stabilin-2 acts as a membrane protein for myoblast fusion during myogenic differentiation and muscle regeneration. Stabilin-2 expression is induced during myogenic differentiation, and is regulated by calcineurin/NFAT signalling in myoblasts. Forced expression of stabilin-2 in myoblasts is associated with increased myotube formation, whereas deficiency of stabilin-2 results in the formation of small, thin myotubes. Stab2-deficient mice have myofibres with small cross-sectional area and few myonuclei and impaired muscle regeneration after injury. Importantly, myoblasts lacking stabilin-2 have reduced phosphatidylserine-dependent fusion. Collectively, our results show that stabilin-2 contributes to phosphatidylserine-dependent myoblast fusion and provide new insights into the molecular mechanism by which phosphatidylserine mediates myoblast fusion during muscle growth and regeneration.


Figures

Figure 1
Figure 1. Stabilin-2 expression in muscle tissues and during myogenic differentiation.
(a) The expressions of PS-recognizing receptors (Tim1, Tim4, Bai1, stabilin-1 and stabilin-2) were examined in mouse skeletal muscles by quantitative real-time PCR. Data are presented as mean±s.d. of at least three independent experiments. (b,c) Expression levels of PS-recognizing receptors were examined in C2C12 cells (b) and primary myoblasts (c) during myogenic differentiation by quantitative real-time PCR. Data are presented as mean±s.d. of at least three independent experiments. GM, growth medium; DM, differentiation medium. (d,e) Expression levels of stabilin-2 protein were determined in C2C12 cells (d) and primary myoblasts (e) during myogenic differentiation by Western blotting. Representative results from three independent experiments are shown. MyHC, myosin heavy chain. Full-size blots are shown in Supplementary Fig. 15. (f,g) C2C12 cells (f) and primary myoblasts (g) were induced to differentiate in differentiation medium (DM), and the expressions of stabilin-2 and myosin heavy chain (MyHC) were analysed at the indicated times by immunostaining. Scale bar, 50 μm.
Figure 2
Figure 2. Stabilin-2 expression is regulated by calcineurin/NFAT signalling.
(a) Luciferase assay in primary myoblasts transfected with the stabilin-2 promoter construct. At 24 h post-transfection, cells were incubated with vehicle, calcium ionophore A23187 (CI, 1 μM), or CI plus cyclosporine A (CsA, 1 μM) for 24 h. (b) Luciferase assay in primary myoblasts transfected with the stabilin-2 promoter construct along with plasmid encoding activated calcineurin (aCnA) and/or GFP-VIVIT. (c) Luciferase assay in primary myoblasts transfected with stabilin-2 promoter construct along with the indicated NFAT expression vector. (d) Luciferase assay in primary myoblasts transfected with the stabilin-2 promoter construct along with the indicated amount of plasmid encoding NFATc1. (e) Real-time PCR analysis of Stab2 mRNA in primary myoblasts infected with retrovirus encoding NFATc1 or retrovirus from pMXs IRES-puro vector. (f) Luciferase assay in primary myoblasts transfected the stabilin-2 promoter construct or a series of 5' deletion constructs along wth plasmid encoding NFATc1 or empty vector (Con). (g) Luciferase assay in primary myoblasts transfected with the stabilin-2 promoter construct (nt −482 to +205) or its NFAT mutant along with plasmid encoding NFATc1. (h) Soluble chromatin was prepared from human myoblasts (DM1) for ChIP assays and immunoprecipitated with anti-NFATc1 antibody. An isotype-matched control antibody was used as the negative control. Immunoprecipitates were subjected to PCR with primers specific to the NFAT-responsive element in stabilin-2 promoter. GAPDH primers were used as a negative control. The result shown is a representative of three independent experiments. (i) Representative immunoblot of NFATc1 in primary myoblasts infected with retrovirus encoding NFATc1 shRNA or retrovirus from pMXs-U6 vector. (jl) Primary myoblasts infected with retrovirus encoding NFATc1 shRNA (shNFATc1) or retrovirus from pMXs-U6 vector (Control) were induced to differentiate for 2 days. Expression of stabilin-2 mRNA was analysed by quantitative real-time PCR (j). Representative images in DM2 (k) are shown. Scale bars, 100 μm. Fusion indices (l) were calculated. Relative luciferase activities were normalized as fold over that of the stabilin-2 promoter in the absence of NFATc1. Data are presented as mean±s.d. of three independent experiments. Asterisks indicate statistical significance (*P<0.05, Student's t-test).
Figure 3
Figure 3. The overexpression of Stabilin-2 enhances myotube formation in myoblasts.
(a) C2C12/Stab2 and C2C12/Mock cells were induced to differentiate for the indicated times. Cells were then fixed and immunostained with anti-MyHC antibody. Representative microscopic fields are shown. Scale bar, 100 μm. Red boxes are shown at higher magnification. (b) C2C12/Stab2 and C2C12/Mock cells were induced to differentiate for the indicated times, and fusion indices were calculated. Data are presented as mean±s.d. of three independent experiments. (c) After 5 days of differentiation (DM5), the percentage of nuclei present in MyHC-positive myotubes with the indicated number of nuclei were quantified in C2C12/Stab2 and C2C12/Mock cells. Data are presented as mean±s.d. of three independent experiments. (d,e) C2C12/Stab2 and C2C12/Mock cells were induced to differentiate for the indicated times. The levels of embryonic MyHC (Myf3, d) and myogenin (MyoG, e) mRNA were analysed by quantitative real-time PCR. Data are presented as mean±s.d. of three independent experiments. (f) The levels of MyHC and myogenin proteins were analysed in C2C12/Stab2 and C2C12/Mock cells during differentiation by immunoblotting. Full-size blots are shown in Supplementary Fig. 15. (g,h) L cells stably transfected with stabilin-2 expression vector (L/Stab2) or empty vector (L/Mock) were incubated in growth medium (GM) or fusion medium (FM). Representative images (g) are shown. Scale bars, 100 μm. Fusion indices of stabilin-2-expressing cells at the indicated time points are shown in graph (h). Data are presented as mean±s.d. of at least three independent experiments. (i) Differential interference contrast (DIC) images from Supplementary Movie 1 showed cell–cell fusion in stabilin-2-expressing cells. Asterisks indicate statistical significance (*P<0.05, **P<0.01, ***P<0.001, Student's t-test).
Figure 4
Figure 4. Myofibre CSAs and myonuclear numbers are decreased in Stab2−/− muscles.
(a) Targeting of the Stabilin-2 gene. The two loxP sites flanking the exon 2 (red) of the Stab2 gene are represented as triangles. Cre-mediated deletion of Stabilin-2 exon 2 (red) was achieved by crossing heterozygous Stab2+/flox mice with C57BL/6 Cre-deleter expressing constitutively recombinase Cre. (b) PCR analysis of genomic DNA clearly discriminated the Stab2+/+, Stab2+/− and Stab2−/− genotypes. (c) Tibialis anterior (TA) muscles were isolated from 9-week-old male Stab2+/+ and Stab2−/− mice, and muscle weight relative to body weight was analysed. Data are presented as mean±s.d. (n=8) of each genotype. (d) Representative sections of Stab2+/+ and Stab2−/− TA muscles stained with H&E. Scale bar, 50 μm. (e) Cross-sectional areas (CSAs) of myofibres from Stab2+/+ and Stab2−/− TA muscles. Data are presented as mean±s.d. (n=4) of each genotype. (f) The distribution of small and large myofibres from TA muscles of 9-week-old male Stab2+/+ and Stab2−/− mice. Data are presented as mean±s.d. (n=4) of each genotype. (g) Myofibre numbers were analysed in TA muscles from 9-week-old male Stab2+/+ and Stab2−/− mice. Data are presented as mean±s.d. (n=4) of each genotype. (h) DAPI-stained nuclei within dystrophin-positive sarcolemma were analysed in TA muscles from Stab2+/+ and Stab2−/− mice, and numbers of myonuclei per 100 fibres were calculated. Data are presented as mean±s.d. (n=5) of each genotype. Asterisks indicate statistical significance (*P<0.05, **P<0.01, ***P<0.001, Student's t-test).
Figure 5
Figure 5. Myoblast fusion is impaired in Stab2-deficient myoblasts.
(a) Myoblasts isolated from Stab2+/+ and Stab2−/− mice were plated at equal densities and induced to differentiate. After 48 h, cells were fixed and immunostained with anti-MyHC antibody. Representative microscopic fields are presented. Yellow boxes are shown at higher magnification. Scale bar, 100 μm. (b) After 2 days of differentiation (DM2), fusion indices were determined for Stab2+/+ and Stab2−/− myoblasts. Data are presented as mean±s.d. of at least three independent experiments. (c) Stab2+/+ and Stab2−/− myoblasts were fixed and immunostained for anti-MyHC antibody at DM2, and then the percentage of nuclei present in MyHC-positive cells with the indicated number of nuclei were calculated. Data are presented as mean±s.d. of at least three independent experiments. (d,e) Stab2+/+ and Stab2−/− myoblasts were induced to differentiate for the indicated times. The levels of embryonic MyHC (Myf3, d) and myogenin (MyoG, e) mRNA were analysed by quantitative real-time PCR. Data are presented as mean±s.d. of three independent experiments. Asterisks indicate statistical significance (*P<0.05, **P<0.01, ***P<0.001, Student's t-test).
Figure 6
Figure 6. Muscle regeneration is impaired in Stab2−/− mice.
(a) H&E staining of cross sections of Stab2+/+ and Stab2−/− TA muscles at CTX5, CTX7, and CTX14 (days 5, 7, and 14 after CTX injection). Representative sections are shown. Black boxes are shown at higher magnification. Black arrowheads indicate necrotic myofibres. Scale bars, 50 μm. (b) Cross-sectional areas (CSAs) of regenerating myofibres were analysed at CTX5, CTX7, and CTX14 using the Image J program. Data are presented as mean±s.d. (n=5 per time point) of each group. (c) Immunostaining for desmin and laminin in Stab2+/+ and Stab2−/− TA muscles at 7 days after CTX injection. Scale bar, 50 μm. (d) The levels of embryonic MyHC (Myh3) mRNA were analysed in TA muscle of wild-type and Stab2-deficient mice during muscle regeneration after CTX injury. Data are presented as mean±s.d. of at least three independent experiments. (e) The number of pax7-positive satellite cells per mm2 was counted for TA muscles of wild-type and Stab2-deficient mice (n=5). (f) DAPI-stained nuclei within dystrophin-positive sarcolemma were analysed in regenerating muscles from Stab2+/+ and Stab2−/− mice, and numbers of myonuclei per myofibre were calculated. Data are presented as mean±s.d. (n=5) of each genotype. (g,h) The distributions of fibre sizes at CTX7 (g) and CTX14 (h) were analysed. More than 2,000 fibres were measured in each sample (n=5). Data are presented as mean±s.d. (n=5). Asterisks indicate statistical significance (*P<0.05, **P<0.01, Student's t-test).
Figure 7
Figure 7. Stabilin-2 contributes to phosphatidylserine-dependent myoblast fusion.
(a,b) C2C12 cells were incubated with differentiation medium for 5 days in the presence of anti-PS antibody or isotype-matched IgG. Representative images (a) are shown. Scale bars, 100 μm. Fusion indices (b) were calculated. Data are presented as mean±s.d. (n=3). (c) The fusion indices of C2C12/Mock and C2C12/Stab2 cells in the presence of pan-caspase inhibitor (z-VAD-fmk, 30 μM) or DMSO were calculated at DM5 (n=3). (d) The fusion indices of C2C12/Mock and C2C12/Stab2 cells in the presence of anti-PS antibody (10 μg ml−1) or isotype-matched IgG (10 μg ml−1) were calculated at DM5 (n=4). (e,f) L/Stab2 cells were incubated with fusion medium for 48 h in the presence of anti-PS antibody or isotype-matched IgG. Representative images (e) are shown. Red arrowheads indicate multinucleated cells. Scale bars, 100 μm. Fusion indices (f) were calculated. Data are presented as mean±s.d. (n=3). (g) Stab2+/+ and Stab2−/− myoblasts were induced to differentiate in the presence of anti-PS antibody or isotype-matched IgG. After 48 h, cells were stained with anti-MyHC antibody. Representative microscopic fields are shown. Scale bars, 100 μm. (h) At DM2, the fusion indices of Stab2+/+ and Stab2−/− myoblasts in the presence of anti-PS antibody or isotype-matched IgG were calculated. Data are presented as mean±s.d. (n=3). (i) Stab2+/+ and Stab2−/− myoblasts were fixed and immunostained for MyHC after 2 days of differentiation (DM2), and the percentage of nuclei present in MyHC-positive cells with the indicated number of nuclei were calculated. Data are presented as mean±s.d. (n=3). (j) Stab2+/+ and Stab2−/− myoblasts were induced to differentiate in the presence of PS/PC liposomes (30 μM) or PC liposomes (30 μM). After 48 h, cells were stained with anti-MyHC antibody. Representative microscopic fields are shown. Scale bars, 100 μm. (k) At DM2, the fusion indices of Stab2+/+ and Stab2−/− myoblasts in the presence of in the presence of PS/PC liposomes or PC liposomes were calculated. Data are presented as mean±s.d. (n=3). Asterisks indicate statistical significance (*P<0.05, **P<0.01, ***P<0.001, Student's t-test).

References

    1. Wakelam M. J. The fusion of myoblasts. Biochem. J. 228, 1–12 (1985). - PMC - PubMed
    1. Abmayr S. M., Balagopalan L., Galletta B. J. & Hong S. J. Cell and molecular biology of myoblast fusion. Int. Rev. Cytol. 225, 33–89 (2003). - PubMed
    1. Schlegel R. A. & Williamson P. Phosphatidylserine, a death knell. Cell Death Differ. 8, 551–563 (2001). - PubMed
    1. Fadeel B. & Xue D. PS externalization: from corpse clearance to drug delivery. Cell Death Differ. 13, 360–362 (2006). - PubMed
    1. Van den Eijnde S. M., Boshart L., Reutelingsperger C. P., De Zeeuw C. I. & Vermeij-Keers C. Phosphatidylserine plasma membrane asymmetry in vivo: a pancellular phenomenon which alters during apoptosis. Cell Death Differ. 4, 311–316 (1997). - PubMed

Publication types

MeSH terms

Substances