T1ρ and T2 relaxation times are associated with progression of hip osteoarthritis
- PMID: 26973330
- PMCID: PMC4955678
- DOI: 10.1016/j.joca.2016.03.005
T1ρ and T2 relaxation times are associated with progression of hip osteoarthritis
Abstract
Objective: To evaluate whether baseline T1ρ and T2 relaxation times of hip cartilage are associated with magnetic resonance imaging (MRI) based progression of hip osteoarthritis (OA) at 18 months.
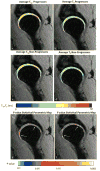
Methods: 3T MRI studies of the hip were obtained at baseline and 18-month follow-up for 54 subjects without evidence of severe OA at baseline [Kellgren-Lawrence (KL) score of 0-3]. 2D fast spin-echo sequences were used for semi-quantitative morphological scoring of cartilage lesions and a combined T1ρ/T2 sequence was used to quantitatively assess cartilage composition. Progression of hip OA was defined based on incident or progression of morphological semi-quantitative grade at 18 months. Baseline T1ρ and T2 relaxation times were compared between progressors and non-progressors using one-way analysis of variance and Mann-Whitney U tests and used to predict progression with binary logistic regression after adjusting for age, gender, body mass index, and KL score. Additionally, a novel voxel-based relaxometry technique was used to compare the spatial distribution of baseline T1ρ and T2 between progressors and non-progressors.
Results: Significantly higher baseline T1ρ and T2 values were observed in hip OA progressors compared to non-progressors, particularly in the posterosuperior and anterior aspects of the femoral cartilage. Logistic regression showed that higher baseline T1ρ or T2 values in the femoral cartilage were significantly associated with progression of femoral cartilage lesions at 18 months.
Conclusion: T1ρ and T2 relaxation parameters are associated with morphological cartilage degeneration at 18 months and may serve as potential imaging biomarkers for progression of cartilage lesions in hip OA.
Keywords: Hip; Magnetic resonance imaging; Osteoarthritis; Progression; T(1ρ)/T(2); Voxel-based relaxometry.
Copyright © 2016 Osteoarthritis Research Society International. Published by Elsevier Ltd. All rights reserved.
Conflict of interest statement
The authors certify that there are no conflicts of interest to report.
Figures


Similar articles
-
Cartilage T1ρ and T2 Relaxation Times in Patients With Mild-to-Moderate Radiographic Hip Osteoarthritis.Arthritis Rheumatol. 2015 Jun;67(6):1548-56. doi: 10.1002/art.39074. Arthritis Rheumatol. 2015. PMID: 25779656 Free PMC article.
-
Longitudinal study using voxel-based relaxometry: Association between cartilage T1ρ and T2 and patient reported outcome changes in hip osteoarthritis.J Magn Reson Imaging. 2017 May;45(5):1523-1533. doi: 10.1002/jmri.25458. Epub 2016 Sep 14. J Magn Reson Imaging. 2017. PMID: 27626787 Free PMC article.
-
Extracting Voxel-Based Cartilage Relaxometry Features in Hip Osteoarthritis Subjects Using Principal Component Analysis.J Magn Reson Imaging. 2020 Jun;51(6):1708-1719. doi: 10.1002/jmri.26955. Epub 2019 Oct 15. J Magn Reson Imaging. 2020. PMID: 31614057 Free PMC article.
-
MRI T2 and T1ρ relaxation in patients at risk for knee osteoarthritis: a systematic review and meta-analysis.BMC Musculoskelet Disord. 2019 May 1;20(1):182. doi: 10.1186/s12891-019-2547-7. BMC Musculoskelet Disord. 2019. PMID: 31039785 Free PMC article.
-
MRI-based T1rho and T2 cartilage compositional imaging in osteoarthritis: what have we learned and what is needed to apply it clinically and in a trial setting?Skeletal Radiol. 2023 Nov;52(11):2137-2147. doi: 10.1007/s00256-023-04310-x. Epub 2023 Mar 31. Skeletal Radiol. 2023. PMID: 37000230 Free PMC article. Review.
Cited by
-
T2 MAPPING OF ACETABULAR CARTILAGE IN PATIENTS WITH PRIMARY OSTEOARTHRITIS AND DDH-INDUCED SECONDARY OSTEOARTHRITIS ANALYSED WITH 7 TESLA MICRO-MRI.Acta Clin Croat. 2023 Aug;62(Suppl3):30-36. doi: 10.20471/acc.2023.62.s3.4. Acta Clin Croat. 2023. PMID: 40337647 Free PMC article.
-
Cross-sectional and longitudinal study of the impact of posterior meniscus horn lesions on adjacent cartilage composition, patient-reported outcomes and gait biomechanics in subjects without radiographic osteoarthritis.Osteoarthritis Cartilage. 2017 May;25(5):708-717. doi: 10.1016/j.joca.2016.10.025. Epub 2016 Nov 9. Osteoarthritis Cartilage. 2017. PMID: 27838383 Free PMC article.
-
Current and Future Advanced Imaging Modalities for the Diagnosis of Early Osteoarthritis of the Hip.Orthop Res Rev. 2022 Sep 14;14:327-338. doi: 10.2147/ORR.S357498. eCollection 2022. Orthop Res Rev. 2022. PMID: 36131944 Free PMC article. Review.
-
Short term outcomes of hip arthroscopy on hip joint mechanics and cartilage health in patients with femoroacetabular impingement syndrome.Clin Biomech (Bristol). 2020 Jan;71:214-220. doi: 10.1016/j.clinbiomech.2019.11.014. Epub 2019 Nov 26. Clin Biomech (Bristol). 2020. PMID: 31794897 Free PMC article.
-
Local associations between knee cartilage T1ρ and T2 relaxation times and patellofemoral joint stress during walking: A voxel-based relaxometry analysis.Knee. 2018 Jun;25(3):406-416. doi: 10.1016/j.knee.2018.02.016. Epub 2018 Apr 19. Knee. 2018. PMID: 29681528 Free PMC article.
References
-
- Murphy LB, Helmick CG, Schwartz TA, Renner JB, Tudor G, Koch GG, et al. One in four people may develop symptomatic hip osteoarthritis in his or her lifetime. Osteoarthritis and Cartilage. 2010;18(11):1372–9. doi: http://dx.doi.org/10.1016/j.joca.2010.08.005. - DOI - PMC - PubMed
-
- Salaffi F, Carotti M, Stancati A, Grassi W. Health-related quality of life in older adults with symptomatic hip and knee osteoarthritis: a comparison with matched healthy controls. Aging Clin Exp Res. 2005;17(4):255–63. Epub 2005/11/16. - PubMed
-
- Gold GE, Cicuttini F, Crema MD, Eckstein F, Guermazi A, Kijowski R, et al. OARSI Clinical Trials Recommendations: Hip imaging in clinical trials in osteoarthritis. Osteoarthritis and Cartilage. 2015;23(5):716–31. doi: http://dx.doi.org/10.1016/j.joca.2015.03.004. - DOI - PMC - PubMed
-
- Dijkgraaf LC, de Bont LG, Boering G, Liem RS. The structure, biochemistry, and metabolism of osteoarthritic cartilage: a review of the literature. J Oral Maxillofac Surg. 1995;53(10):1182–92. Epub 1995/10/01. - PubMed
MeSH terms
Grants and funding
LinkOut - more resources
Full Text Sources
Other Literature Sources

