Review
. 2016;29(1 Suppl):1S-125S.
doi: 10.1293/tox.29.1S. Epub 2016 Feb 13.

Nonproliferative and Proliferative Lesions of the Gastrointestinal Tract, Pancreas and Salivary Glands of the Rat and Mouse

Affiliations
Review

Nonproliferative and Proliferative Lesions of the Gastrointestinal Tract, Pancreas and Salivary Glands of the Rat and Mouse

Thomas Nolte et al. J Toxicol Pathol. 2016.

Abstract

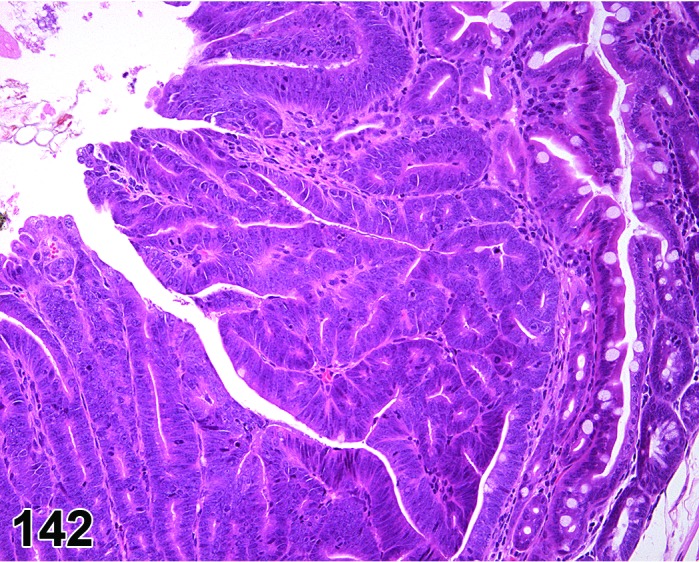
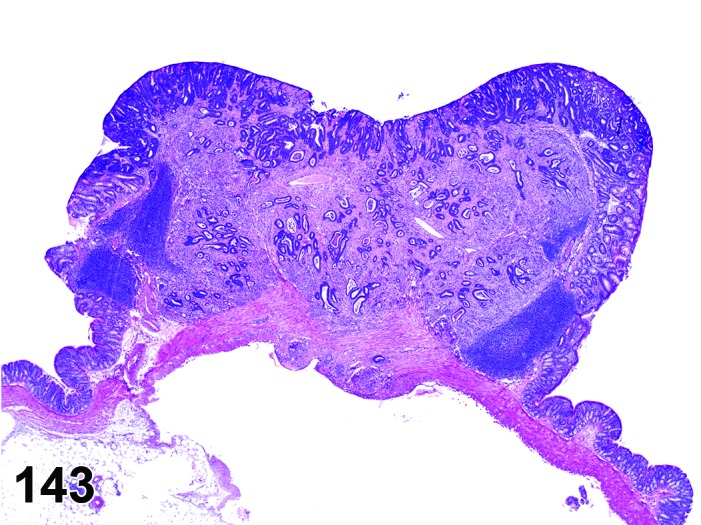
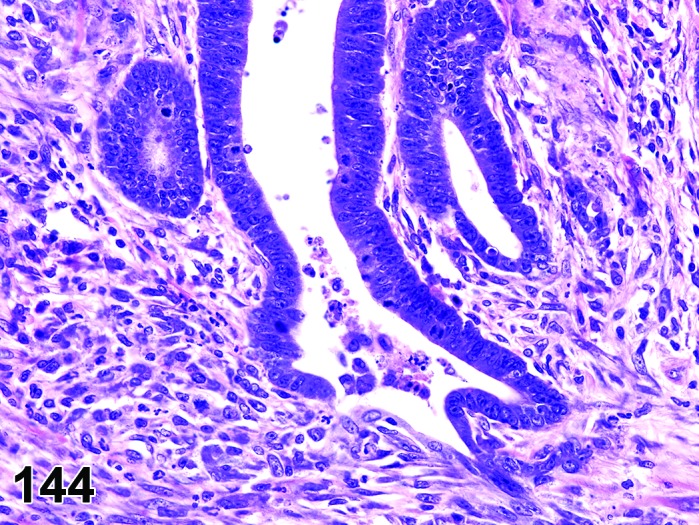
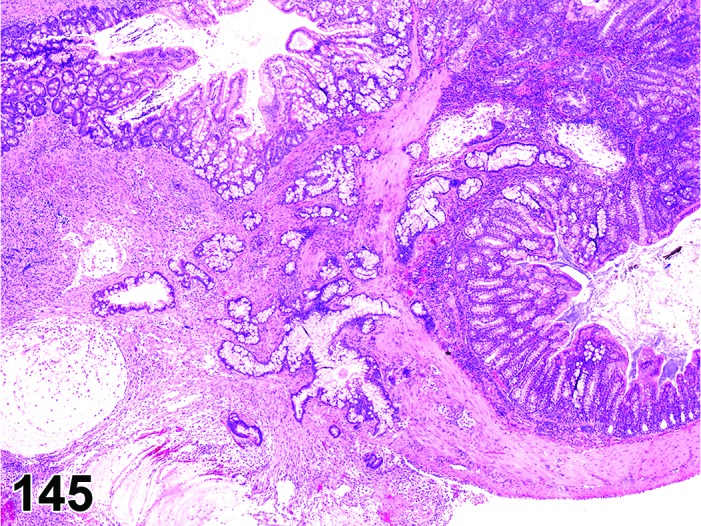
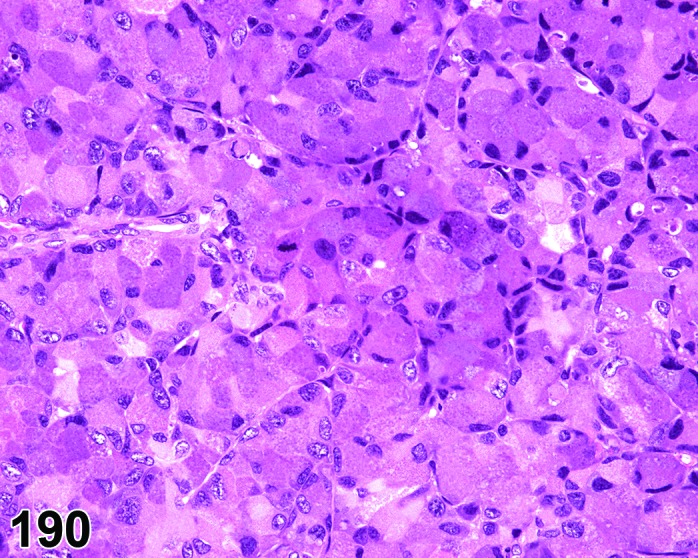
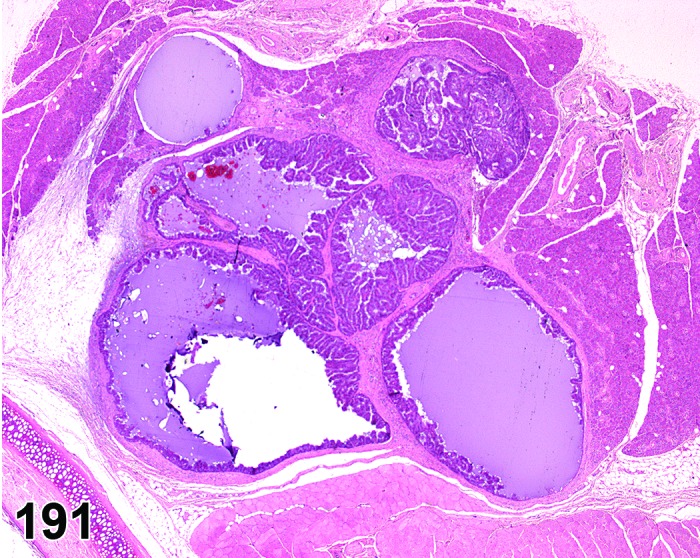
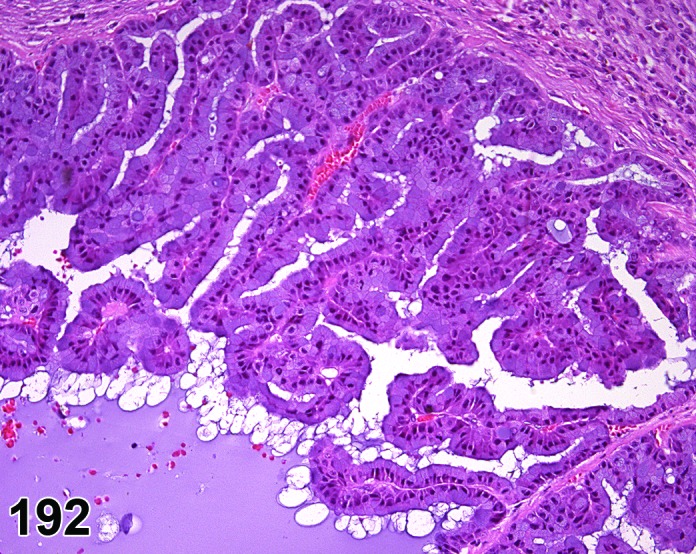
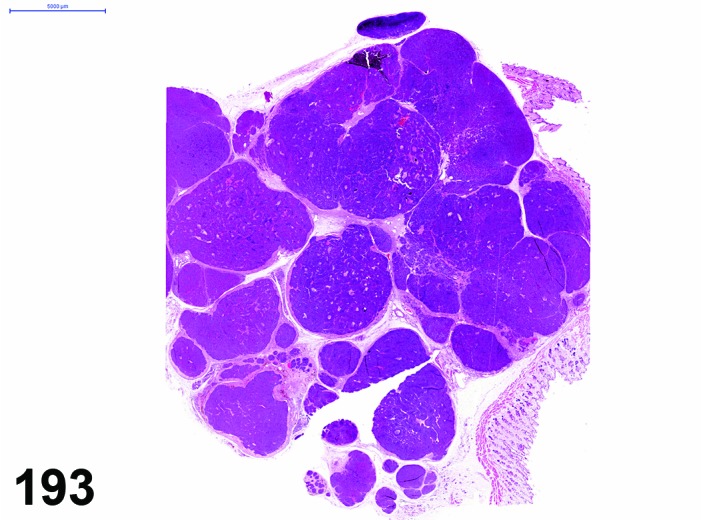
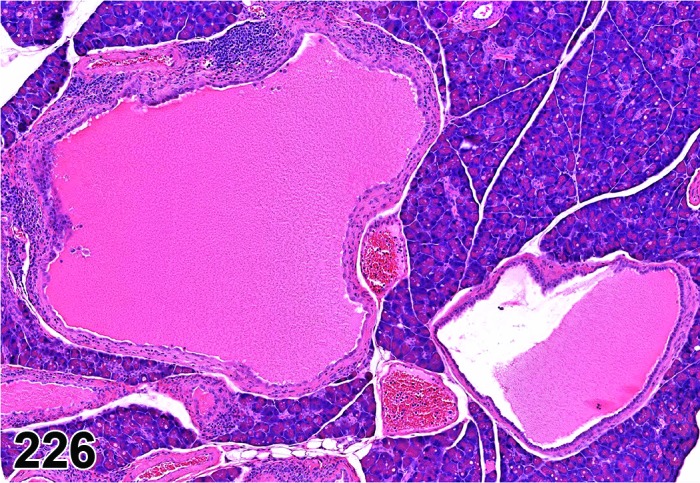
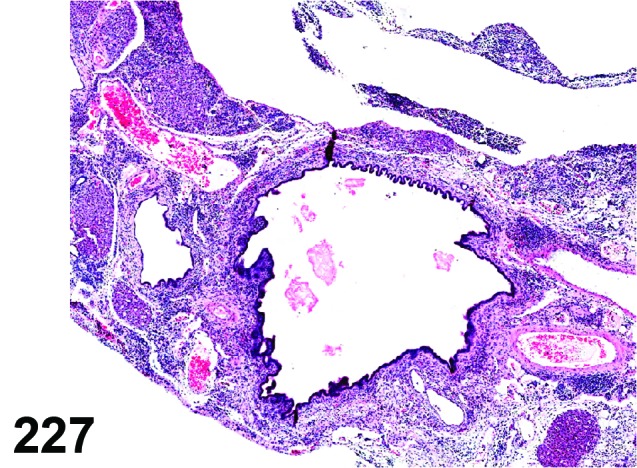
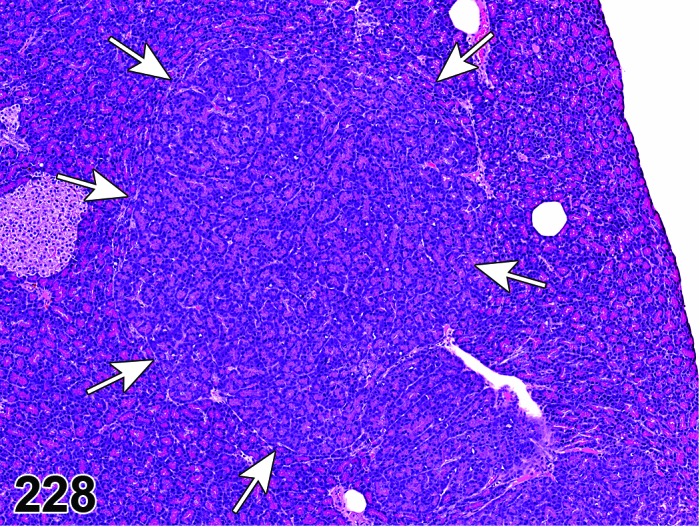
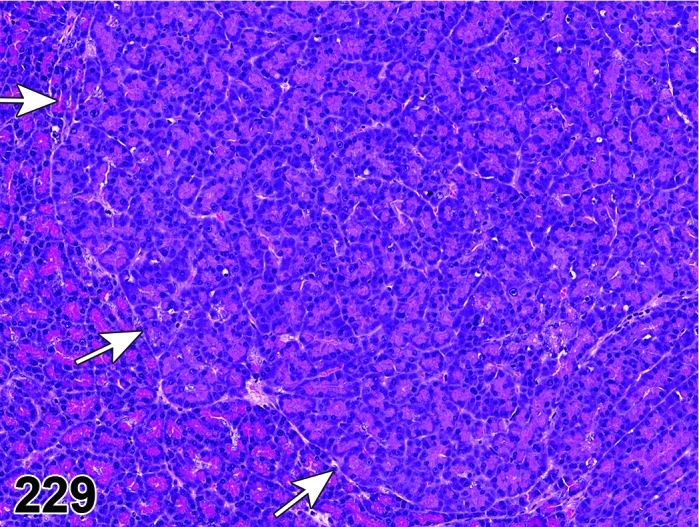
The INHAND (International Harmonization of Nomenclature and Diagnostic Criteria for Lesions in Rats and Mice) project is a joint initiative of the Societies of Toxicologic Pathology from Europe (ESTP), Great Britain (BSTP), Japan (JSTP), and North America (STP) to develop an internationally accepted nomenclature and diagnostic criteria for nonproliferative and proliferative lesions in laboratory animals. The purpose of this publication is to provide a standardized nomenclature and diagnostic criteria for classifying lesions in the digestive system including the salivary glands and the exocrine pancreas of laboratory rats and mice. Most lesions are illustrated by color photomicrographs. The standardized nomenclature, the diagnostic criteria, and the photomicrographs are also available electronically on the Internet (http://www.goreni.org/). Sources of material included histopathology databases from government, academia, and industrial laboratories throughout the world. Content includes spontaneous and age related lesions as well as lesions induced by exposure to test items. Relevant infectious and parasitic lesions are included as well. A widely accepted and utilized international harmonization of nomenclature and diagnostic criteria for the digestive system will decrease misunderstandings among regulatory and scientific research organizations in different countries and provide a common language to increase and enrich international exchanges of information among toxicologists and pathologists.

Keywords: diagnostic criteria; diagnostic pathology; digestive system or tract; esophagus; intestine; large intestine; nomenclature; oral cavity; pancreas se; salivary glands; small intestine; stomach.


Figures

Figure 1
Figure 1
Rat gingiva. Ectopic sebaceous glands (Fordyce’s granules).
Figure 2
Figure 2
Rat gingiva. Cystic dilation of duct in ectopic sebaceous glands.
Figure 3
Figure 3
Rat esophagus. Dilation.
Figure 4
Figure 4
Rat esophagus. Detail of dilated esophagus in Figure 3. Dilation characterized by lumen distended with food content.
Figure 5
Figure 5
Rat esophagus. Diverticulum distended with food content.
Figure 6
Figure 6
Mouse tongue. Cyst.
Figure 7
Figure 7
Mouse tongue. Detail of cyst in Figure 6. Lined by squamous epithelium, this cyst likely originated from an obstructed salivary gland duct in the tongue.
Figure 8
Figure 8
Rat tongue. Atrophy, epithelium and apoptosis.
Figure 9
Figure 9
Rat tongue. Ulcer with mixed inflammatory cell infiltrate in muscle layer.
Figure 10
Figure 10
Rat tongue. Ulcer (borderline erosion) with inflammation, neutrophilic.
Figure 11
Figure 11
Rat tongue Apoptosis of epithelial cells (arrows). Higher magnification of Figure 8.
Figure 12
Figure 12
Rat esophagus. Degeneration/necrosis, muscle.
Figure 13
Figure 13
Mouse tongue. Subepithelial amyloid deposition.
Figure 14
Figure 14
Rat tongue. Mineralization, vessel.
Figure 15
Figure 15
Rat esophagus. Hyperkeratosis, orthokeratotic.
Figure 16
Figure 16
Rat, tongue. Hyperkeratosis, parakeratotic.
Figure 17
Figure 17
Rat tongue. Infiltrate, mononuclear cell.
Figure 18
Figure 18
Rat esophagus. Infiltrate, mononuclear cell.
Figure 19
Figure 19
Rat tongue. Inflammation, neutrophilic, muscle.
Figure 20
Figure 20
Rat tongue. Inflammation, mixed with associated reactive hyperplasia of adjacent mucosal epithelium.
Figure 21
Figure 21
Rat tongue. Inflammation, foreign body.
Figure 22
Figure 22
Rat tongue. Inflammation, foreign body.
Figure 23
Figure 23
Rat tongue. Inflammation, vessel.
Figure 24
Figure 24
Rat tongue. Hemorrhage.
Figure 25
Figure 25
Rat esophagus. Hyperplasia, squamous cell.
Figure 26
Figure 26
Rat esophagus. Hyperplasia, squamous cell.
Figure 27
Figure 27
Rat esophagus. Hyperplasia squamous cell, atypical.
Figure 28
Figure 28
Mouse tongue. Papilloma, squamous cell.
Figure 29
Figure 29
Rat esophagus. Carcinoma, squamous cell.
Figure 30
Figure 30
Rat esophagus. Detail of carcinoma, squamous cell in Figure 29.
Figure 31
Figure 31
Rat tongue. Carcinoma, squamous cell.
Figure 32
Figure 32
Rat tongue. Carcinoma, squamous cell. Detail of carcinoma, squamous cell in Figure 31.
Figure 33
Figure 33
Rat tongue. Tumor, granular cell, benign.
Figure 34
Figure 34
Rat tongue. Tumor, granular cell, benign. Higher magnification of Figure 33.
Figure 35
Figure 35
Rat glandular stomach. Cyst squamous.
Figure 36
Figure 36
Rat glandular stomach. Cyst squamous. Higher magnification of Figure 35.
Figure 37
Figure 37
Mouse glandular stomach. Hepatocytes, ectopic; note presence of hepatocytes in the submucosa and mucosa.
Figure 38
Figure 38
Mouse glandular stomach. Hepatocytes, ectopic. Higher magnification of Figure 37.
Figure 39
Figure 39
Mouse glandular stomach. Pancreas ectopic.
Figure 40
Figure 40
Mouse glandular stomach. Pancreas ectopic. Higher magnification of Figure 39.
Figure 41
Figure 41
Mouse nonglandular stomach. Control.
Figure 42
Figure 42
Mouse nonglandular stomach. Atrophy, squamous epithelium; compare to Figure 41.
Figure 43
Figure 43
Rat nonglandular stomach. Vacuolation, squamous epithelium, in addition to hyperplasia, squamous cell.
Figure 44
Figure 44
Rat nonglandular stomach. Ulcer.
Figure 45
Figure 45
Mouse nonglandular stomach. Hyperkeratosis, orthokeratotic; compare to Figure 41.
Figure 46
Figure 46
Rat nonglandular stomach. Hyperkeratosis, parakeratotic.
Figure 47
Figure 47
Rat nonglandular stomach. Hyperkeratosis, parakeratotic. Higher magnification of Figure 46.
Figure 48
Figure 48
Rat glandular stomach. Dilatation glands.
Figure 49
Figure 49
Rat glandular stomach. Dilatation glands. Higher magnification of Figure 48; note well differentiated cuboidal epithelium.
Figure 50
Figure 50
Mouse glandular stomach. Cyst.
Figure 51
Figure 51
Mouse fundic mucosa. Normal – compare to Figure 52.
Figure 52
Figure 52
Mouse fundic mucosa. Atrophy mucosal diffuse. Same magnification as Figure 51.
Figure 53
Figure 53
Rat antral mucosa. Normal – compare to Figure 54.
Figure 54
Figure 54
Rat antral mucosa. Secretory depletion. Same magnification as Figure 53.
Figure 55
Figure 55
Rat, glandular stomach, eosinophilic globules.
Figure 56
Figure 56
Mouse glandular stomach. Eosinophilic globules. Note intracellular eosinophilic globules and extracellular eosinphilic crystals.
Figure 57
Figure 57
Mouse glandular stomach. Eosinophilic globules. Note eosinophilic crystals also in epithelial cells that undergo cell death.
Figure 58
Figure 58
Rat glandular stomach. Necrosis, mucosa.
Figure 59
Figure 59
Rat glandular stomach. Erosion, focal.
Figure 60
Figure 60
Rat glandular stomach. Hypertrophy, mucus cell.
Figure 61
Figure 61
Rat glandular stomach. Amyolid.
Figure 62
Figure 62
Rat glandular stomach. Amyloid. Higher magnification of Figure 61.
Figure 63
Figure 63
Rat glandular stomach. Mineralization.
Figure 64
Figure 64
Mouse glandular stomach. Infiltrate mononuclear focal.
Figure 65
Figure 65
Mouse glandular stomach. Inflammation neutrophil with hypertrophy, mucus cell.
Figure 66
Figure 66
Mouse glandular stomach. Yeast.
Figure 67
Figure 67
Rat nonglandular stomach. Hyperplasia squamous cell focal.
Figure 68
Figure 68
Rat nonglandular stomach. Hyperplasia squamous cell focal. Higher magnification of Figure 67 indicating maintained polarity of epithelium and complete differentiation to keratinocytes.
Figure 69
Figure 69
Rat nonglandular stomach. Hhyperplasia basal cell, focal. Note unaltered suprabasal epithelial layers.
Figure 70
Figure 70
Rat nonglandular and glandular stomach. Foci of hyperplastic basal cells in the glandular mucosa close to the limiting ridge. As this lesion is considered to originate from nonglandular stomach it should be collected under the term “nonglandular stomach, hyperplasia, basal cell”.
Figure 71
Figure 71
Higher magnification of Figure 70, showing the basal cell character of the lesion.
Figure 72
Figure 72
Mouse nonglandular stomach. Papilloma, squamous cell.
Figure 73
Figure 73
Rat nonglandular stomach. Carcinoma squamous cell, arising from diffuse severe hyperplasia, squamous cell.
Figure 74
Figure 74
Rat nonglandular stomach. Carcinoma squamous cell; infiltrative growth with fibroblastic stromal response.
Figure 75
Figure 75
Mouse glandular stomach. Diverticulum. Well-differentiated mucosa present in submucosal to subserosal location.
Figure 76
Figure 76
Mouse glandular stomach. Diverticulum. Higher magnification of Figure 75. Note growth pattern indicating maintained basement membrane integrity.
Figure 77
Figure 77
Mouse glandular stomach. Diverticulum. Penetration of muscularis mucosae by well differentiated single-layered epithelium with maintained basement membrane integrity.
Figure 78
Figure 78
Mouse glandular stomach. Diverticula, some of them atypical (arrows).
Figure 79
Figure 79
Mouse glandular stomach. Diverticula atypical. Higher magnification of Figure 78.
Figure 88
Figure 88
Mouse glandular stomach. Diverticulum atypical. Higher magnification of Figure 87. Atypia evidenced by increased cellularity and absence of intracellular mucus. Note intact basement membrane.
Figure 80
Figure 80
Mouse glandular stomach. Hyperplasia, focal, mucosa, atypical.
Figure 81
Figure 81
Mouse glandular stomach. Hyperplasia, focal, mucosa, atypical. Higher magnification of Figure 80.
Figure 82
Figure 82
Mouse glandular stomach. Hyperplasia, diffuse, mucosa. Age-related diffuse hyperplasia of fundic mucosa.
Figure 83
Figure 83
Rat glandular stomach. Hyperplasia neuroendocrine cell (arrows).
Figure 84
Figure 84
Rat glandular stomach. Hyperplasia neuroendocrine cell. Higher magnification of Figure 83. Note characteristics of neuroendocrine cells: clear cytoplasm and small, monomorphic nuclei.
Figure 85
Figure 85
Mouse glandular stomach. Adenoma, polypoid.
Figure 86
Figure 86
Mouse glandular stomach. Adenoma, polypoid. Higher magnification of Figure 85 demonstrating distorted mucosal architecture.
Figure 87
Figure 87
Mouse glandular stomach. Adenoma, sessile and multiple diverticula.
Figure 89
Figure 89
Rat glandular stomach. Adenocarcinoma.
Figure 90
Figure 90
Rat glandular stomach. Adenocarcinoma. Higher magnification of Figure 89, showing true infiltrative growth with lost basement membrane integrity. Stroma immature and cellular.
Figure 91
Figure 91
Rat glandular stomach. Tumor, neuroendocrine cell, benign; on a background of disseminated neuroendocrine hyperplasia. Tumor outlined by arrows.
Figure 92
Figure 92
Rat glandular stomach. Tumor, neuroendocrine cell, benign. Higher magnification of Figure 91. Note increased cytoplasmic eosinophilia and mild nuclear and cellular pleomorphism.
Figure 93
Figure 93
Rat glandular stomach. Tumor, neuroendocrine cell, malignant.
Figure 94
Figure 94
Rat glandular stomach. Tumor, neuroendocrine cell, malignant. Higher magnification of Figure 93. Note presence of neoplastic neuroendocrine cells in submucosal location indicative of infiltrative growth.
Figure 95
Figure 95
Rat glandular stomach. Leiomyoma.
Figure 96
Figure 96
Rat glandular stomach. Leiomyoma. Higher magnification of Figure 95, demonstrating the monomorphic character of the spindle shaped tumor cells.
Figure 97
Figure 97
Rat nonglandular stomach. Leiomyosarcoma.
Figure 98
Figure 98
Rat nonglandular stomach. Leiomyosarcoma. Higher magnification of Figure 97. Cellular pleomorphism characterizes this tumor as malignant.
Figure 99
Figure 99
Rat duodenum. Ectopic tissue, pancreas.
Figure 100
Figure 100
Mouse cecum. Cyst, squamous.
Figure 101
Figure 101
Rat duodenum. Atrophy, Brunner’s glands.
Figure 102
Figure 102
Rat jejunum. Atrophy, mucosal. Blunted villi and markedly flattened crypt epithelium.
Figure 103
Figure 103
Rat duodenum. Normal mucosa (for comparison to Figure 104).
Figure 104
Figure 104
Rat duodenum. Hypertrophy, mucosal, diffuse. Same magnification as Figure 103.
Figure 105
Figure 105
Mouse jejunum. Hypertrophy, Paneth cell.
Figure 106
Figure 106
Rat colon. Metaplasia, Paneth cell. Note also epithelial atrophy in some crypts.
Figure 107
Figure 107
Rat, duodenum, vacuolation, mucosa (enterocytes) diffuse.
Figure 108
Figure 108
Rat, jejunum. Vacuolation, mucosa, foamy. Note affected cells in lamina propria.
Figure 109
Figure 109
Degeneration/necrosis, Brunner’s glands.
Figure 110
Figure 110
Mouse ileum. Lymphangiectasis and edema.
Figure 111
Figure 111
Mouse colon (Bouin’s fixed). Syncycia, epithelium.
Figure 112
Figure 112
Rat jejunum. Apoptosis (arrows) in a severely atrophic mucosa.
Figure 113
Figure 113
Rat duodenum. Necrosis, mucosa, focal.
Figure 114
Figure 114
Mouse colon. Erosion with regenerative hyperplasia.
Figure 124
Figure 124
Rat cecum. Inflammation, mixed. Note mucosal erosion and submucosal edema.
Figure 115
Figure 115
Mouse ileum. Amyloid in lamina propria of villi.
Figure 116
Figure 116
Rat duodenum. Mineralization of muscularis.
Figure 117
Figure 117
Rat duodenum. Metaplasia, osseous.
Figure 118
Figure 118
Rat rectum. Dilation.
Figure 119
Figure 119
Mouse jejunum. Intussusception.
Figure 120
Figure 120
Rat rectum. Prolapse, cross section.
Figure 121
Figure 121
Mouse rectum (Bouin’s fixed). Polapse, longitudinal section.
Figure 122
Figure 122
Mouse rectum. Prolapse. Higher magnification of Figure 121. Note diverticula in area of mixed inflammation with hair fragment.
Figure 123
Figure 123
Mouse rectum. Infiltrate, mononuclear.
Figure 125
Figure 125
Mouse cecum. Inflammation, neutrophilic. Note submucosal edema.
Figure 126
Figure 126
Rat rectum. Parasites.
Figure 127
Figure 127
Mouse colon. Protozoa, probably Trichomonas muris.
Figure 128
Figure 128
Mouse colon. Neuronal degeneration, myenteric plexus with formation of hyaline inclusions in ganglion cells (flavivirus infection).
Figure 129
Figure 129
Mouse colon. Diverticulum, characterized by extension of intact mucosa into subserosal tissue.
Figure 130
Figure 130
Mouse colon. Multiple diverticula, some of them cystic (arrows).
Figure 131
Figure 131
Mouse colon. Diverticulum, cystic. Higher magnification of Figure 130. Note flattened mucosa.
Figure 132
Figure 132
Mouse colon. Hyperplasia, mucosa, regenerative, at edge of ulcer.
Figure 133
Figure 133
Mouse duodenum. Hyperplasia, avillous.
Figure 134
Figure 134
Mouse small intestine. Hyperplasia, focal, atypical. Note loss of regular architecture and cellular atypia.
Figure 135
Figure 135
Mouse (hemizygous rasH2), duodenum by Normal Brunner’s glands.
Figure 136
Figure 136
Mouse (hemizygous rasH2), duodenum by Hyperplasia Brunner’s glands. Note tortuous glandular structure with basophilic cytoplasmic staining.
Figure 137
Figure 137
Mouse, rectum, metaplasia, squamous cell.
Figure 138
Figure 138
Mouse jejunum. Adenoma, polypoid.
Figure 139
Figure 139
Mouse jejunum. Adenoma, polypoid. Higher magnification of Figure 138, demonstrating loss of regular mucosal architecture but low grade of atypia.
Figure 140
Figure 140
Rat colon. Adenoma, polypoid.
Figure 141
Figure 141
Rat jejunum. Adenoma, sessile; with diverticula, atypical. Note expansive growth beyond the confinement of the surrounding mucosa.
Figure 142
Figure 142
Rat jejunum. Adenoma, sessile. Higher magnification of Figure 141 demonstrating irregular growth pattern and moderate cellular atypia.
Figure 143
Figure 143
Rat colon. Adenocarcinoma, scirrhous.
Figure 144
Figure 144
Rat colon. Adenocarcinoma, scirrhous. Higher magnification of Figure 143, demonstrating tubule structure of atypical tumor cell with lost basement membrane integrity, embedded in scirrhous stroma.
Figure 145
Figure 145
Mouse colon. Adenocarcinoma, mucinous.
Figure 146
Figure 146
Mouse colon. Adenocarcinoma, signet ring type.
Figure 147
Figure 147
Mouse (hemizygous rasH2), duodenum. Carcinoma, Brunner’s glands.
Figure 148
Figure 148
Mouse cecum. Leiomyoma.
Figure 149
Figure 149
Mouse cecum. Leiomyoma. Higher magnification of Figure 148.
Figure 150
Figure 150
Mouse colon. Leiomyosarcoma.
Figure 151
Figure 151
Mouse colon. Leiomyosarcoma; higher magnification of Figure 150.
Figure 152
Figure 152
Mouse colon. Gastrointestinal stromal tumor, benign.
Figure 153
Figure 153
Mouse colon. Gastrointestinal stromal tumor, benign. Immunohistochemistry for CD117.
Figure 154
Figure 154
Mouse colon. Gastrointestinal stromal tumor, benign. Immunohistochemistry for smooth muscle actin.
Figure 155
Figure 155
Mouse cecum. Gastrointestinal stromal tumor, malignant.
Figure 156
Figure 156
Mouse (male, 4-month old) submandibular gland. Note abundance of eosinophilic secretory granules in granular ducts.
Figure 157
Figure 157
Mouse (female, 4-month old) submandibular gland. Note almost complete absence of eosinophilic secretory granules in granular ducts.
Figure 158
Figure 158
Rat sublingual gland. Ectopic tissue, parotid gland (arrow).
Figure 159
Figure 159
Rat sublingual gland. Ectopic tissue, parotid gland; higher magnification of Figure 158.
Figure 160
Figure 160
Rat linugal von Ebner’s gland. Vacuolation and secretory depletion.
Figure 161
Figure 161
Mouse submandibular gland. Accumulation, adipocytes.
Figure 162
Figure 162
Rat sublingual gland. Single cell necrosis / apoptosis. Note numerous apoptotic bodies, some indicated by arrows.
Figure 163
Figure 163
Rat submandibular gland. Necrosis, accompanied by neutrophilic inflammation with edema.
Figure 164
Figure 164
Rat lingual Weber’s gland. Control (for comparison to Figure 165).
Figure 165
Figure 165
Rat lingual Weber’s gland. Secretory depletion, acinar cell. Same magnification as Figure 164.
Figure 166
Figure 166
Mouse (male) submandibular gland. Secretory depletion, granular ducts; compare to Control – Figure 156.
Figure 167
Figure 167
Mouse (female) submandibular gland. Granulation increased, granular duct. Compare to Control – Figure 157.
Figure 168
Figure 168
Rat parotid gland. Atrophy, focal.
Figure 169
Figure 169
Rat submandibular gland. Atrophy, acinar cell. Area most severely affected indicated by arrows.
Figure 170
Figure 170
Rat sublingual gland. Atrophy, acinar cell. Normal tissue limited to upper and lower right corner.
Figure 171
Figure 171
Mouse sublingual gland. Pigment.
Figure 172
Figure 172
Mouse parotid gland. Amyloid, accompanied by atrophy.
Figure 173
Figure 173
Mouse submandibular gland. Infiltrate, mononuclear cell.
Figure 174
Figure 174
Rat submandibular gland. Inflammation, neutrophil. The necrosis is part of the inflammation and covered by this term.
Figure 175
Figure 175
Mouse submandibular gland. Inflammation, mononuclear cell. The vacuolation of acinar cells and other degenerative processes are covered by this term; viral etiology.
Figure 176
Figure 176
Mouse parotid gland. Inflammation, mononuclear cell. Intranuclear inclusion bodies, some of them indicated by arrows (cytomegaly virus).
Figure 177
Figure 177
Rat parotid gland. Inflammation, mixed; acompanied by regenerative hyperplasia with atypia. Intranuclear inclusion bodies, some of them indicated by arrows (rat papilloma virus).
Figure 178
Figure 178
Mouse parotid gland. Edema.
Figure 179
Figure 179
Rat parotid gland. Calculi, ductular, accompanied by atrophy, accumulation adipocytes and fibrosis.
Figure 180
Figure 180
Rat submandibular gland. Ectasia, duct.
Figure 181
Figure 181
Mouse sublingual gland. Fibrosis, accompanied by atrophy and angiectasis.
Figure 182
Figure 182
Rat parotid gland. Focus, hypertrophic, basophilic.
Figure 183
Figure 183
Rat parotid gland. Focus, hypertrophic, basophilic, exaggerated lesion.
Figure 184
Figure 184
Rat submandibular gland. Metaplasia, acinar cell (arrows) aquiring the morphology of parotid acinar cells.
Figure 185
Figure 185
Rat submandibular gland. Metaplasia squamous cell.
Figure 186
Figure 186
Rat sublingual gland. Metaplasia, squamous cell.
Figure 187
Figure 187
Rat parotid gland. Hyperplasia ductal.
Figure 188
Figure 188
Rat paroid gland. Adenoma, tubular (left) and acinar (right).
Figure 189
Figure 189
Rat parotid gland. Adenoma, tubular. Higher magnification of Figure 188.
Figure 190
Figure 190
Rat parotid gland. Adenoma, acinar. Higher magnification of Figure 188.
Figure 191
Figure 191
Rat parotid gland. Adenoma, papillary.
Figure 192
Figure 192
Rat parotid gland. Adenoma, papillary. Higher magnification of Figure 191.
Figure 193
Figure 193
Rat parotid gland. Adenocarcinoma, acinar.
Figure 194
Figure 194
Rat parotid gland. Adenocarcinoma, acinar. Higher magnification of Figure 193.
Figure 195
Figure 195
Rat sublingual gland. Adenocarcinoma, mixed.
Figure 196
Figure 196
Rat sublingual gland. Adenocarcinoma, mixed. Higher magnification of Figure 195.
Figure 197
Figure 197
Mouse parotid gland. Carcinoma, squamous cell.
Figure 198
Figure 198
Mouse parotid gland. Carcinoma, squamous cell. Higher magnification of Figure 197.
Figure 199
Figure 199
Mouse parotid gland. Carcinoma, squamous cell. Higher magnification of Figure 197.
Figure 200
Figure 200
Mouse submandibular gland. Tumor mixed, malignant.
Figure 201
Figure 201
Mouse submandibular gland. Myoepithelioma, malignant.
Figure 202
Figure 202
Mouse pancreas. Ectopic tissue, spleen.
Figure 203
Figure 203
Rat pancreas. Vacuolation, acinar cell.
Figure 204
Figure 204
Mouse pancreas. Accumulation adipocytes after severe atrophy, acinar cell.
Figure 205
Figure 205
Mouse pancreas. Ectasia duct, with eosinophilic globules.
Figure 206
Figure 206
Mouse panceas. Detail of Figure 205 showing osinophilic globules in the epithelium of an ectatic duct.
Figure 207
Figure 207
Rat pancreas. Autophagic vacuoles, some of them indicated by arrows)
Figure 208
Figure 208
Rat pancreas. Apoptosis: apoptotic bodies (arrows).
Figure 209
Figure 209
Mouse pancreas. Necrosis.
Figure 210
Figure 210
Rat pancreas. Secretory depletion, acinar cell.
Figure 211
Figure 211
Mouse panceas. Atrophy, acinar cell.
Figure 212
Figure 212
Rat pancreas. Atrophy, acinar cell, associated with infltrate mononuclear cell.
Figure 213
Figure 213
Rat panceas. Mineralization (dystrophic) of acinar cells.
Figure 214
Figure 214
Mouse panceas. Amyloid.
Figure 215
Figure 215
Rat pancreas. Pigment .
Figure 216
Figure 216
Rat panceas. Infiltrate, mononuclear cell.
Figure 217
Figure 217
Mouse pancreas. Inflammation, neutrophil.
Figure 218
Figure 218
Rat pancreas. Inflammation, mononuclear cell. Note atrophic acini aquiring ductular morphology.
Figure 219
Figure 219
Mouse pancreas. Inflammation vessel.
Figure 220
Figure 220
Mouse pancreas. Edema.
Figure 221
Figure 221
Rat pancreas. Normal acini – for comparison with Figure 222.
Figure 222
Figure 222
Rat pancreas. Hypertrophy acinar cell diffuse (same magnification as Figure 221).
Figure 223
Figure 223
Mouse pancreas. Halo, peri-insular.
Figure 224
Figure 224
Rat pancreas. Focus, basophilic.
Figure 225
Figure 225
Rat pancreas. Metaplasia,hepatocytic at the interface between endocrine and exocrine tissue.
Figure 226
Figure 226
Mouse pancreas. Ectasia, duct.
Figure 227
Figure 227
Mouse pancreas. Ectasia, duct.
Figure 228
Figure 228
Rat pancreas. Hyperplasia, acinar cell.
Figure 229
Figure 229
Rat pancreas. Hyperplasia, acinar cell. Higher magnification of Figure 228.
Figure 230
Figure 230
Rat pancreas. Hyperplasia, ductal cell, associated with pigment and minimal islet cell fibrosis.
Figure 231
Figure 231
Mouse pancreas. Hyperplasia ductal cell. Note atypical character with mucin accumulation in tall columnar ductal cells in a transgenic mouse model of human pancreatic cancer; lesion resembles low-grade mPanIN.
Figure 232
Figure 232
Mouse pancreas. Hyperplasia ductal cell. Note atypical character with cribriform growth pattern and mucin accumulation in hypertrophic ductal cells in a transgenic mouse model of human pancreatic cancer. Lesion resembles higher-grade mPanIN.
Figure 233
Figure 233
Rat pancreas. Adenoma, acinar cell.
Figure 234
Figure 234
Rat pancreas. Adenoma, acinar cell. Higher magnification of Figure 233. Note sharp demarcation from surrounding tissue by delicate fibrous capsule (arrows).
Figure 235
Figure 235
Mouse pancreas. Adenoma, ductal cell.
Figure 236
Figure 236
Mouse pancreas. Adenoma, ductal cell. Higher magnification of Figure 235.
Figure 237
Figure 237
Rat pancreas. Adenocarcinoma, acinar cell.
Figure 238
Figure 238
Rat pancreas. Adenocarcinoma, acinar cell. Higher magnification of Figure 237.
Figure 239
Figure 239
Rat pancreas. Adenocarcinoma, acinar cell. Higher magnification of Figure 237.
Figure 240
Figure 240
Rat pancreas. Adenocarcinoma, ductal cell. Note prominent scirrhous response.
Figure 241
Figure 241
Rat pancreas. Adenocarcinoma, ductal cell. Higher magnification of Figure 240.

References

    1. Abe K, and Watanabe S. Apoptosis of mouse pancreatic acinar cells after duct ligation. Arch Histol Cytol. 58: 221–229. 1995. - PubMed
    1. Aguirre AJ, Bardeesy N, Sinha M, Lopez L, Tuveson DA, Horner J, Redston MS, and DePinho RA. Activated Kras and Ink4a/Arf deficiency cooperate to produce metastatic pancreatic ductal adenocarcinoma. Genes Dev. 17: 3112–3126. 2003. - PMC - PubMed
    1. Aguirre SA, Liu L, Hosea NA, Scott W, May JR, Burns-Naas LA, Randolph S, Denlinger RH, and Han B. Intermittent oral coadministration of a gamma secretase inhibitor with dexamethasone mitigates intestinal goblet cell hyperplasia in rats. Toxicol Pathol. 42: 422–434. 2014. - PubMed
    1. Anderson LC. Salivary gland structure and function in experimental diabetes mellitus. Biomedical Reviews. 9: 107–119. 1998.
    1. Andersson P, Rubio C, Poellinger L, and Hanberg A. Gastric hamartomatous tumours in a transgenic mouse model expressing an activated dioxin/Ah receptor. Anticancer Res. 25(2A): 903–911. 2005. - PubMed

LinkOut - more resources