

Resveratrol and fenofibrate ameliorate fructose-induced nonalcoholic steatohepatitis by modulation of genes expression
- PMID: 26973390
- PMCID: PMC4779917
- DOI: 10.3748/wjg.v22.i10.2931
Resveratrol and fenofibrate ameliorate fructose-induced nonalcoholic steatohepatitis by modulation of genes expression
Abstract
Aim: To evaluate the effect of resveratrol, alone and in combination with fenofibrate, on fructose-induced metabolic genes abnormalities in rats.
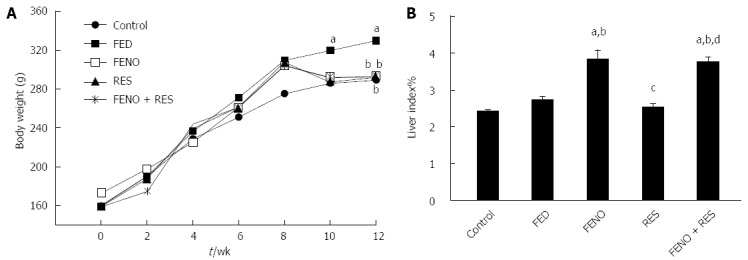
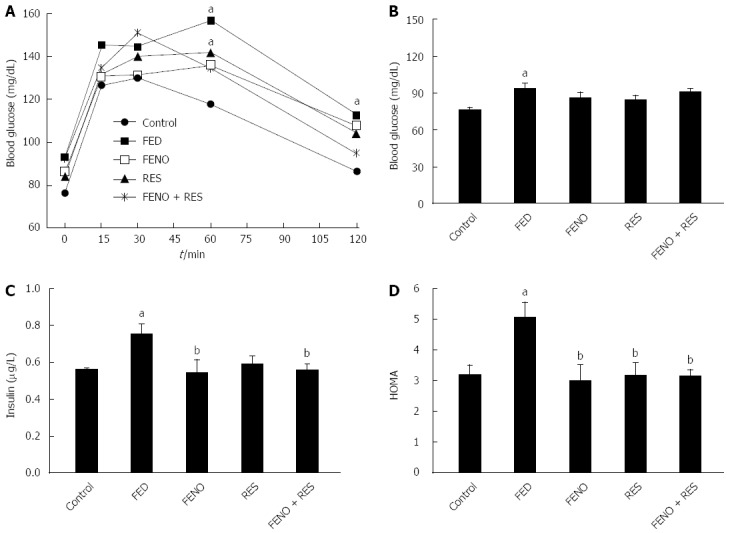
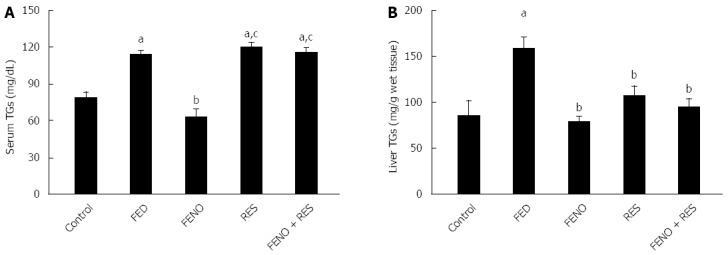
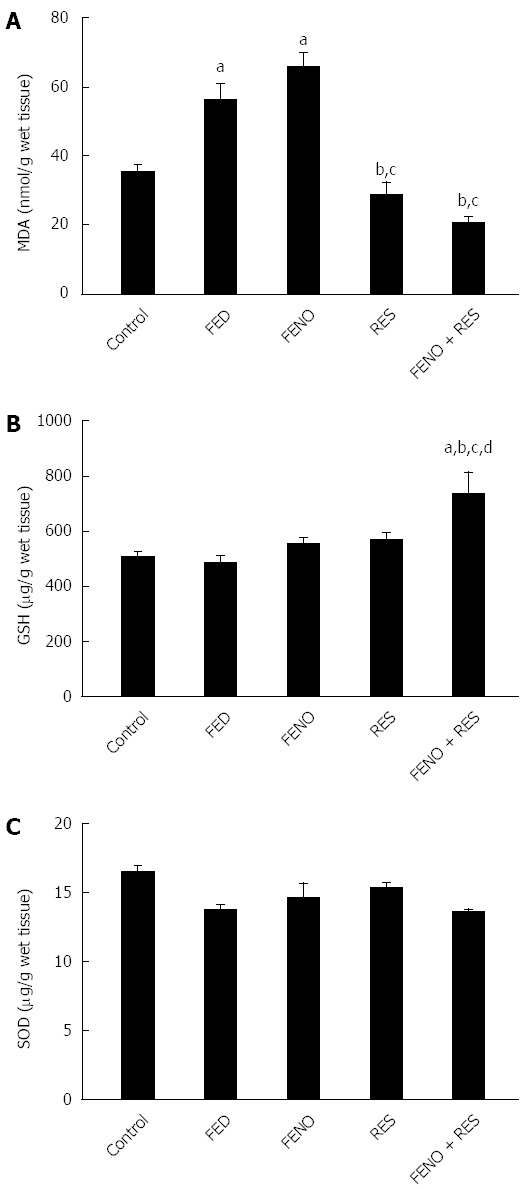
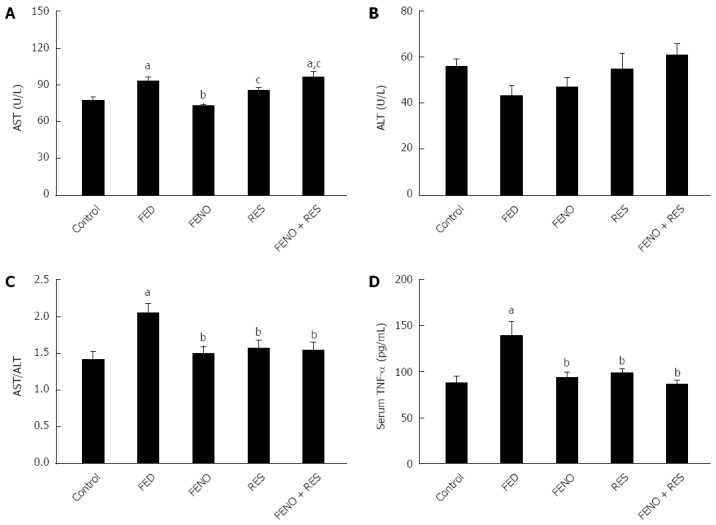
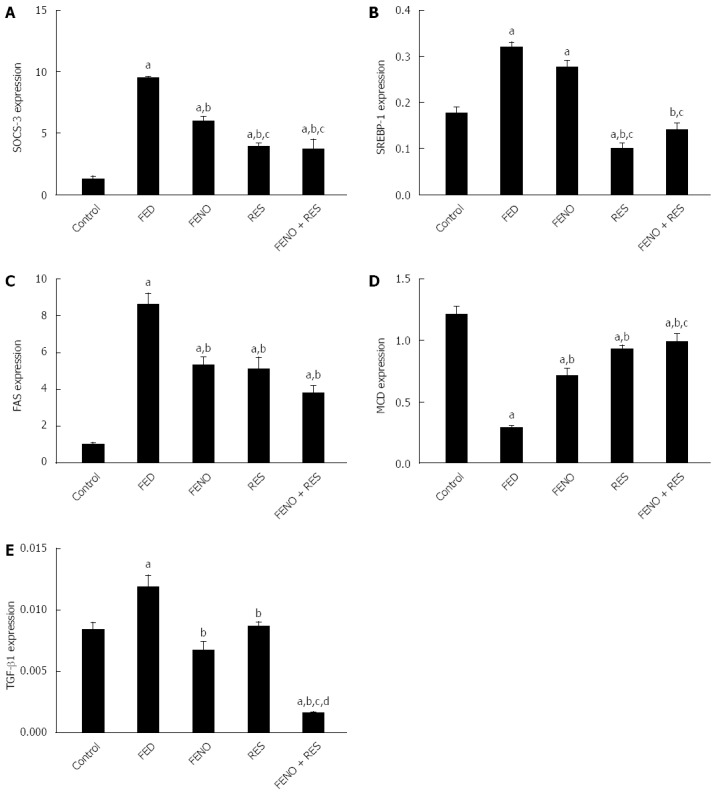
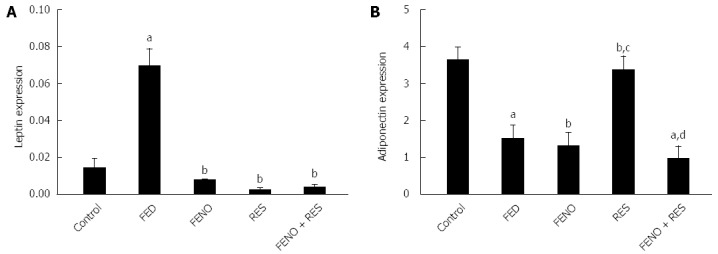
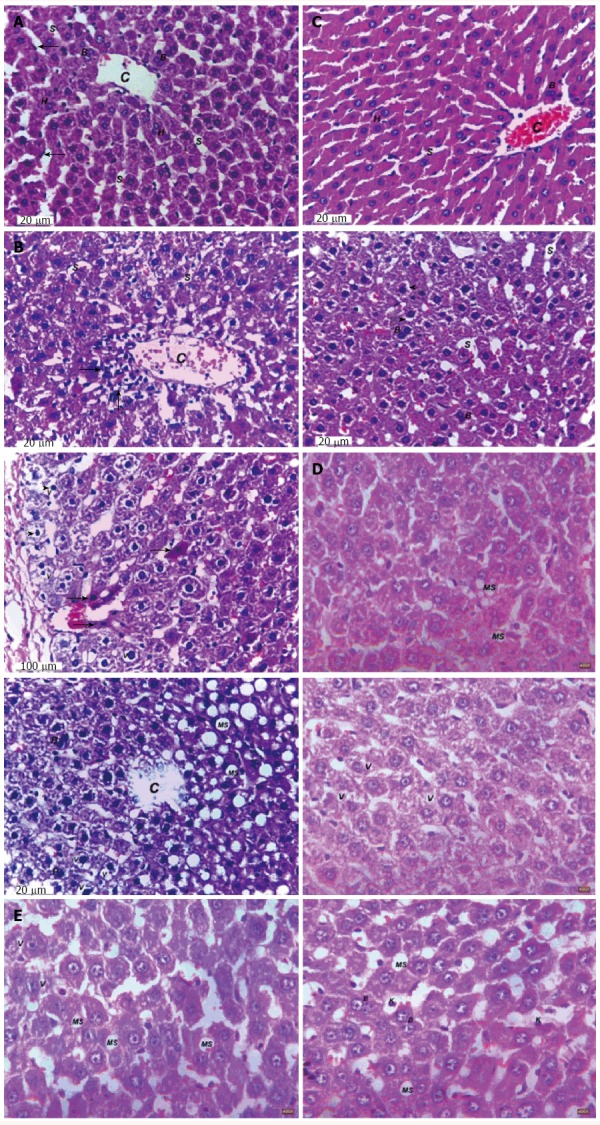
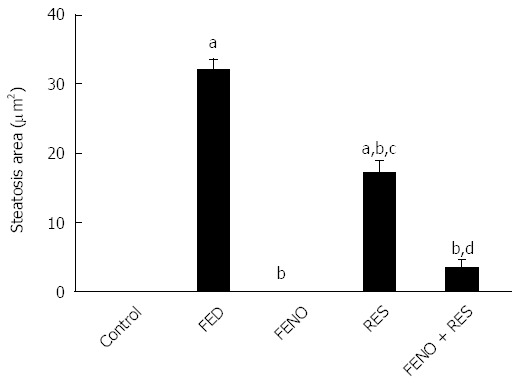
Methods: Giving a fructose-enriched diet (FED) to rats for 12 wk was used as a model for inducing hepatic dyslipidemia and insulin resistance. Adult male albino rats (150-200 g) were divided into a control group and a FED group which was subdivided into 4 groups, a control FED, fenofibrate (FENO) (100 mg/kg), resveratrol (RES) (70 mg/kg) and combined treatment (FENO + RES) (half the doses). All treatments were given orally from the 9(th) week till the end of experimental period. Body weight, oral glucose tolerance test (OGTT), liver index, glucose, insulin, insulin resistance (HOMA), serum and liver triglycerides (TGs), oxidative stress (liver MDA, GSH and SOD), serum AST, ALT, AST/ALT ratio and tumor necrosis factor-α (TNF-α) were measured. Additionally, hepatic gene expression of suppressor of cytokine signaling-3 (SOCS-3), sterol regulatory element binding protein-1c (SREBP-1c), fatty acid synthase (FAS), malonyl CoA decarboxylase (MCD), transforming growth factor-β1 (TGF-β1) and adipose tissue genes expression of leptin and adiponectin were investigated. Liver sections were taken for histopathological examination and steatosis area were determined.
Results: Rats fed FED showed damaged liver, impairment of glucose tolerance, insulin resistance, oxidative stress and dyslipidemia. As for gene expression, there was a change in favor of dyslipidemia and nonalcoholic steatohepatitis (NASH) development. All treatment regimens showed some benefit in reversing the described deviations. Fructose caused deterioration in hepatic gene expression of SOCS-3, SREBP-1c, FAS, MDA and TGF-β1 and in adipose tissue gene expression of leptin and adiponectin. Fructose showed also an increase in body weight, insulin resistance (OGTT, HOMA), serum and liver TGs, hepatic MDA, serum AST, AST/ALT ratio and TNF-α compared to control. All treatments improved SOCS-3, FAS, MCD, TGF-β1 and leptin genes expression while only RES and FENO + RES groups showed an improvement in SREBP-1c expression. Adiponectin gene expression was improved only by RES. A decrease in body weight, HOMA, liver TGs, AST/ALT ratio and TNF-α were observed in all treatment groups. Liver index was increased in FENO and FENO + RES groups. Serum TGs was improved only by FENO treatment. Liver MDA was improved by RES and FENO + RES treatments. FENO + RES group showed an increase in liver GSH content.
Conclusion: When resveratrol was given with half the dose of fenofibrate it improved NASH-related fructose-induced disturbances in gene expression similar to a full dose of fenofibrate.
Keywords: Adiponectin; Fatty acid synthase; Fructose; Leptin; Malonyl CoA decarboxylase; Nonalcoholic steatohepatitis; Sterol regulatory element binding protein-1c; Suppressor of cytokine signaling-3; Transforming growth factor-β; Tumor necrosis factor-α.
Figures
Similar articles
-
Effects of combined PPAR-γ and PPAR-α agonist therapy on fructose induced NASH in rats: Modulation of gene expression.Eur J Pharmacol. 2016 Feb 15;773:59-70. doi: 10.1016/j.ejphar.2016.01.011. Epub 2016 Jan 26. Eur J Pharmacol. 2016. PMID: 26825546
-
Glucagon-like peptide-1 analogue prevents nonalcoholic steatohepatitis in non-obese mice.World J Gastroenterol. 2016 Feb 28;22(8):2512-23. doi: 10.3748/wjg.v22.i8.2512. World J Gastroenterol. 2016. PMID: 26937139 Free PMC article.
-
Modulation of hepatic sterol regulatory element-binding protein-1c-mediated gene expression contributes to Salacia oblonga root-elicited improvement of fructose-induced fatty liver in rats.J Ethnopharmacol. 2013 Dec 12;150(3):1045-52. doi: 10.1016/j.jep.2013.10.020. Epub 2013 Oct 21. J Ethnopharmacol. 2013. PMID: 24157375
-
Effects of Natural Products on Fructose-Induced Nonalcoholic Fatty Liver Disease (NAFLD).Nutrients. 2017 Jan 31;9(2):96. doi: 10.3390/nu9020096. Nutrients. 2017. PMID: 28146130 Free PMC article. Review.
-
Nonalcoholic Fatty Liver Disease and Staging of Hepatic Fibrosis.Adv Exp Med Biol. 2024;1460:539-574. doi: 10.1007/978-3-031-63657-8_18. Adv Exp Med Biol. 2024. PMID: 39287864 Review.
Cited by
-
Daily Intake of Smallanthus sonchifolius (Yacon) Roots Reduces the Progression of Non-alcoholic Fatty Liver in Rats Fed a High Fructose Diet.Plant Foods Hum Nutr. 2022 Dec;77(4):521-528. doi: 10.1007/s11130-022-01009-7. Epub 2022 Sep 1. Plant Foods Hum Nutr. 2022. PMID: 36048356
-
Beneficial Effect of Fenofibrate in Combination with Silymarin on Parameters of Hereditary Hypertriglyceridemia-Induced Disorders in an Animal Model of Metabolic Syndrome.Biomedicines. 2025 Jan 16;13(1):212. doi: 10.3390/biomedicines13010212. Biomedicines. 2025. PMID: 39857794 Free PMC article.
-
The long-term protective effects of neonatal administration of curcumin against nonalcoholic steatohepatitis in high-fructose-fed adolescent rats.Physiol Rep. 2019 Mar;7(6):e14032. doi: 10.14814/phy2.14032. Physiol Rep. 2019. PMID: 30912307 Free PMC article.
-
Potential Relationship between the Changes in Circulating microRNAs and the Improvement in Glycaemic Control Induced by Grape Pomace Supplementation.Foods. 2021 Sep 1;10(9):2059. doi: 10.3390/foods10092059. Foods. 2021. PMID: 34574169 Free PMC article.
-
The transcription factors CREBH, PPARa, and FOXO1 as critical hepatic mediators of diet-induced metabolic dysregulation.J Nutr Biochem. 2021 Sep;95:108633. doi: 10.1016/j.jnutbio.2021.108633. Epub 2021 Mar 28. J Nutr Biochem. 2021. PMID: 33789150 Free PMC article. Review.
References
-
- LaBrecque DR, Abbas Z, Anania F, Ferenci P, Khan AG, Goh KL, Hamid SS, Isakov V, Lizarzabal M, Peñaranda MM, et al. World Gastroenterology Organisation global guidelines: Nonalcoholic fatty liver disease and nonalcoholic steatohepatitis. J Clin Gastroenterol. 2014;48:467–473. - PubMed
-
- Farrell GC, Larter CZ. Nonalcoholic fatty liver disease: from steatosis to cirrhosis. Hepatology. 2006;43:S99–S112. - PubMed
-
- Emanuelli B, Peraldi P, Filloux C, Chavey C, Freidinger K, Hilton DJ, Hotamisligil GS, Van Obberghen E. SOCS-3 inhibits insulin signaling and is up-regulated in response to tumor necrosis factor-alpha in the adipose tissue of obese mice. J Biol Chem. 2001;276:47944–47949. - PubMed
-
- Ueki K, Kadowaki T, Kahn CR. Role of suppressors of cytokine signaling SOCS-1 and SOCS-3 in hepatic steatosis and the metabolic syndrome. Hepatol Res. 2005;33:185–192. - PubMed
MeSH terms
Substances
LinkOut - more resources
Full Text Sources
Other Literature Sources
Medical
Research Materials
Miscellaneous
