

Predicting liver metastasis of gastrointestinal tract cancer by diffusion-weighted imaging of apparent diffusion coefficient values
- PMID: 26973399
- PMCID: PMC4779926
- DOI: 10.3748/wjg.v22.i10.3031
Predicting liver metastasis of gastrointestinal tract cancer by diffusion-weighted imaging of apparent diffusion coefficient values
Abstract
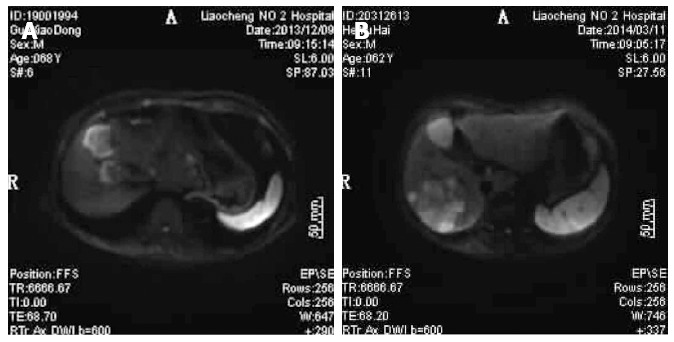
Aim: To determine if efficacy of chemotherapy on liver metastasis of gastrointestinal tract cancer can be predicted by apparent diffusion coefficient (ADC) values of diffusion-weighted imaging (DWI).
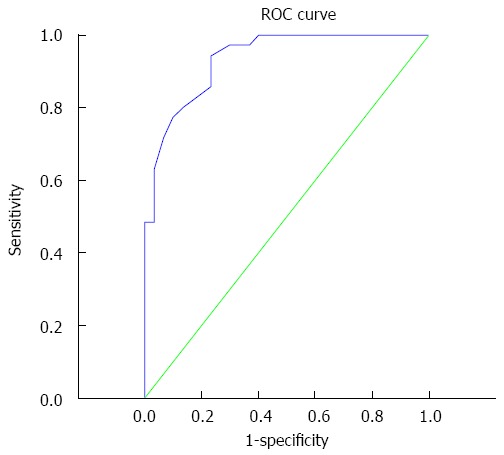
Methods: In total, 86 patients with liver metastasis of gastrointestinal tract cancer (156 metastatic lesions) diagnosed in our hospital were included in this study. The maximum diameters of these tumors were compared with each other before treatment, 2 wk after treatment, and 12 wk after treatment. Selected patients were classified as the effective group and the ineffective group, depending on the maximum diameter of the tumor after 12 wk of treatment; and the ADC values at different treatment times between the two groups were compared. Spearman rank correlation was used to analyze the relationship between ADC value and tumor diameter. Receiver operating characteristic curve (ROC curve) was used to analyze the ADC values before treatment to predict the patient's sensitivity and specificity degree of efficacy to the chemotherapy.
Results: There was no difference in age between the two groups and in maximum tumor diameter before treatment and 2 wk after treatment. However, after 12 wk of treatment, maximum tumor diameter in the effective group was significantly lower than that in the ineffective group (P < 0.05). Before treatment, ADC values in the ineffective group were significantly higher than those in the effective group (P < 0.05). There was no difference in ADC values between the effective and ineffective groups after 2 and 12 wk of treatment. However, ADC values were significantly higher after 2 and 12 wk of treatment compared to before treatment in the effective group (P < 0.05). Spearman rank correlation analysis showed that ADC value before treatment and the reduced percentage of the maximum tumor diameter after 12 wk of treatment were negatively correlated, while the increase in the percentage of the ADC value 12 wk after treatment and the decrease in the percentage of the maximum tumor diameter were significantly positively correlated. The results of the ROC curve showed that ADC value with a chemotherapy ineffective threshold value of 1.14 × 10(-3) mm(2)/s before treatment had a sensitivity and specificity of 94.3% and 76.7%, respectively.
Conclusion: DWI ADC values can be used to predict the response of patients with liver metastasis of gastrointestinal tract cancer to chemotherapy with high sensitivity and relatively high specificity.
Keywords: Chemotherapy; Gastrointestinal tract cancer; Liver metastatic tumor; Magnetic resonance imaging.
Figures
References
-
- Schüle S, Altendorf-Hofmann A, Dittmar Y, Rauchfuß F, Settmacher U. [Incidence of non-metastatic liver lesions in tumor patients: consequences for chemotherapy and local ablative procedures] Chirurg. 2014;85:806–811. - PubMed
-
- Levic K, Bulut O, Hesselfeldt P. Transanal endoscopic microsurgery for giant polyps of the rectum. Tech Coloproctol. 2014;18:521–527. - PubMed
-
- Lambertz A, Klink CD, Röth A, Schmitz D, Pich A, Feher K, Bremus-Köbberling E, Neumann UP, Junge K. Laser-induced drug release for local tumor control--a proof of concept. J Surg Res. 2014;192:312–316. - PubMed
-
- Gourtsoyianni S, Goh V. MRI of anal cancer: assessing response to definitive chemoradiotherapy. Abdom Imaging. 2014;39:2–17. - PubMed
Publication types
MeSH terms
Substances
LinkOut - more resources
Full Text Sources
Other Literature Sources
Medical
