

doi: 10.1146/annurev-vision-082114-035357.
Epub 2015 Oct 14.
Adaptive optics ophthalmoscopy
Affiliations
- PMID: 26973867
- PMCID: PMC4786023
- DOI: 10.1146/annurev-vision-082114-035357
Item in Clipboard
Adaptive optics ophthalmoscopy
Annu Rev Vis Sci.
2015 Nov.
Abstract
This review starts with a brief history and description of adaptive optics (AO) technology, followed by a showcase of the latest capabilities of AO systems for imaging the human retina and an extensive review of the literature on where AO is being used clinically. The review concludes with a discussion on future directions and guidance on usage and interpretation of images from AO systems for the eye.
Keywords: adaptive optics; fundus camera; ophthalmoscopy; retina; scanning laser ophthalmoscopy.
Figures
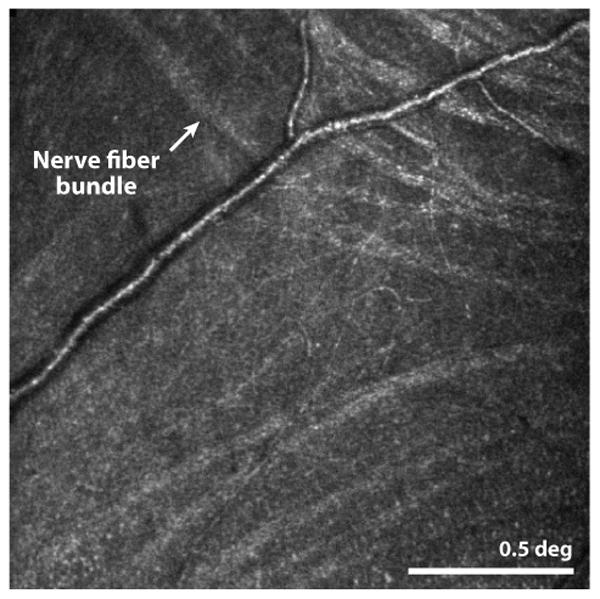
(Huang et al 2014) This confocal AOSLO image shows the location where nerve fiber bundles originate temporal to the fovea. The line separating bundles that traverse above and below the fovea is the called the temporal raphe. In the original paper, the authors carefully map its location relative to the fovea and optic disk and show individual variability and changes with age. Scale bar is 0.5 deg.
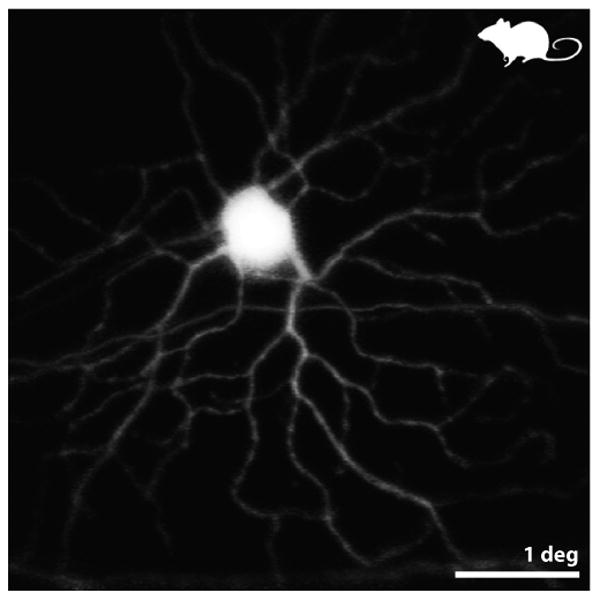
from (Geng et al 2012) Fluorescence AOSLO images of the retina of a living mouse expressing YFP in a fraction of its GCs. This pair of images shows a monostratified ON GC. ON or OFF types were identified by resolving – through confocal optical sectioning – the sublamina of the dendrites within the inner plexiform layer. Scale bar is 1 deg (∼ 30 microns).
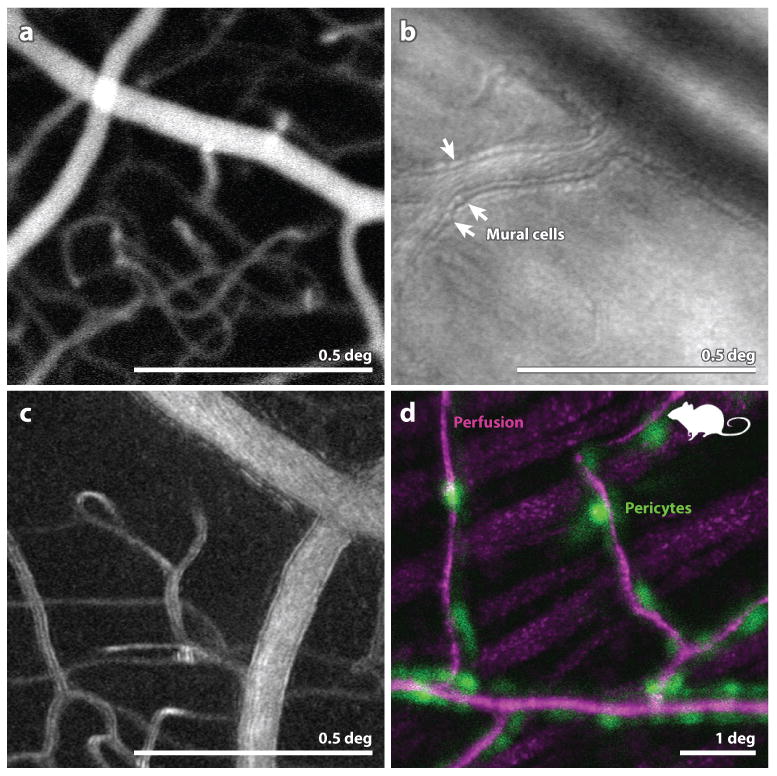
(A) (from (Pinhas et al 2013)) Fluorescein angiography with AOSLO. This particular implementation employed oral fluorescein, offering a longer time course for imaging and avoiding risks associated with injection. The use of AOSLO offers higher contrast and higher resolution over conventional FA. (B) from (Chui et al 2013) Image of the microvascular structure using offset-pinhole AOSLO. Arrowheads point to purported individual mural cells comprising the arteriole walls. (C) from (Sulai et al 2014) Motion contrast image from split-detector AOSLO recordings of a vessel and capillary network in a normal eye. The scale bar is 0.5 deg and applies to panels (A) (B) and (C). (D): from (Schallek et al 2013) A combination of confocal AOSLO motion contrast of perfusion (magenta) and fluorescent AOSLO images of tagged pericytes (green) in a mouse retina reveals the colocation of these structures. Scale bar is 1 deg.
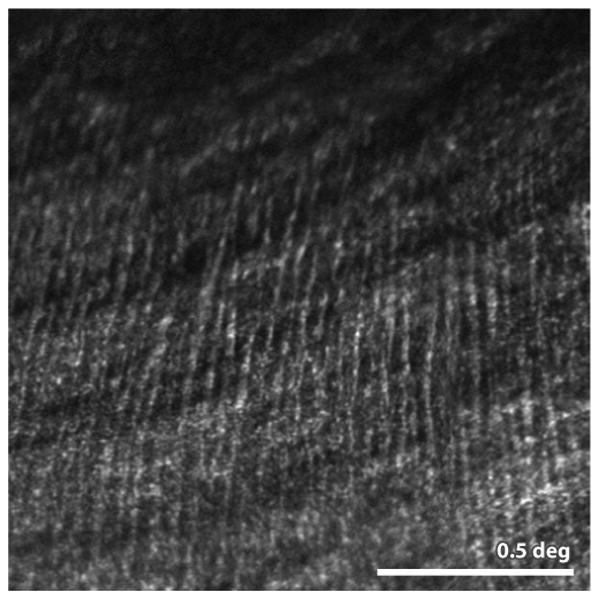
(Scoles et al 2014a) Confocal AOSLO image of a patients with Best's disease. Purported Henle fibers are running vertically across most of the image. Larger more horizontally-oriented structures are from the NFL. Scale bar is 0.5 deg.
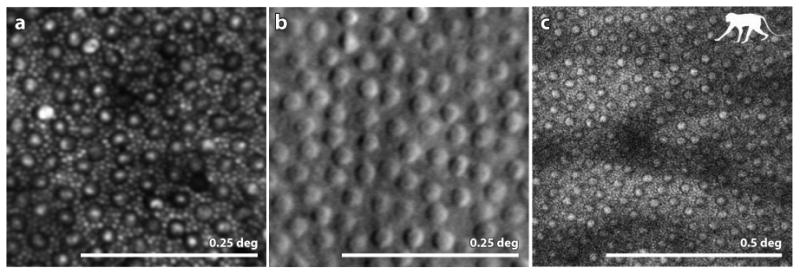
(A) from (Cooper et al 2011): confocal AOSLO image of a healthy human retina showing a complete mosaic of cones (large cells) and rods (intervening smaller cells) at a location 10 deg temporal to the fovea. (B) from (Scoles et al 2014b) Split detector AOSLO image of a healthy human retina showing an array of cone inner segments at a location 10 deg from the fovea. Owing to their small size the rods, which fill the intervening space between the cones at this location, are too small to be resolved. (C) (courtesy of Jennifer Hunter, Robin Sharma and David Williams) 2-photon fluorescence AOSLO image of the retina of a macaque monkey showing the array of inner segments (confirmed by taking a confocal AOSLO image at the same location). The mosaic in the 2-photon image indicates that the fluorophores are contained within each inner segment. Scale bar is 0.25 deg for panels A and B and 0.5 deg for panel C.
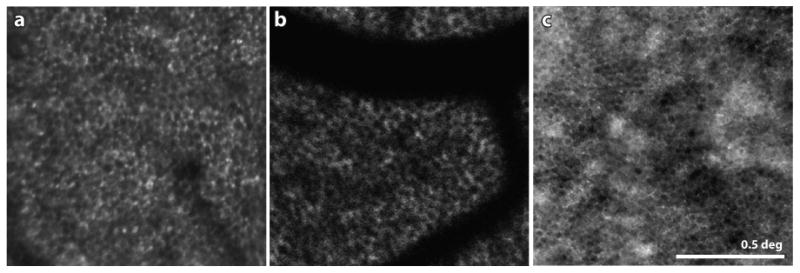
(A) Confocal AOSLO image of the RPE mosaic at a location 3 deg inferior to the fovea in a patient with autosomal dominant RP. The lack of overlying visible or functional photoreceptors in this region allowed the RPE cells to be seen. (B) from (Morgan et al 2009) AOSLO fundus autofluorescence image of a healthy human retina. By resolving the FAF signal, the mosaic of RPE cells is readily visible. The dark shadows in this panel are shadows cast by the overlying blood vessels. The FAF uses short wavelength light in both directions, which is especially susceptible to absorption by the overlying blood vessels (see Sec 5.1 for more discussion). (C) from (Scoles et al 2013) Dark field AOSLO image of a foveal RPE mosaic in a healthy human retina. The same location imaged in confocal AOSLO mode shows a complete mosaic of photoreceptors. Scale bar is 0.5 deg.
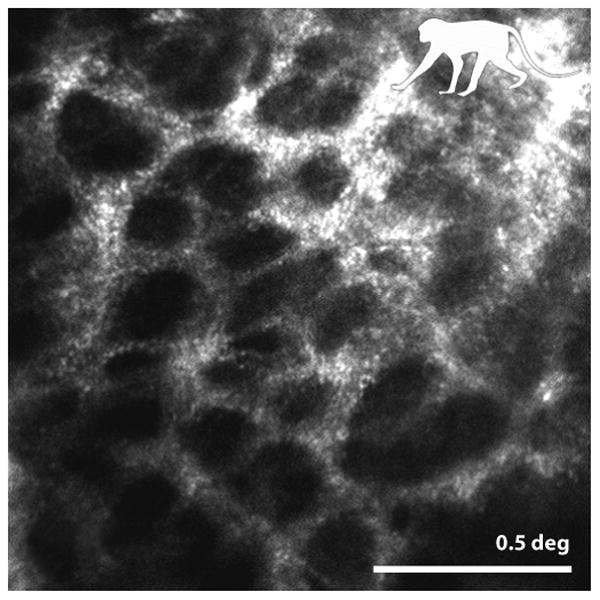
from (Ivers et al 2011) Detailed image of the collagen beams comprising the inner surface of the lamina cribrosa in a non-human primate. Morphometric analysis of LC pore size and pore elongation have been found to be sensitive to change in ocular pressure in animal models. Scale bar is 0.5 deg.
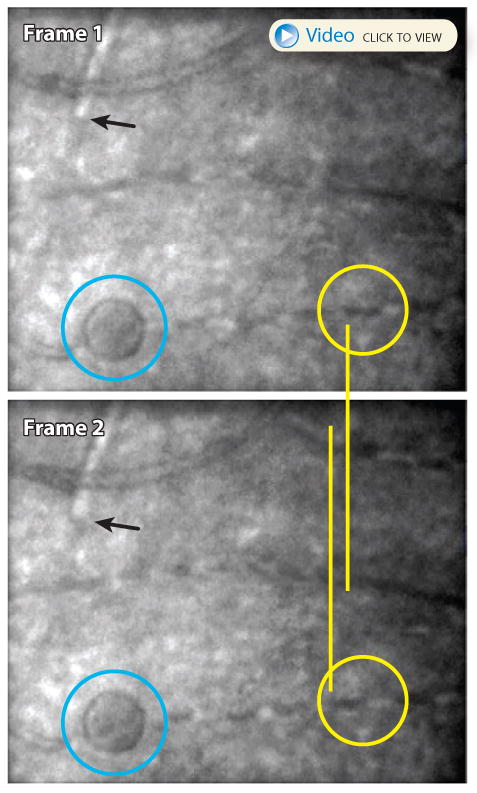
(courtesy of Phil Bedggood and Andrew Metha, University of Melbourne) The upper two panels show two subsequent frames from a 400 fps AO fundus camera video of a patient with type 1 diabetes. One of the hyporeflective red blood cells in frame 1 is circled in yellow. The same cell appears in the next frame displaced to the left. A white blood cell in the upper left of each frame (black pointer) shows similar movement. The blue circle indicates a microcyst which resides in the same plane as the vasculature. The slow-moving blood cells are much better appreciated in the video.
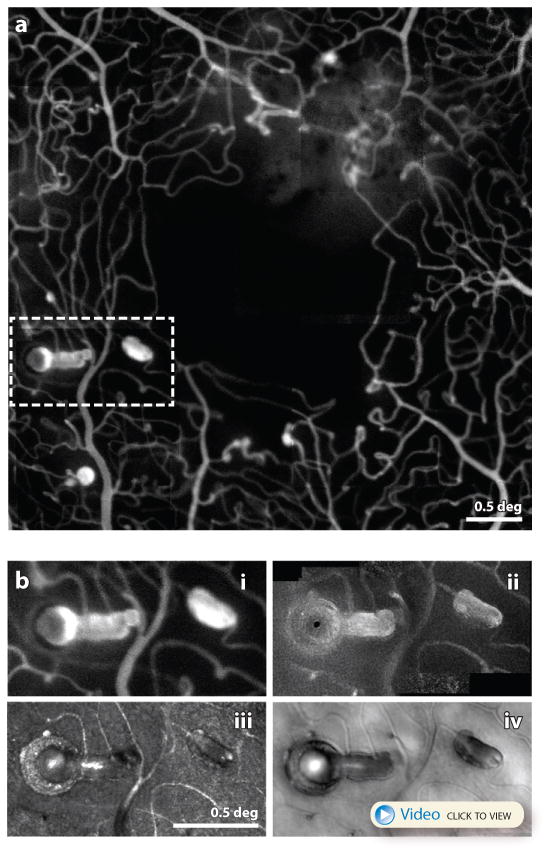
(A) adapted from (Dubow et al 2014) AOSLO fluorescein angiography image of a patient with hypertension. A myriad of microaneurysm types are seen here along with the fine details of the associated microcapillary network. Scale bar is 0.5 deg. (B) from (Chui et al 2014) This figure shows a close up of one location indicated by the dashed white box in (A) imaged using in 4 different modes in the same AOSLO system (B.i) fluorescein angiography (B.ii) confocal (B.iii) motion contrast (B.iv) offset pinhole. A video recorded with offset pinhole AOSLO can be seen here. Collectively they represent the most detailed characterization of single microaneurysm from a human eye in history. Scale bar is 0.5 deg.
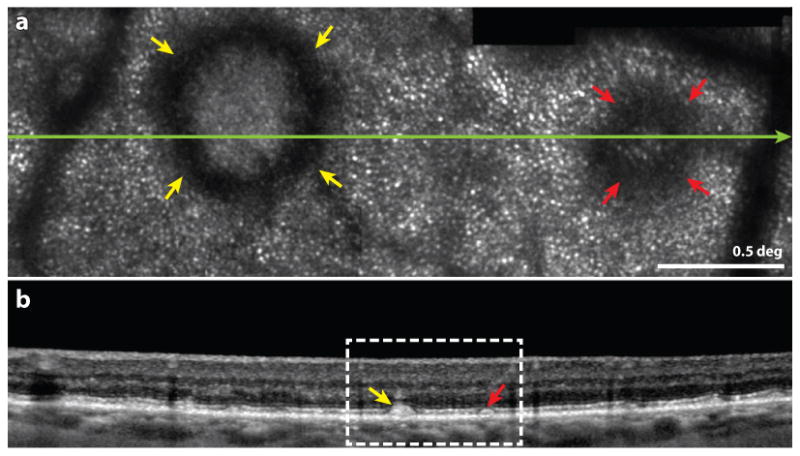
from (Zhang et al 2014) Multimodal imaging of subretinal drusenoid deposits (SDD, or pseudodrusen) in a patient with AMD. Upper frame: Confocal AOSLO image. The yellow and red arrowheads indicate prominent stage 3 and stage 2 SDDs, characterized by a hyporeflective ring and no discernible cones over the SDD. Normal appearing cones are resolved outside of the SDD. The green line indicates the location of the OCT b-scan shown in the lower frame. Scale bar is 0.5 deg. Lower frame: SD-OCT b-scan showing a wider field image of the same structure. The white box indicates the region in the AOSLO image in the upper frame.
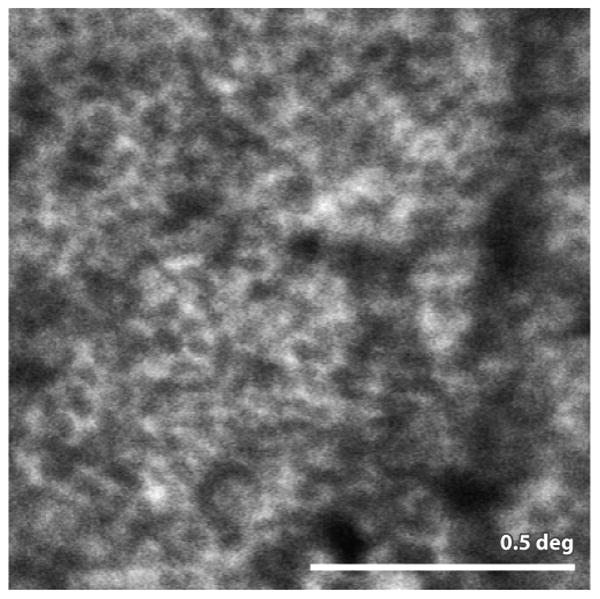
from (Rossi et al 2013) AOSLO autofluorescence image of the RPE mosaic in a patient with AMD. Analysis of this mosaic and other mosaic from AMD patients showed that the RPE regularity is disrupted in this disease. Scale bar is 0.5 deg.
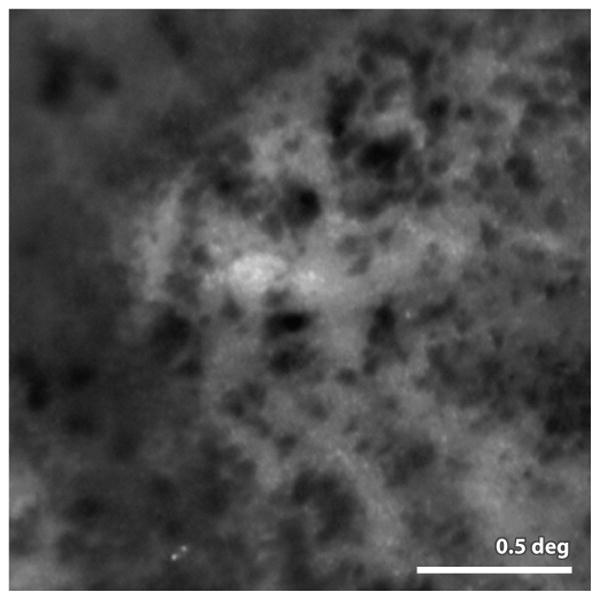
from (Gocho et al 2013) Image of melanin granules taken with an AO fundus camera (rtx1, Imagine Eyes Inc. Orsay France). The granules are readily visible in AMD patients in the vicinity of geographic atrophy (lighter background regions in the image) the authors report that these granules are highly active, appearing and disappearing and moving many microns over the course of weeks. Scale bar 0.5 deg
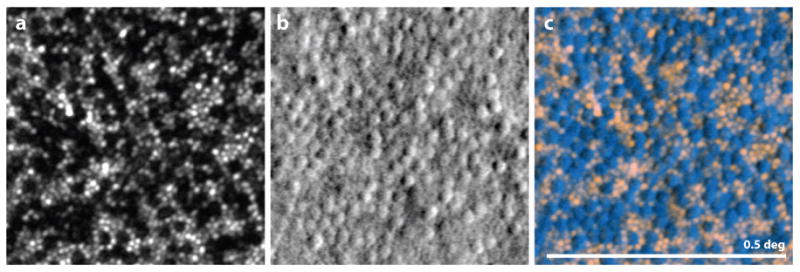
from (Scoles et al 2014b) Image showing the value of split detector imaging for prescreening patients. All images are from the same location of a single patient with achromatopsia. (A) Confocal AOSLO image. Holes are present where the cones might normally reside. The visible spots are from intact, functional rods. (B) Split-detector AOSLO, where a mosaic of structures is present, presumably the inner segments of the cones. (C) Overlay of the confocal image (pink) with the split detector image (blue) revealing that the mosaic of cells corresponds directly with the gaps in the mosaic from the left image. In this case, it appears that although the cones are dysfunctional in this patient, there is a mosaic of inner segments present. It is suggested that patients with this phenotype are most likely to benefit from gene therapy. Scale bar is 0.5 deg.
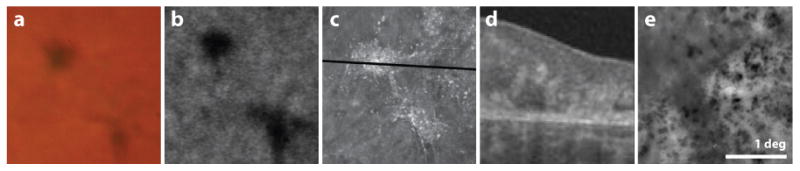
Images of melanin pigment taken using five different imaging modalities. The first four panels show registered images from a single patient with idiopathic macular telangiectasia type 2, the last frame is cropped from Fig. 12. Color fundus photo: pigment appears dark and brownish in color; FAA from Heidelberg Spectralis: pigment appears dark; AOSLO: pigment is hyperreflective in NIR (840 nm); OCT b-scan (scan location indicated in previous panel) pigment is hyper-reflective in NIR (∼840 nm); AO fundus: pigment is hyporeflective. Scale bar is 1 deg.
References
-
- Akagi T, Hangai M, Takayama K, Nonaka A, Ooto S, Yoshimura N. In vivo imaging of lamina cribrosa pores by adaptive optics scanning laser ophthalmoscopy. Invest Ophthalmol Vis Sci. 2012;53:4111–19. - PubMed
-
- Arathorn DW, Yang Q, Vogel CR, Zhang Y, Tiruveedhula P, Roorda A. Retinally Stabilized Cone-Targeted Stimulus Delivery. Optics Express. 2007;15:13731–44. - PubMed
-
- Bainbridge JW, Smith AJ, Barker SS, Robbie S, Henderson R, et al. Effect of gene therapy on visual function in Leber's congenital amaurosis. N Engl J Med. 2008;358:2231–39. - PubMed
-
- Bedggood P, Metha A. Variability in bleach kinetics and amount of photopigment between individual foveal cones. Invest Ophthalmol Vis Sci. 2012b;53:3673–81. - PubMed
Grants and funding
LinkOut - more resources
Full Text Sources
Other Literature Sources
