. 2016 Mar 4;2(3):e1501363.
doi: 10.1126/sciadv.1501363. eCollection 2016 Mar.

Bacterial antisense RNAs are mainly the product of transcriptional noise

Affiliations

Bacterial antisense RNAs are mainly the product of transcriptional noise

Verónica Lloréns-Rico et al. Sci Adv. .

Abstract

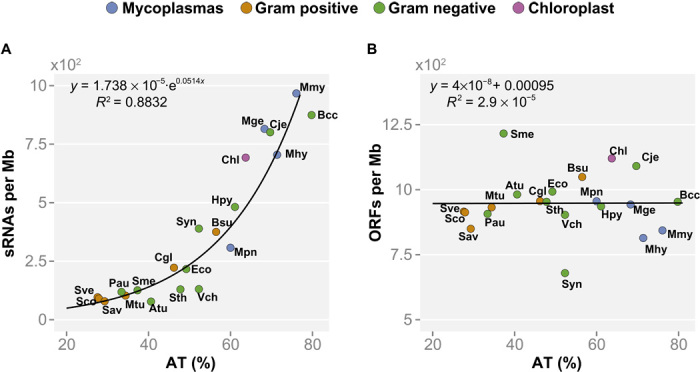
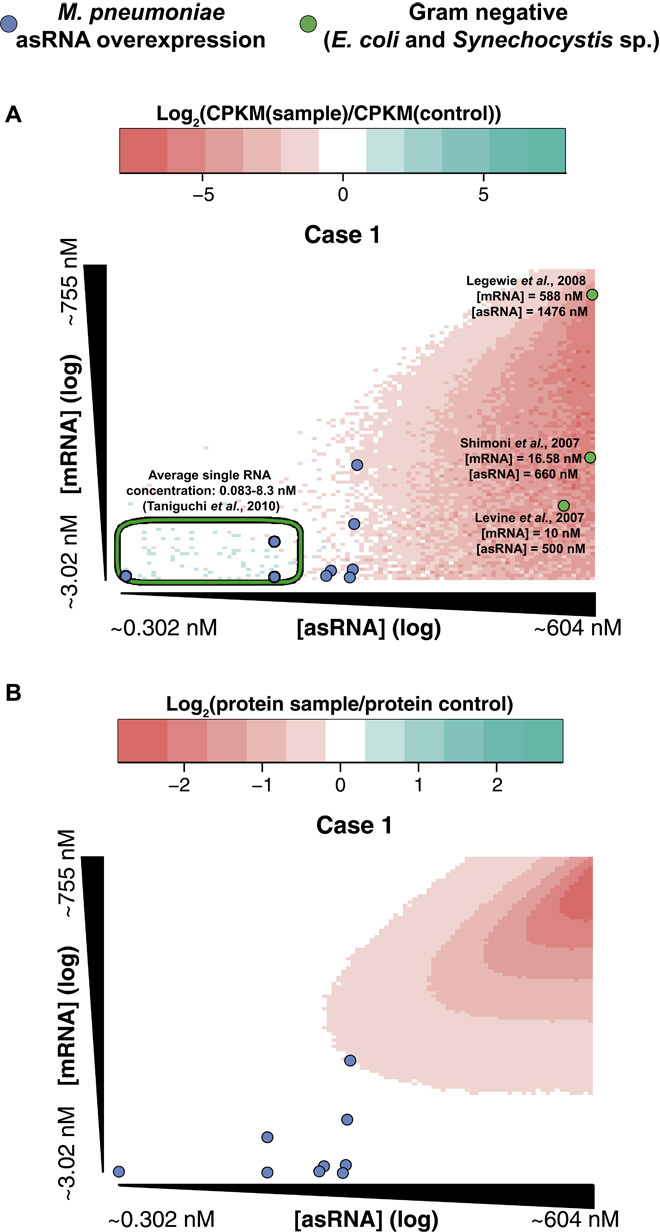
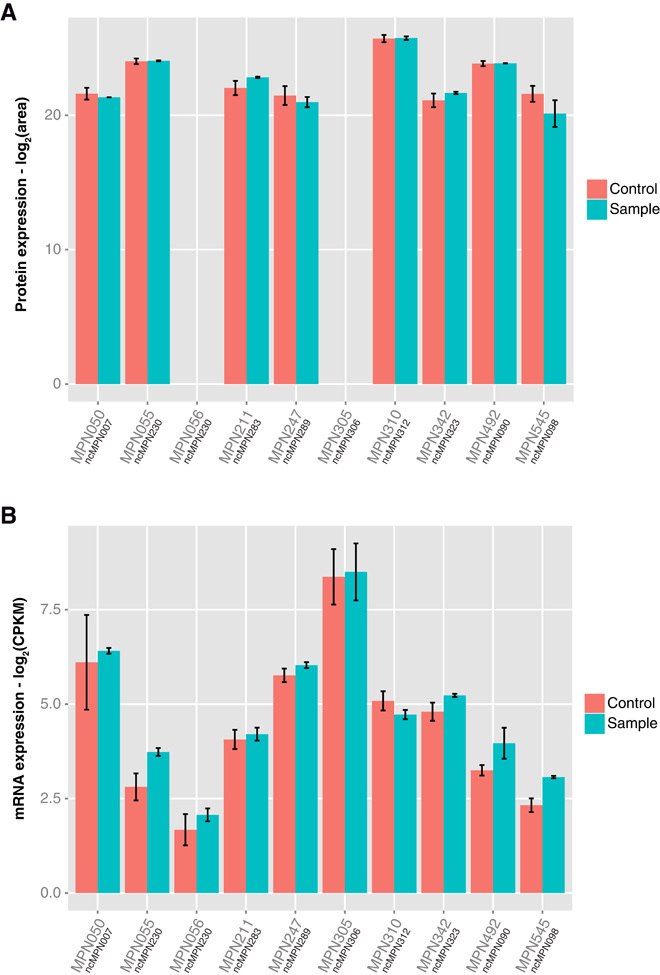
cis-Encoded antisense RNAs (asRNAs) are widespread along bacterial transcriptomes. However, the role of most of these RNAs remains unknown, and there is an ongoing discussion as to what extent these transcripts are the result of transcriptional noise. We show, by comparative transcriptomics of 20 bacterial species and one chloroplast, that the number of asRNAs is exponentially dependent on the genomic AT content and that expression of asRNA at low levels exerts little impact in terms of energy consumption. A transcription model simulating mRNA and asRNA production indicates that the asRNA regulatory effect is only observed above certain expression thresholds, substantially higher than physiological transcript levels. These predictions were verified experimentally by overexpressing nine different asRNAs in Mycoplasma pneumoniae. Our results suggest that most of the antisense transcripts found in bacteria are the consequence of transcriptional noise, arising at spurious promoters throughout the genome.

Keywords: RNA; bacterial antisense RNAs.


Figures

Fig. 1
Fig. 1. Different genomic features show distinct dependency on the genomic AT content.
The number of features was divided by the genome size for normalization and represented versus the genomic AT content. The following genomes are represented: Atu, Agrobacterium tumefaciens; Bcc, Buchnera aphidicola (str Cc); Bsu, Bacillus subtilis; Cgl, Corynebacterium glutamicum; Chl, chloroplast (Arabidopsis thaliana); Cje, Campylobacter jejuni; Eco, Escherichia coli; Hpy, Helicobacter pylori; Mge, Mycoplasma genitalium; Mhy, Mycoplasma hyopneumoniae; Mmy, Mycoplasma mycoides; Mpn, Mycoplasma pneumoniae; Mtu, Mycobacterium tuberculosis; Pau, Pseudomonas aeruginosa; Sav, Streptomyces avermitilis; Sco, Streptomyces coelicolor; Sme, Sinorhizobium meliloti; Sth, Salmonella typhimurium; Sve, Streptomyces venezuelae; Syn, Synechocystis spp., Vch, Vibrio cholerae. (A) Number of total sRNAs in different bacteria. Total sRNAs have an exponential dependency on the AT content (R2 = 0.88) and do not correlate with genome size. (B) Genome compaction (that is, number of ORFs normalized by genome size) versus AT content. Genome compaction in the different bacterial genomes analyzed shows no dependency on the AT content. Instead, the number of ORFs in bacterial genomes correlates with the genome size (R = 0.99).
Fig. 2
Fig. 2. Simulation of the effect of the asRNAs, assuming that the asRNA-mRNA pairing causes duplex degradation.
Parameters for the simulations are detailed in the Supplementary Materials. Each point of the heat maps represents the average change in the protein concentration for 100 simulations of 1000 min each, for specific parameters of asRNA and mRNA transcription rates. The remaining parameters remain constant for all the simulations. The axes represent the mRNA and asRNA concentration in the control experiments for the corresponding transcription rates scanned. (A) Changes in the mRNA concentration after 1000 min of simulation. Blue circles represent experimental data from the overexpression of asRNAs in M. pneumoniae, whereas green circles represent data from studies in Gram-negative bacteria (–31). The green ellipse delimits the region of the concentrations of most transcripts in E. coli (28). (B) Changes in the protein concentration after 1000 min of simulation. Blue circles represent experimental data from the overexpression of asRNAs in M. pneumoniae.
Fig. 3
Fig. 3. Effect of the overexpression of asRNAs in their overlapping genes, measured by RNA-seq and shotgun proteomics.
(A) Protein levels of the genes overlapping each asRNA under control conditions and in the strains transformed with the antisense constructs. Error bars represent the SD of the samples. Two of the proteins, MPN056 and MPN305, were not detected in any of the strains of M. pneumoniae. (B) mRNA levels of the genes overlapping each asRNA under control (wild-type) conditions and in the strains overexpressing the antisense transcripts. Error bars represent the SD of the samples.

References

    1. Altuvia S., Identification of bacterial small non-coding RNAs: Experimental approaches. Curr. Opin. Microbiol. 10, 257–261 (2007). - PubMed
    1. Thomason M. K., Storz G., Bacterial antisense RNAs: How many are there and what are they doing? Annu. Rev. Genet. 44, 167–188 (2010). - PMC - PubMed
    1. Lybecker M., Bilusic I., Raghavan R., Pervasive transcription: Detecting functional RNAs in bacteria. Transcription 5, e944039 (2014). - PMC - PubMed
    1. Wade J. T., Grainger D. C., Pervasive transcription: Illuminating the dark matter of bacterial transcriptomes. Nat. Rev. Microbiol. 12, 647–653 (2014). - PubMed
    1. Raghavan R., Sloan D. B., Ochman H., Antisense transcription is pervasive but rarely conserved in enteric bacteria. mBio 3, e00156-12 (2012). - PMC - PubMed

Publication types