. 2016;1(2):e85841.
doi: 10.1172/jci.insight.85841. Epub 2016 Feb 25.

Glioblastoma-infiltrated innate immune cells resemble M0 macrophage phenotype

Affiliations

Glioblastoma-infiltrated innate immune cells resemble M0 macrophage phenotype

Konrad Gabrusiewicz et al. JCI Insight. 2016.

Abstract

Glioblastomas are highly infiltrated by diverse immune cells, including microglia, macrophages, and myeloid-derived suppressor cells (MDSCs). Understanding the mechanisms by which glioblastoma-associated myeloid cells (GAMs) undergo metamorphosis into tumor-supportive cells, characterizing the heterogeneity of immune cell phenotypes within glioblastoma subtypes, and discovering new targets can help the design of new efficient immunotherapies. In this study, we performed a comprehensive battery of immune phenotyping, whole-genome microarray analysis, and microRNA expression profiling of GAMs with matched blood monocytes, healthy donor monocytes, normal brain microglia, nonpolarized M0 macrophages, and polarized M1, M2a, M2c macrophages. Glioblastoma patients had an elevated number of monocytes relative to healthy donors. Among CD11b+ cells, microglia and MDSCs constituted a higher percentage of GAMs than did macrophages. GAM profiling using flow cytometry studies revealed a continuum between the M1- and M2-like phenotype. Contrary to current dogma, GAMs exhibited distinct immunological functions, with the former aligned close to nonpolarized M0 macrophages.


Figures

Figure 1
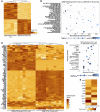
Figure 1. Peripheral monocyte lineage dysregulation in glioblastoma patients.
Numbers of (A) monocytes and (B) myeloid-derived suppressor cells (MDSCs) in blood samples obtained from healthy donors (red circles, n = 57), low-grade (I + II) brain tumor patients (black squares, n = 33), grade III brain tumor patients (blue triangles, n = 30), and glioblastoma (GBM) patients (green triangles, n = 60) were measured using an XN-10 automated analyzer. The data are presented as the mean ± SD. An unpaired t test with Welch’s correction was used to calculate P values. ***P < 0.001; ****P < 0.0001. (C) Gene expression profiles of CD14+ blood cells isolated from GBM patients (n = 4) and healthy blood donors (n = 4), as determined using a microarray. A heat map of 764 differentially expressed genes (472 upregulated and 292 downregulated) is shown. (D) Hallmark biological states or processes enriched in GBM patient CD14+ blood cells relative to healthy donors according to gene set enrichment analysis. The normalized enrichment score, enrichment signal of leading edge gene subset (signal), and false discovery rate (FDR) q values are shown. (E) Canonical pathway activity was predicted using ingenuity pathway analysis. The activation z-score, fraction of genes affected in each pathway, and Fisher’s exact test overlap log-transformed P values are presented. (F) Nanostring digital gene expression profiling of 99 immune system– and cancer-related genes and 5 lncRNAs in GBM CD14+ blood cells (n = 11) and phenotypically matched healthy donor cells (n = 11). A heat map of 41 differentially expressed genes (25 upregulated and 16 downregulated) is shown. An asterisk indicates a GBM blood CD14+ sample clustered with samples obtained from healthy donors.
Figure 2
Figure 2. Characteristics of MDSCs, microglia, and macrophages within glioblastomas.
(A) Representative contour dot plots of CD11b+ cells isolated from resected glioblastoma (GBM) tissue or nonmalignant brain tissue and stained with isotype controls or anti-CD11b and anti-CD45 antibodies to distinguish myeloid-derived suppressor cells (MDSCs) (CD11b+CD45med), microglia (CD11b+CD45low), and macrophages (CD11b+CD45high). (B) Representative histograms for CD11b and CD14 expression in the CD11b+ fraction. (C) Representative histogram overlay for CD14 expression in GBM-infiltrating CD11b+ cells (MDSCs, microglia, and macrophages) relative to isotype control (iso) (gray histogram). The mean fluorescence intensity (MFI) of CD14 expression in MDSCs (blue bar), microglia (red bar), and macrophages (black bar) is shown. (D) Percentages of MDSCs (blue circles), microglia (red squares), and macrophage (black triangles) among CD11b+ cells within 17 resected GBMs. The data are presented as the mean ± SD. A 2-sided paired t test was used to calculate P values. *P < 0.05; **P < 0.01. (E) Percentages of MDSCs (blue), microglia (red), and macrophage (black) among CD11b+ cells within proneural (n = 3), neural (n = 4), classical (n = 6), and mesenchymal (n = 3) GBMs. The data are presented as the mean. A 2-sided t test or paired t test, when appropriate, was used to calculate P values (classical GBM: MDSCs vs. macrophages, P < 0.05; mesenchymal GBM: microglia vs. MDSCs and macrophages, P < 0.05).
Figure 3
Figure 3. Immune phenotype of glioblastoma-infiltrating myeloid-derived suppressor cells, microglia, and macrophages.
Percentage of (A) MHC II, CD80, and CD86; (B) CD163 and CD206; (C) pSTAT1 and pSTAT3 (macrophages vs. microglia, P = 0.051; macrophages vs. myeloid-derived suppressor cells [MDSCs], P = 0.068); and (D) TNF-α, TGF-β1, and IL-10 expression in MDSCs (blue circles), microglia (red squares), and macrophages (black triangles) within 17 resected glioblastomas. The mean fluorescence intensity (MFI) for MHC II, TGF-β1, and IL-10 is shown. The data are presented as the mean ± SD. A 2-sided Wilcoxon signed-rank test was performed to calculate P values. *P < 0.05; **P < 0.01; ***P < 0.001; ****P < 0.0001. Percentages of (E) TNF-α, (F) CD163, and (G) CD206 expression in MDSCs, microglia, and macrophages within proneural (PN; orange circles, n = 3), neural (NE; gray squares, n = 4), classical (CL; green triangles, n = 6), and mesenchymal (MES; purple diamonds, n = 3) glioblastomas. The data are presented as the mean ± SD. For the comparison between subtypes of glioblastoma in E, F, and G, we used 2-sample t test; for comparison between the immune phenotypes by each glioblastoma subtype, we used a paired t test. *P < 0.05.
Figure 4
Figure 4. Gene expression profile of myeloid cells upon interaction with glioblastoma.
(A) Gene expression profile of glioblastoma-infiltrating (GBM-infiltrating) CD14+ cells (n = 4) and matched CD14+ blood cells (n = 4), as determined using a microarray. A heat map of 1,122 differentially expressed genes (584 upregulated and 538 downregulated) is shown. (B) Gene set enrichment analysis of GBM-infiltrating CD14+ cells relative to matched CD14+ blood cells was performed as described for Figure 1. (C) Canonical pathway activity analysis was performed as described for Figure 1. (D) Nanostring digital gene expression profiling in GBM-infiltrating CD14+ cells (n = 11) and matched CD14+ blood cells (n = 11). A heat map of 71 differentially expressed genes (34 upregulated and 37 downregulated) is shown. Gray boxes represent missing values. (E) Heat map of 10 differentially expressed genes in mesenchymal GBM-infiltrating CD14+ cells (n = 4) relative to that in other subtypes (n = 7) and classical GBM-infiltrating CD14+ cells (n = 3) relative to that in other subtypes (n = 8).
Figure 5
Figure 5. miRNA expression profile of myeloid cells upon interaction with glioblastoma.
A heat map of 15 differentially expressed miRNAs (6 upregulated and 9 downregulated) in glioblastoma-infiltrating (GBM-infiltrating) CD14+ cells (n = 7) and matched CD14+ blood cells (n = 7) is shown. miRNA probes targeting two transcripts are indicated with asterisks (see Table 2).
Figure 6
Figure 6. Gene expression profile of glioblastoma-infiltrating myeloid cells.
A heat map of 44 differentially expressed genes (17 upregulated and 27 downregulated) in glioblastoma-infiltrating (GBM-infiltrating) CD14+ cells (n = 11) compared to CD14+ cells isolated from nonmalignant surgical samples (n = 4) and CD11b+ cells from postmortem brains (n = 4) is shown. Gray boxes represent missing values.
Figure 7
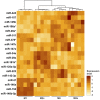
Figure 7. miRNA expression profile of glioblastoma-infiltrating myeloid cells.
A heat map of 12 differentially expressed miRNAs (6 upregulated and 6 downregulated) in glioblastoma-infiltrating (GBM-infiltrating) CD14+ cells (n = 7), CD14+ cells isolated from nonmalignant surgical samples (n = 3), and CD11b+ cells isolated from postmortem brains (n = 4) is shown.
Figure 8
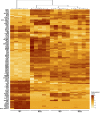
Figure 8. Gene expression profile of nonpolarized and polarized macrophages.
A heat map of 88 differentially expressed genes in M1-, M2a-, and M2c-polarized macrophages relative to nonpolarized M0 macrophages is shown. From each buffy coat (n = 5) all 4 subpopulations of macrophages were established.
Figure 9
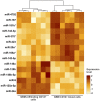
Figure 9. miRNA expression profile of nonpolarized and polarized macrophages.
A heat map of 19 differentially expressed miRNAs in nonpolarized M0, M1-, M2a-, and M2c-polarized macrophages is shown. From each buffy coat (n = 5) all 4 subpopulations of macrophages were established. miRNA probes targeting two transcripts are indicated by asterisks (see Table 2).
Figure 10
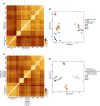
Figure 10. Expression profiles of glioblastoma-infiltrating CD14+ monocyte lineage cells align with nonpolarized M0 macrophages.
Unsupervised analysis of Nanostring gene expression profiles in glioblastoma (GBM) CD14+ cells obtained from blood and resected tissue and cultured macrophages by (A) hierarchical clustering and (B) principal coordinate analysis. Nonpolarized M0 macrophages (n = 5), M1 macrophages (n = 5), M2a macrophages (n = 5), M2c macrophages (n = 5), GBM patient CD14+ blood cells (n = 11), GBM-infiltrating CD14+ cells (n = 11). (C) Hierarchical clustering and (D) principal coordinate analysis of expression profiles in healthy donor CD14+ blood cells and normal brain microglia and cultured macrophages. Nonpolarized M0 macrophages (n = 5), M1 macrophages (n = 5), M2a macrophages (n = 5), M2c macrophages (n = 5), healthy donor CD14+ blood cells (n = 14), microglia from nonmalignant and postmortem brain tissue (n = 8).

References

    1. Badie B, Schartner JM. Flow cytometric characterization of tumor-associated macrophages in experimental gliomas. Neurosurgery. 2000;46(4):957–961. - PubMed
    1. Kettenmann H, Hanisch UK, Noda M, Verkhratsky A. Physiology of microglia. Physiol Rev. 2011;91(2):461–553. doi: 10.1152/physrev.00011.2010. - DOI - PubMed
    1. Roggendorf W, Strupp S, Paulus W. Distribution and characterization of microglia/macrophages in human brain tumors. Acta Neuropathol (Berl) 1996;92(3):288–293. doi: 10.1007/s004010050520. - DOI - PubMed
    1. Morimura T, et al. Monocyte subpopulations in human gliomas: expression of Fc and complement receptors and correlation with tumor proliferation. Acta Neuropathol (Berl) 1990;80(3):287–294. doi: 10.1007/BF00294647. - DOI - PubMed
    1. Wierzba-Bobrowicz T, Kuchna I, Matyja E. Reaction of microglial cells in human astrocytomas (preliminary report) Folia Neuropathol. 1994;32(4):251–252. - PubMed