. 2016 Mar 14;11(3):e0150022.
doi: 10.1371/journal.pone.0150022. eCollection 2016.

Multilocus Phylogeography and Species Delimitation in the Cumberland Plateau Salamander, Plethodon kentucki: Incongruence among Data Sets and Methods

Affiliations

Multilocus Phylogeography and Species Delimitation in the Cumberland Plateau Salamander, Plethodon kentucki: Incongruence among Data Sets and Methods

Shawn R Kuchta et al. PLoS One. .

Abstract

Species are a fundamental unit of biodiversity, yet can be challenging to delimit objectively. This is particularly true of species complexes characterized by high levels of population genetic structure, hybridization between genetic groups, isolation by distance, and limited phenotypic variation. Previous work on the Cumberland Plateau Salamander, Plethodon kentucki, suggested that it might constitute a species complex despite occupying a relatively small geographic range. To examine this hypothesis, we sampled 135 individuals from 43 populations, and used four mitochondrial loci and five nuclear loci (5693 base pairs) to quantify phylogeographic structure and probe for cryptic species diversity. Rates of evolution for each locus were inferred using the multidistribute package, and time calibrated gene trees and species trees were inferred using BEAST 2 and *BEAST 2, respectively. Because the parameter space relevant for species delimitation is large and complex, and all methods make simplifying assumptions that may lead them to fail, we conducted an array of analyses. Our assumption was that strongly supported species would be congruent across methods. Putative species were first delimited using a Bayesian implementation of the GMYC model (bGMYC), Geneland, and Brownie. We then validated these species using the genealogical sorting index and BPP. We found substantial phylogeographic diversity using mtDNA, including four divergent clades and an inferred common ancestor at 14.9 myr (95% HPD: 10.8-19.7 myr). By contrast, this diversity was not corroborated by nuclear sequence data, which exhibited low levels of variation and weak phylogeographic structure. Species trees estimated a far younger root than did the mtDNA data, closer to 1.0 myr old. Mutually exclusive putative species were identified by the different approaches. Possible causes of data set discordance, and the problem of species delimitation in complexes with high levels of population structure and introgressive hybridization, are discussed.


Conflict of interest statement

Competing Interests: The authors have declared that no competing interests exist.

Figures

Fig 1
Fig 1. Map of the range of Plethodon kentucki.
Sample localities are numbered, and match Fig 3 and S1 Appendix. Symbols identify the mtDNA clade of individuals in that population (Fig 3).
Fig 2
Fig 2. Box plot depicting the estimated rates of evolution of each study locus.
Each box plot contains the estimates of evolutionary rate at each node and tip of the tree. The bottom and top of the box delimit the first and third quartiles, respectively, and whiskers extend to a maximum of 1.5 times the interquartile range. Asterisks indicate outlier points.
Fig 3
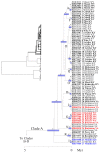
Fig 3. Bayesian maximum clade credibility tree.
This phylogeny was inferred using concatenated mtDNA data (Cyt-b, ND2, tRNAtrp, tRNAala). Taxon labels include specimen identification number, the population numbers from Fig 1, and county plus state information. Numbers adjacent to nodes are posterior probabilities (pp), and asterisks identify nodes with pp ≥ 0.95. Bars indicate 95% confidence intervals (CI) for dates of nodes. For visual clarity, many pp values and CI bars were removed near the tips of the tree. Specimens in the "complete" data set, which includes five nuclear loci in addition to mtDNA, are highlighted in bold. The bGMYC analysis delimited either 17 putative species, or two putative species, depending on the probability threshold employed (see text). The 17 putative species are identified using the letters (A-Q) adjacent to nodes; the two putative species are represented by Clade A, and Clades B-C. Finally, three putative species delimited in the Geneland analysis are highlighted using colored text that is either black (species A), red (species B), or blue (species C). Clade A is here illustrated. The entire phylogeny is illustrated in the upper left, with Clade A illustrated using bold lines. See Fig 4 for Clades B-D.
Fig 4
Fig 4. Bayesian maximum clade credibility tree.
As with Fig 3, but showing relationships within Clades B-D.
Fig 5
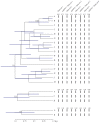
Fig 5. bGMYC analyses.
To the left is the maximum clade credibility tree from BEAST 2 (Figs 3 and 4). The table is a sequence-by-sequence matrix, with cells colored by the posterior probability that the corresponding sequences are conspecific. Off-diagonal colors indicate uncertainty due to uncertainty in topology.
Fig 6
Fig 6. Geneland results, with grouping inferred from nuclear loci.
The three colors correspond to the three groups inferred by Geneland. The dots are the collecting localities (see Fig 1), and are colored by clade: white = Clade A; blue = Clade B; red = Clade C; black = Clade D. The histogram shows the log of the ratio of the estimates rates of coalescence and the estimated Yule rates. Values above zero indicate the estimated rate of coalescence is higher.
Fig 7
Fig 7. Maximum clade credibility trees from *BEAST 2, with species delimitations from BPP.
Numbers at tree nodes are posterior probabilities; numbers <0.95 have been omitted. Bars at nodes represent the 95% highest posterior density for the inferred ages of nodes. To the right, bars connect putative species that were combined in the BPP analyses. (A) 16 species as delimited by bGMYC, using mtDNA data; (B) 3 species as delimited by Geneland, using the nuclear data; (4) 2 species as delimited by bGMYC, using mtDNA data. See also Fig 3 for species delimitations.
Fig 8
Fig 8. Multidimensional scaling of Nei's genetic distances.
Genetic data from Highton and MacGregor (1983). Populations numbers match Fig 1.

Similar articles

Cited by

References

    1. Sites JW, Marshall JC. Delimiting species: a renaissance issue in systematic biology. Trends Ecol Evol. 2003; 18: 462–470. 10.1016/S0169-5347(03)00184-8 - DOI
    1. Sites JW, Marshall JC. Operational criteria for delimiting species. Ann Rev Ecol Evol Syst. 2004; 35: 199–227. 10.1146/annurev.ecolsys.35.112202.130128 - DOI
    1. Kuchta S, Wake DB. Wherefore and wither the ring species? Copeia 2016; In press.
    1. de Queiroz K. Species concepts and species delimitation. Syst Biol. 2007; 56: 879–886. 10.1080/10635150701701083 - DOI - PubMed
    1. Camargo A, Sites JW. Species delimitation: a decade after the renaissance In: Pavlinov IY, editor. The Species Problem: Ongoing Issues. InTech—Open Access publisher, Rijeka, Croatia; 2013. 10.5772/52664 - DOI

Substances

LinkOut - more resources