. 2016 Apr 1;126(4):1495-511.
doi: 10.1172/JCI80046. Epub 2016 Mar 14.

RNA-binding protein IGF2BP3 targeting of oncogenic transcripts promotes hematopoietic progenitor proliferation

RNA-binding protein IGF2BP3 targeting of oncogenic transcripts promotes hematopoietic progenitor proliferation

Jayanth Kumar Palanichamy et al. J Clin Invest. .

Abstract

Posttranscriptional control of gene expression is important for defining both normal and pathological cellular phenotypes. In vitro, RNA-binding proteins (RBPs) have recently been shown to play important roles in posttranscriptional regulation; however, the contribution of RBPs to cell specification is not well understood. Here, we determined that the RBP insulin-like growth factor 2 mRNA-binding protein 3 (IGF2BP3) is specifically overexpressed in mixed lineage leukemia-rearranged (MLL-rearranged) B-acute lymphoblastic leukemia (B-ALL), which constitutes a subtype of this malignancy associated with poor prognosis and high risk of relapse. IGF2BP3 was required for the survival of B-ALL cell lines, as knockdown led to decreased proliferation and increased apoptosis. Enforced expression of IGF2BP3 provided murine BM cells with a strong survival advantage, led to proliferation of hematopoietic stem and progenitor cells, and skewed hematopoietic development to the B cell/myeloid lineage. Cross-link immunoprecipitation and high throughput sequencing uncovered the IGF2BP3-regulated transcriptome, which includes oncogenes MYC and CDK6 as direct targets. IGF2BP3 regulated transcripts via targeting elements within 3' untranslated regions (3'UTR), and enforced IGF2BP3 expression in mice resulted in enhanced expression of Myc and Cdk6 in BM. Together, our data suggest that IGF2BP3-mediated targeting of oncogenic transcripts may represent a critical pathogenetic mechanism in MLL-rearranged B-ALL and support IGF2BP3 and its cognate RNA-binding partners as potential therapeutic targets in this disease.


Figures
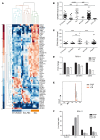
Figure 1
Figure 1. IGF2BP3 is overexpressed in MLL-translocated B-ALL.
(A) Heatmap from the microarray data showing differentially expressed RBPs between B-ALL. IGF2BP3 is highly expressed in MLL-rearranged B-ALL. (B and C) qPCR-based confirmation of overexpression of IGF2BP3 (B) and its previously defined target, CD44 (C), in MLL-rearranged B-ALL (total n = 134; one-way ANOVA followed by Bonferroni’s multiple comparisons test; **P < 0.01, ***P < 0.001, ****P < 0.0001). (DF) Treatment of RS4;11 cell line with increasing doses of I-BET151. (D) qPCR of MYC, CDK6, and IGF2BP3 levels in RS4;11 cells shows a significant decrease in all 3 mRNA levels (t test MYC, P = 0.04, P = 0.06; IGF2BP3, P < 0.0001, P = 0.1; CDK6, P = 0.005, P = 0.004; 1 μM and 2 μM, respectively). (E and F) Cell cycle analysis by propidium iodide staining after I-BET151 treatment of RS4;11 cells shows G1 arrest secondary to CDK6 inhibition. Experiments were conducted 3× for validation. qPCR assays were normalized to actin (B and C) and RNA Pol II (D). Data represent mean ±SD. See also Supplemental Figure 1.
Figure 2
Figure 2. IGF2BP3 knockdown leads to disruptions of cell growth and increased apoptosis.
(A) IGF2BP3 expression in human B-ALL cell lines. (B) Schematic of lentiviral vector used for IGF2BP3 knockdown. (C) IGF2BP3 knockdown, measured by qPCR shown in RS4;11 cell line (t test; ***P = 0.0005). (D) Cell cycle analysis with propidium iodide staining. (E) MTS assay showing significantly reduced cell proliferation with IGF2BP3 knockdown. (F) Western blot showing IGF2BP3 expression after CRISPR-Cas9–mediated targeting using the Cr1 or Cr2 constructs. Cr1-mediated targeting results in some residual protein. β-Actin is used as a loading control. (G) MTS assay showing significantly reduced cell proliferation after Cr2 targeting (t test; **P ≤ 0.01 for all marked comparisons). (H) Cell cycle analysis by propidium iodide staining showing increased cell death (sub-G1 peak) in Cr2-expressing cells. (I) Increased annexin V staining in Cr2-targeted cells with IGF2BP3 KO. I3, IGF2BP3. Experiments were conducted 3× for validation. Data represent mean ±SD. See also Supplemental Figure 2. UbC, ubiquitin C promoter; Puro, puromycin; LC, lentiCRISPR control.
Figure 3
Figure 3. Enforced expression of IGF2BP3 leads to enhanced engraftment and skewing toward B cell/myeloid development.
(A) Schematic of the bicistronic vector used for enforced expression of IGF2BP3. (B) Western blot showing overexpression of IGF2BP3 in the murine pre–B cell line, 7OZ/3, and the human embryonic kidney cell line, 293T. (C) qPCR showing overexpression in 7OZ/3 at the mRNA level (t test; **P = 0.0013). (D) FACS analysis of PB from mice 6 weeks after BMT showing successful engraftment and transduction (GFP+). (E) FACS of PB done at 4 weeks after BMT, showing CD45.2 and GFP positivity (one-way ANOVA followed by Bonferroni’s test; ****P < 0.0001). (F) Quantitation of GFP expression in the PB between 4 and 16 weeks after transplant shows that the effect is marked and sustained. (G) PB leukocyte counts at 16 weeks show increased leukocytes (one-way ANOVA with Bonferroni’s test; ***P < 0.001). (H and I) Significantly higher numbers of B220+ cells (H) and CD11b+ cells (I) in PB (one-way ANOVA with Bonferroni’s test; ***P < 0.001). (J) FACS-based enumeration of T cells shows no significant change in circulating T cells. (K and L) Enumeration of RBCs and platelets by CBC show significant reductions (one-way ANOVA with Bonferroni’s test; ***P < 0.001, ****P < 0.0001). n = 8 for all 3 groups. PB, peripheral blood; BMT, BM transplantation; hI3, human IGF2BP3; mI3, murine IGF2BP3; CBC, complete blood count; LTR, long terminal repeat; IRES, internal ribosome entry site. Three separate BMT experiments were completed for validation. Data represent mean ±SD.
Figure 4
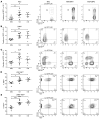
Figure 4. Analysis of BM progenitor populations from IGF2BP3-overexpressing mice.
(A) Enumeration (left panel) and representative flow cytometry histograms to define HSCs from control vector– (second panel from left), human IGF2BP3– (second from right), and murine IGF2BP3–overexpressing mice (right panel). (B and C) Analysis for LMPPs and CLPs from mice noted as in A. Statistically significant differences were found in LMPPs and CLPs. (D) Intracellular Ki67 staining and FACS-based analyses, depicted in the same manner, with enumeration on the left hand side, within the LSK population enriched for HSCs. Significant differences in the high Ki67-expressing population were found. (E) Intracellular Ki67 staining and FACS analysis of proliferation in the LMPP population shows significant differences in the proliferative fraction. All comparisons used one-way ANOVA followed by Bonferroni’s test. *P < 0.05; **P < 0.01; ***P < 0.001; ****P < 0.0001. LSK, LinSca1hic-Kithi. Three separate BMT experiments were completed for validation. Data represent mean ±SD. See also Supplemental Figure 3. hI3, human IGF2BP3; mI3, murine IGF2BP3.
Figure 5
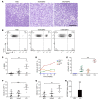
Figure 5. Analysis of thymic cellular composition and competitive repopulation advantage from IGF2BP3-overexpressing mice.
(A) Histologic images of thymic sections from mice with enforced expression of IGF2BP3. H&E staining. Scale bar: 40 μm. (B and C) Representative FACS plots and enumeration showing an increase in B220+ cells in the thymus of mice with enforced expression (one-way ANOVA with Bonferroni’s test; **P < 0.01). See also Supplemental Figure 4. n = 8 for all 3 groups. Three separate BMT experiments were completed for validation. (DH) Competitive repopulation study. (D) Quantitation of GFP expression in the PB between 4 and 20 weeks after transplant in competitive repopulation study of IGF2BP3. (EG) FACS of PB (E), BM (F), and thymus (G) done at 20 weeks after BMT, showing CD45.2 and GFP positivity (one-way ANOVA followed by Bonferroni’s test; **P < 0.01, ***P < 0.001). (H) qPCR confirmation of overexpression of IGF2BP3 in mouse BM (t test; ***P = 0.0006). n = 8 (MIG), n = 8 (Hoxa9), n = 5 (hI3), and n = 4 (100% CD45.1). Competitive repopulation study was completed 3× for validation. Data represent mean ±SD. hI3, human IGF2BP3; mI3, murine IGF2BP3; PB, peripheral blood.
Figure 6
Figure 6. iCLIP analysis of IGF2BP3 in human leukemia cell lines.
(A) Proportion of IGF2BP3 (REH and RS4;11 cells), hnRNPA1(HEK cells), and simulated (Genome) cross-linking sites observed in exons, introns, or unannotated regions of the human genome. (B) Proportion of IGF2BP3 (REH and RS4;11 cells), hnRNPA1 (HEK cells), and simulated (mRNA background) binding sites in coding and noncoding exons. (C) Tetramer sequence enrichment at IGF2BP3–cross-linking sites in RS4;11 and REH cells (upper and lower panel, respectively). (D) IGF2BP3 (REH, RS4;11) and hnRNPA1 (HEK cells) cross-link site density relative to termination codons. (E) IGF2BP3 cross-linking density from REH (dark blue line) and RS4;11 (light blue line) cell lines mapped relative to annotated miR target sites. hnRNPA1 (black line) cross-linking sites from HEK293 cells are included as a control. (F and G) UCSC Genome Browser snapshot of the CDK6 and MYC 3′UTR loci, respectively. Each panel shows the exon-intron structure of the gene, sequence conservation across vertebrate species, and unique read coverage from 2 iCLIP replicates from each cell line. The maximum number of reads at each position is indicated to the left of each histogram. See also Supplemental Figures 5 and 6. (H) Western blot of protein samples from IGF2BP3 RIP. Input refers to RS4;11 cell lysate used for immunoprecipitation. FT is flowthrough of immunoprecipitation from either control (mouse IgG) or IGF2BP3 RIP. RIP is RNA immunoprecipitation from control (mouse IgG) or α-IGF2BP3 antibody (D-7). (I) Scatter bar plots comparing the fold-enrichment for MYC (n = 4, t test; **P < 0.01) and CDK6 (n = 3, t test; *P < 0.05) in control (mouse IgG) and α-IGF2BP3 antibody RNA immunoprecipitations. Levels of MYC and CDK6 are normalized to input levels from total RNA with 18s rRNA as reference.
Figure 7
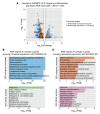
Figure 7. Cross-validation of IGF2BP3 iCLIP targets with IGF2BP3-sensitive differentially expressed genes.
(A) Volcano plot of differentially expressed genes (blue dots) determined using DESeq analysis on RNA-Seq samples from control and IGF2BP3 knockdown RS4;11 cells (as described in Figure 2). Differentially expressed genes identified as IGF2BP3 targets by iCLIP are highlighted (orange dots). Dots demarcated by black outlines are leukemogenic genes by GO analysis of OMIM-associated disease pathways. Dotted lines represent 1.5-fold–change in expression (vertical lines) and P < 0.05 cutoff (horizontal line). (B and C) GO analysis of gene subgroups showing increased expression (B) and decreased expression (C) with IGF2BP3 knockdown using ENRICHR gene list enrichment analysis webtool. Term lists used in this analysis were GO_Biological_Processes and KEGG to determine enriched processes and pathways from our cross-validated list of 269 IGF2BP3-targeted and -sensitive genes. Vertical dotted lines represent P value cutoff (P < 0.05). KD, knockdown.
Figure 8
Figure 8. CDK6 and MYC are targeted by IGF2BP3.
(A) Schematic of the luciferase assay used. (B) Luciferase assay showing targeting of the CDK6 and MYC 3′UTRs by IGF2BP3 (t test *P = 0.05; P = 0.0250 CDK6-4, P = 0.0475 CDK6-5, P = 0.0165 MYC). (C) Deletion of the MYC 3′UTR binding sites of IGF2BP3 led to modest but significantly decreased luciferase activity (t test *P = 0.05; P = 0.0120 MYC, P = 0.0294 MYC Δ3). (D and E) CDK6 analysis of BM progenitors shows a significantly increased amount of CDK6 protein in the GFP+ BM cells (t test; *P = 0.0213) (D) but not in the GFP (E) cells. (F and G) Intracellular staining for MYC reveals significantly increased levels in the GFP+ BM cells after IGF2BP3-enforced expression (t test; ****P < 0.0001) (F) but not in the GFP (G) cells. n = 8 for all 3 groups. (H and I) After Igf2bp3 knockdown in 7OZ/3 cells (t test IGF2BP3 si1 and si2, respectively; ***P = 0.0007, ***P = 0.0005), there is reduced expression of CDK6 and MYC protein (H). In the RS4;11 cell line, Western blot confirmed knockdown of IGF2BP3 protein and reduced expression of CDK6 protein (I). Experiments were conducted 3× for validation. Data represent mean ±SD. See also Supplemental Figure 7. hI3, human IGF2BP3; PE, phycoerythrin.
Figure 9
Figure 9. Expression of IGF2BP3 RNA-binding domain mutants in vivo and in vitro.
(A) Schematic of IGF2BP3 with its binding domains and the respective mutants (KH and RRM). (B) Time course of normalized engraftment to MIG in PB between 4 and 20 weeks after transplant. (C) FACS of PB done at 4 weeks after BMT, showing CD45.2 and GFP positivity (one-way ANOVA followed by Bonferroni’s test; ***P < 0.001). (D) B cells in PB 16 weeks after transplant. (E) Myeloid cells in PB 12 weeks after transplant. n = 8 for all groups. Mutant BMT experiment was completed twice for validation. (F) Western blot confirmed expression of IGF2BP3 (64 kDa), KH (47 kDa), and RRM (22 kDa) proteins in 7OZ/3 using anti-T7 (top panel) and anti-IGF2BP3 (bottom) antibodies. Actin used as a loading control. (G) Luciferase assay shows increased luciferase activity for the MYC 3′UTR when cotransfected with hI3 and decreased luciferase activity for the MYC 3′UTR when cotransfected with KH and RRM mutants (t test hI3, K,H and RRM; ***P < 0.001; ****P < 0.0001). Experiment was completed 3×. Data represent mean ±SD. hI3, human IGF2BP3; PB, peripheral blood.

Similar articles

Cited by

References

    1. Mullighan CG. Molecular genetics of B-precursor acute lymphoblastic leukemia. J Clin Invest. 2012;122(10):3407–3415. doi: 10.1172/JCI61203. - DOI - PMC - PubMed
    1. Mullighan CG, Downing JR. Genome-wide profiling of genetic alterations in acute lymphoblastic leukemia: recent insights and future directions. Leukemia. 2009;23(7):1209–1218. - PubMed
    1. Krivtsov AV, Armstrong SA. MLL translocations, histone modifications and leukaemia stem-cell development. Nat Rev Cancer. 2007;7(11):823–833. doi: 10.1038/nrc2253. - DOI - PubMed
    1. Krivtsov AV, et al. H3K79 methylation profiles define murine and human MLL-AF4 leukemias. Cancer Cell. 2008;14(5):355–368. doi: 10.1016/j.ccr.2008.10.001. - DOI - PMC - PubMed
    1. Robinson BW, et al. Abundant anti-apoptotic BCL-2 is a molecular target in leukaemias with t(4;11) translocation. Br J Haematol. 2008;141(6):827–839. doi: 10.1111/j.1365-2141.2008.07100.x. - DOI - PubMed

Publication types

MeSH terms