

Linking Isotopes and Panmixia: High Within-Colony Variation in Feather δ2H, δ13C, and δ15N across the Range of the American White Pelican
- PMID: 26974163
- PMCID: PMC4790844
- DOI: 10.1371/journal.pone.0150810
Linking Isotopes and Panmixia: High Within-Colony Variation in Feather δ2H, δ13C, and δ15N across the Range of the American White Pelican
Abstract
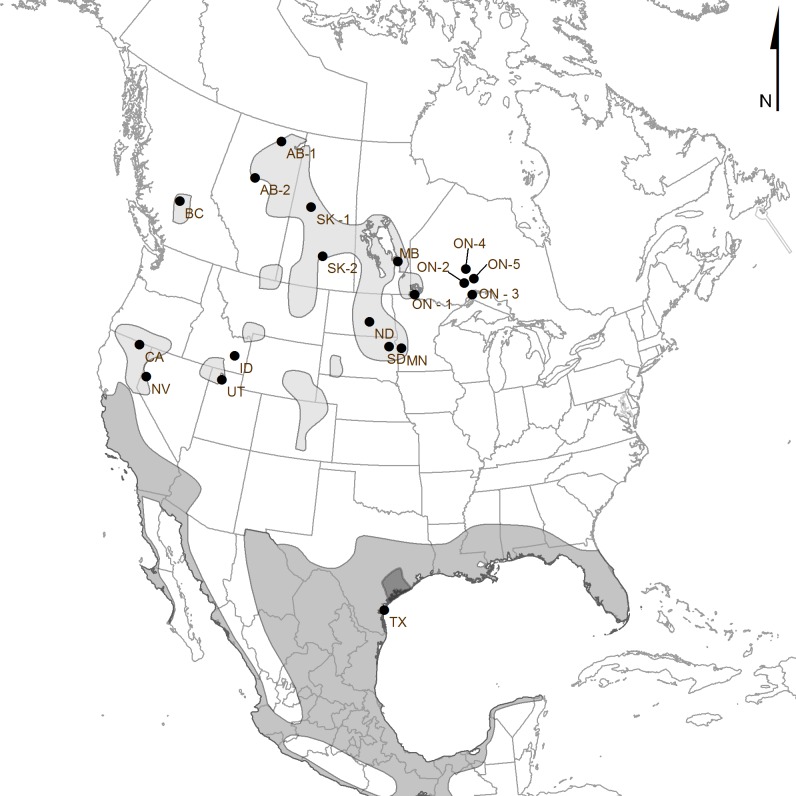
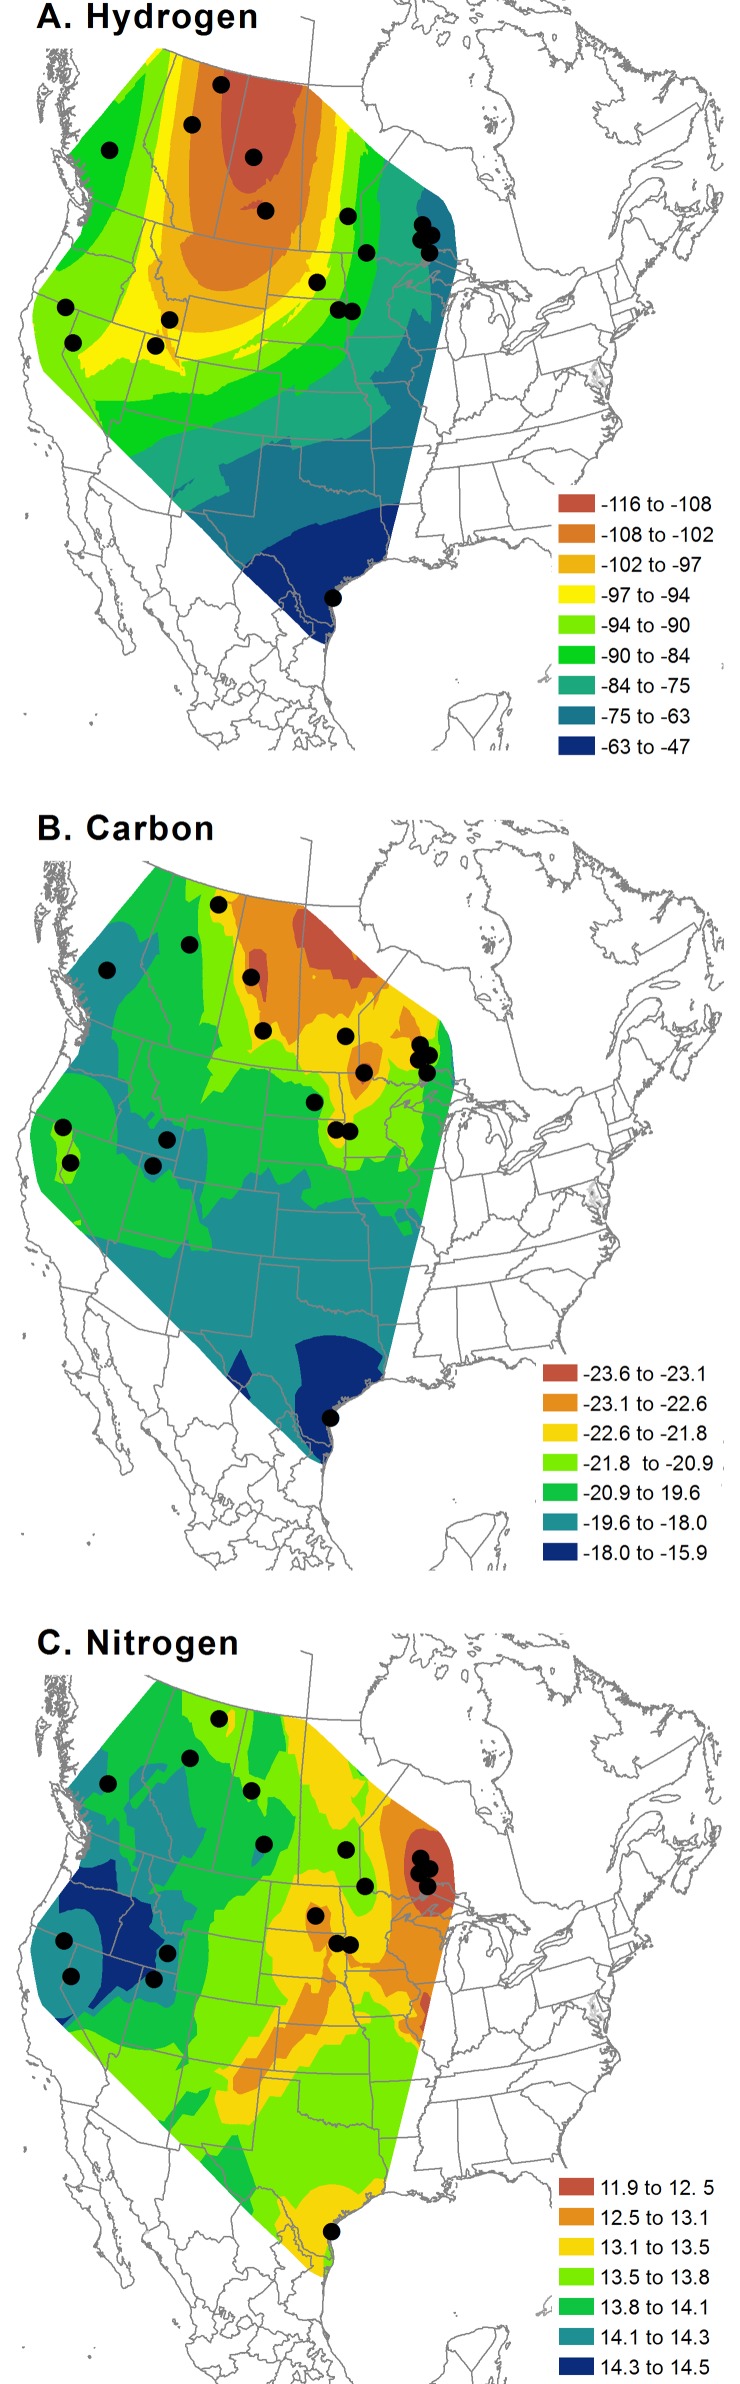
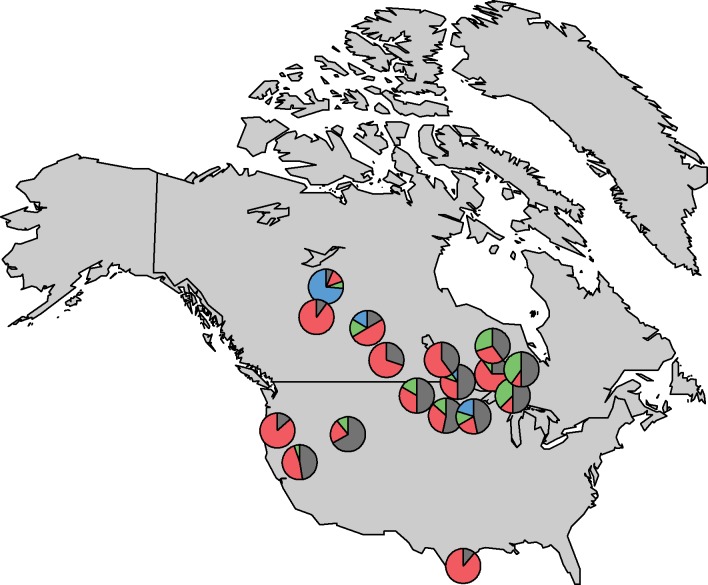
Complete panmixia across the entire range of a species is a relatively rare phenomenon; however, this pattern may be found in species that have limited philopatry and frequent dispersal. American white pelicans (Pelecanus erythrorhyncos) provide a unique opportunity to examine the role of long-distance dispersal in facilitating gene flow in a species recently reported as panmictic across its broad breeding range. This species is also undergoing a range expansion, with new colonies arising hundreds of kilometers outside previous range boundaries. In this study, we use a multiple stable isotope (δ2H, δ13C, δ15N) approach to examine feather isotopic structuring at 19 pelican colonies across North America, with the goal of establishing an isotopic basemap that could be used for assigning individuals at newly established breeding sites to source colonies. Within-colony isotopic variation was extremely high, exceeding 100‰ in δ2H within some colonies (with relatively high variation also observed for δ13C and δ15N). The high degree of within-site variation greatly limited the utility of assignment-based approaches (42% cross-validation success rate; range: 0-90% success). Furthermore, clustering algorithms identified four likely isotopic clusters; however, those clusters were generally unrelated to geographic location. Taken together, the high degree of within-site isotopic variation and lack of geographically-defined isotopic clusters preclude the establishment of an isotopic basemap for American white pelicans, but may indicate that a high incidence of long-distance dispersal is facilitating gene flow, leading to genetic panmixia.
Conflict of interest statement
Figures
Similar articles
-
Multi-Isotopic (δ2H, δ13C, δ15N) Tracing of Molt Origin for Red-Winged Blackbirds Associated with Agro-Ecosystems.PLoS One. 2016 Nov 15;11(11):e0165996. doi: 10.1371/journal.pone.0165996. eCollection 2016. PLoS One. 2016. PMID: 27846302 Free PMC article.
-
A multi-isotope (δ13C, δ15N, δ34S, δ2H) approach to establishing migratory connectivity in lesser snow geese: Tracking an overabundant species.PLoS One. 2018 Aug 24;13(8):e0203077. doi: 10.1371/journal.pone.0203077. eCollection 2018. PLoS One. 2018. PMID: 30142189 Free PMC article.
-
Geographic assignment of seabirds to their origin: combining morphologic, genetic, and biogeochemical analyses.Ecol Appl. 2007 Jul;17(5):1484-98. doi: 10.1890/06-1232.1. Ecol Appl. 2007. PMID: 17708223
-
Resolving temporal variation in vertebrate diets using naturally occurring stable isotopes.Oecologia. 2005 Aug;144(4):647-58. doi: 10.1007/s00442-005-0118-0. Epub 2005 Jul 22. Oecologia. 2005. PMID: 16041545 Review.
-
Tree-ring stable isotopes and historical perspectives on pollution--an overview.Environ Pollut. 2010 Jun;158(6):2007-13. doi: 10.1016/j.envpol.2009.11.031. Epub 2009 Dec 21. Environ Pollut. 2010. PMID: 20022153 Review.
Cited by
-
Spatio-temporal processes drive fine-scale genetic structure in an otherwise panmictic seabird population.Sci Rep. 2020 Nov 26;10(1):20725. doi: 10.1038/s41598-020-77517-w. Sci Rep. 2020. PMID: 33244100 Free PMC article.
References
-
- Ward RD, Skibinski DOF, Woodwark M (1992) Protein heterozygosity, protein structure, and taxonomic differentiation. Evolution 26: 73–159.
-
- Beveridge M, Simmons LW (2006) Panmixia: an example from Dawson's burrowing bee (Amegilla dawsoni) (Hymenoptera: Anthophorini). Molecular Ecology 15: 951–957. - PubMed
-
- Coltman DW, Stenson G, Hammill MO, Haug T, Davis CS, Fulton TL (2007) Panmictic population structure in the hooded seal (Cystophora cristata). Molecular Ecology 16:1639–1648. - PubMed
-
- Hoarau G, Rijnsdorp AD, van der Veer HW, Stam WT, Olsen JL (2002) Population structure of plaice (Pleuronectes platessa L.) in northern Europe: microsatellites revealed large-sale spatial and temporal homogeneity. Molecular Ecology 11: 1165–1176. - PubMed
Publication types
MeSH terms
Substances
LinkOut - more resources
Full Text Sources
Other Literature Sources
