. 2016 Mar 14;5(3):e210.
doi: 10.1038/oncsis.2016.19.

A porcine model of osteosarcoma

Affiliations

A porcine model of osteosarcoma

A Saalfrank et al. Oncogenesis. .

Abstract

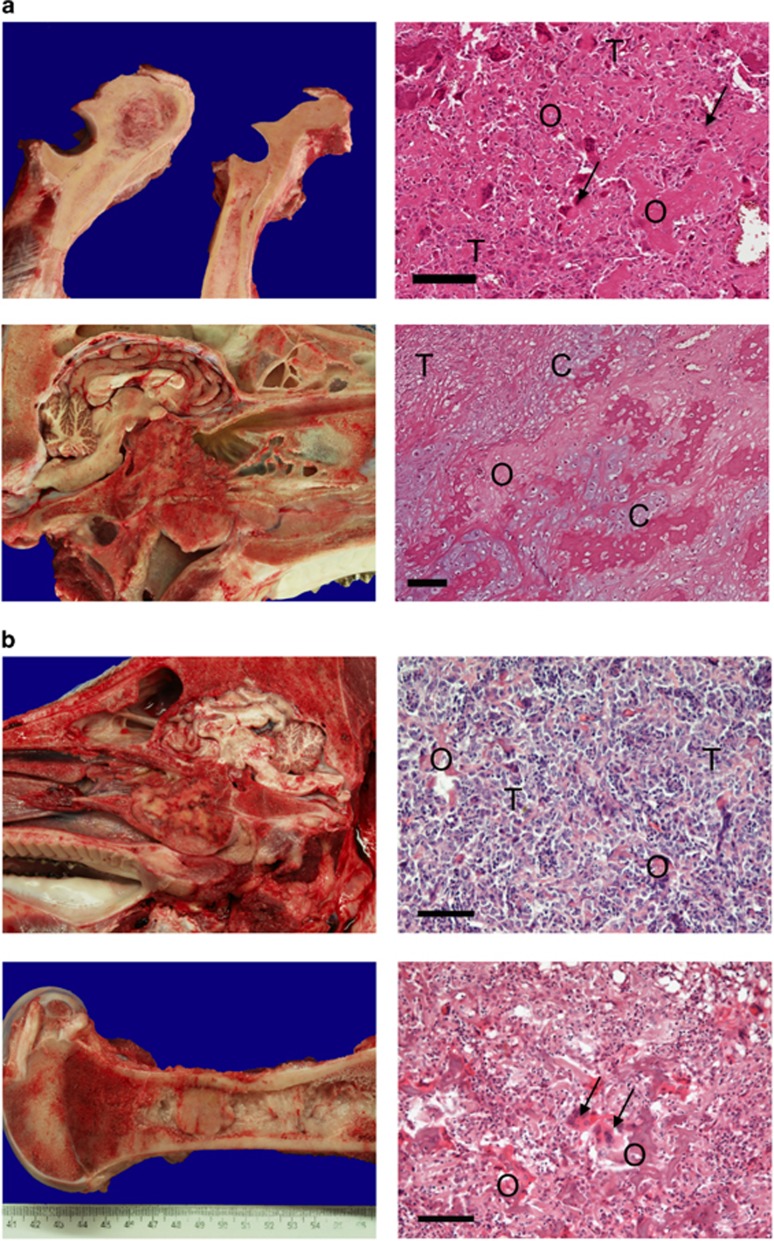
We previously produced pigs with a latent oncogenic TP53 mutation. Humans with TP53 germline mutations are predisposed to a wide spectrum of early-onset cancers, predominantly breast, brain, adrenal gland cancer, soft tissue sarcomas and osteosarcomas. Loss of p53 function has been observed in >50% of human cancers. Here we demonstrate that porcine mesenchymal stem cells (MSCs) convert to a transformed phenotype after activation of latent oncogenic TP53(R167H) and KRAS(G12D), and overexpression of MYC promotes tumorigenesis. The process mimics key molecular aspects of human sarcomagenesis. Transformed porcine MSCs exhibit genomic instability, with complex karyotypes, and develop into sarcomas on transplantation into immune-deficient mice. In pigs, heterozygous knockout of TP53 was sufficient for spontaneous osteosarcoma development in older animals, whereas homozygous TP53 knockout resulted in multiple large osteosarcomas in 7-8-month-old animals. This is the first report that engineered mutation of an endogenous tumour-suppressor gene leads to invasive cancer in pigs. Unlike in Trp53 mutant mice, osteosarcoma developed in the long bones and skull, closely recapitulating the human disease. These animals thus promise a model for juvenile osteosarcoma, a relatively uncommon but devastating disease.


Figures

Figure 1
Figure 1
Transformation of porcine MSCs. (a) Overview of stepwise transformation of genetically modified porcine MSCs. (b) Left: Cre-mediated excision of transcriptional termination cassette from the KRASLSL-G12D allele. Cell types as shown. PCR amplification products across the site of the LSL-BS cassette in KRAS intron 1. Predicted fragment sizes: wild-type KRAS 167 bp; non-recombined KRASLSL-G12D 1486 bp; Cre-excised KRASL-G12D 201 bp. Right: Cre-mediated excision of transcriptional termination cassette from both TP53LSL-R167H alleles. Cell types as shown. PCR amplification products across the site of LSL-NEO cassette in TP53 intron 1. Predicted fragment sizes: wild-type TP53 198 bp; non-recombined TP53LSL-R167H 1929 bp; Cre-excised TP53L-R167H 254 bp. (c) Ras activation assay and p53 western blotting analysis. Cre-recombined MSC-PKC and MSC-PKCM cells show increased levels of active GTP-bound Ras proteins (21 kDa) as well as abundant levels of mutant p53-R167H proteins (46 kDa). (d) EdU (5-ethynyl-2'-deoxyuridine) incorporation during S phase. Data are consistent with the enhanced proliferative capacity of genetically modified derivatives relative to wild-type MSCs. P-values: MSC-PK=0.0727; MSC-PKC=0.0042; MSC-PKCM=0.0019. (e) Upper row: Loss of contact inhibition. MSC-PKCM cells form multi-layered foci when cultured at higher densities. Scale bars indicate 400 μm. Lower row: Anchorage-independent growth in soft agar. Wild-type MSCs grow as single cells in semi-solid medium, whereas MSC-PK, MSC-PKC and MSC-PKCM cells form three-dimensional colonies. Scale bars indicate 400 μm. (f) Upper: H&E-stained section of paucicellular nodule formed by injected MSC-PKC cells. The nodule consists mainly of matrigel with fat islands, capillary sprouts and isolated cells with slightly irregular nuclei. Scale bar indicates 500 μm. The arrow indicates an area of higher cellularity. Lower: Mesenchymal cells with slightly irregular nuclei embedded in a myxoid stroma are evident at higher magnification. Scale bar indicates 100 μm. (g) H&E-stained sections of MSC-PKCM derived tumour. This tumour is mostly highly cellular, but a matrix-rich area is still present, for example, as indicated by an asterisk. In the cellular areas, large tumour cells with pleomorphic nuclei are evident. A chronic inflammatory reaction is also present. Scale bar indicates 200 μm.
Figure 2
Figure 2
Expression profiles of cancer-related genes in transformed MSCs and sarcoma-derived tumour cells. (a) Differential gene expression heat maps relative to wild-type MSCs. Genes are grouped by functional categories, as indicated. The key at bottom right indicates fold-change values (log2 scale) represented as a colour gradient from blue (downregulation) to red (upregulation). See also Supplementary Table S2. (b) Sequence analysis of KRAS RT–PCR products amplified from exon 1 to exon 4. Cell types as shown. Codon 12 is indicated by a red box. RT–PCR products carrying the GAT sequence (G12D mutation) are the predominant species in poSARCO cells. (c) PoSARCO cells express higher levels of active GTP-bound Ras proteins (21 kDa) than the parental MSC-PKCM cells.
Figure 3
Figure 3
p16INK4, p14ARF and TERT expression. (a) Expression of porcine p16INK4α and p14ARF relative to wild-type MSCs. Cell types as shown. Values are normalised to GAPDH mRNA expression. Left: Downregulation of p16INK4α mRNA expression in stepwise modified MSC derivatives. Right: Increased p14ARF mRNA expression in modified porcine MSC derivatives. (b) CpG methylation analysis of the porcine P16INK4A locus (−10 to +256 bp relative to transcription start). Circles indicate methylation sites: filled circles represent methylated and open circles non-methylated sites. The proportion of total sites methylated is indicated at right. Cell types as shown. (c) Telomerase reverse transcriptase (TERT) expression is not activated in transformed porcine MSC derivatives. Porcine induced pluripotent stem cells (piPSC) are shown as a positive control for porcine TERT expression; a diagnostic 387-bp DNA fragment is evident. GAPDH was amplified (567 bp) as a control as indicated.
Figure 4
Figure 4
Chromosomal instability. (a) The number of cells in G0/G1, S and G2/M phase determined by flow cytometry, after growth under normal conditions (control), and 24 h after treatment with nocodazole. Representative DNA content histograms are shown for cell types as indicated. Wild-type MSCs show a strong increase in the G2/M-phase peak in response to nocadazole. In contrast, p53-deficient cell types (MSC-P, MSC-PK) and cells that express mutant p53-R167H (MSC-PKC,MSC-PKCM poSARCO) show no such increase but feature polyploid DNA peaks after nocodazole treatment. (b) Mitotic block index. The ratio of G1 peak in nocodazole-treated cells compared with control conditions (mean±s.d. for n=4 assays) shown for human cell lines and porcine MSC derivatives as indicated. A low index value indicates an effective mitotic checkpoint arrest after nocodazole treatment, as shown for human HEK293 (non-tumour origin) and HCT116 cells (colon cancer cells, chromosomally stable but DNA microsatellite unstable). In contrast, human SW480 and CaCo2 cells have high index values, indicating failure to induce G2/M arrest. MSC-P cells have intermediate index values, whereas MSC-PKC and MSC-PKCM clones, and especially poSARCO cells, have highly elevated index values, indicative of mitotic checkpoint deficiency. The tumour-derived poSARCO cells feature significantly increased index numbers, compared with p53-deficient MSC-P (P=0.0055), whereas MSC-PKC and MSC-PKCM cells do not differ significantly from MSC-P.
Figure 5
Figure 5
Osteosarcomas in TP53 knockout pigs. (a) Upper: Osteoblastic osteosarcoma at left tuber olecrani in heterozygous knockout animal ID: 36. H&E-stained section shows tumour cells (T) with eccentric, hyperchromatic nuclei that produce osteoid (O). Multinucleate giant cells (arrows) with features of osteoclasts are scattered throughout the neoplasia. Scale bar indicates 100 μm. Lower: Osteoblastic and chondroblastic osteosarcoma at the skull basis in heterozygous knockout animal ID: 47. H&E-stained section shows tumour cells (T) that produce osteoid (O) and a chondroid matrix (C). Scale bar indicates 100 μm. (b) Upper: Osteoblastic osteosarcoma of the skull infiltrating os sphenoidale and vomer in homozygous knockout animal ID: 242. Polygonal tumour cells (T) and islands of osteoid (O). Scale bar indicates 100 μm. Lower: osteoblastic osteosarcoma in the bone marrow of left femur in homozygous knockout animal ID: 242. Multinucleated giant cells (arrows) were scattered throughout the neoplasia. Scale bar indicates 100 μm.
Figure 6
Figure 6
Transformed MSCs and osteosarcoma-derived cells show increased resistance to radiation. (a) Survival of cells after 137Cs irradiation after 2 weeks of culture. Left: Colonies stained with crystal violet; cell types and doses as indicated. Right: Mean survival±s.d., n=4. No significant differences were observed at 10 Gy irradiation. However, at 2 Gy transformed MSC showed increased viability compared with WT-MSCs: MSC-P (P=0.0184), MSCK-PKC (P=0.0500). MSC-PKCM cells did not attain significance (P=0.1558). Results were similar at the intermediate dose 6 Gy: MSC-P (P=0.0011); MSCK-PKC (P=0.0081); MSC-PKCM (P=0.0874). (b) Osteosarcoma cells show increased radioresistance. Cell survival in response to irradiation was assessed after 2 weeks of cell culture, as above. Cells were derived from a tumour on the left tibia of homozygous TP53 knockout pig (animal ID: 242) compared with cells from a tumour-free bone of the same animal. Tumour cells showed increased clonal growth after irradiation.

References

    1. Rangarajan A, Hong SJ, Gifford A, Weinberg RA. Species- and cell type-specific requirements for cellular transformation. Cancer Cell 2004; 6: 171–183. - PubMed
    1. Kendall SD, Linardic CM, Adam SJ, Counter CM. A network of genetic events sufficient to convert normal human cells to a tumorigenic state. Cancer Res 2005; 65: 9824–9828. - PubMed
    1. Flisikowska T, Kind A, Schnieke A. Genetically modified pigs to model human diseases. J Appl Genet 2013; 55: 53–64. - PubMed
    1. Rogers CS, Stoltz DA, Meyerholz DK, Ostedgaard LS, Rokhlina T, Taft PJ et al. Disruption of the CFTR gene produces a model of cystic fibrosis in newborn pigs. Science 2008; 321: 1837–1841. - PMC - PubMed
    1. Renner S, Fehlings C, Herbach N, Hofmann A, von Waldthausen DC, Kessler B et al. Glucose intolerance and reduced proliferation of pancreatic beta-cells in transgenic pigs with impaired glucose-dependent insulinotropic polypeptide function. Diabetes 2010; 59: 1228–1238. - PMC - PubMed