. 2016 May;17(5):556-64.
doi: 10.1038/ni.3390. Epub 2016 Mar 14.

Phosphatase PP2A is requisite for the function of regulatory T cells

Affiliations

Phosphatase PP2A is requisite for the function of regulatory T cells

Sokratis A Apostolidis et al. Nat Immunol. 2016 May.

Abstract

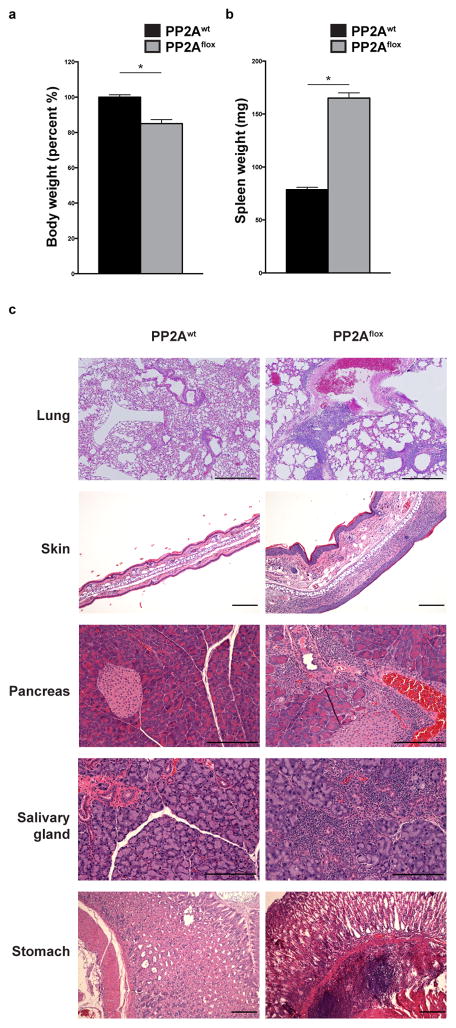
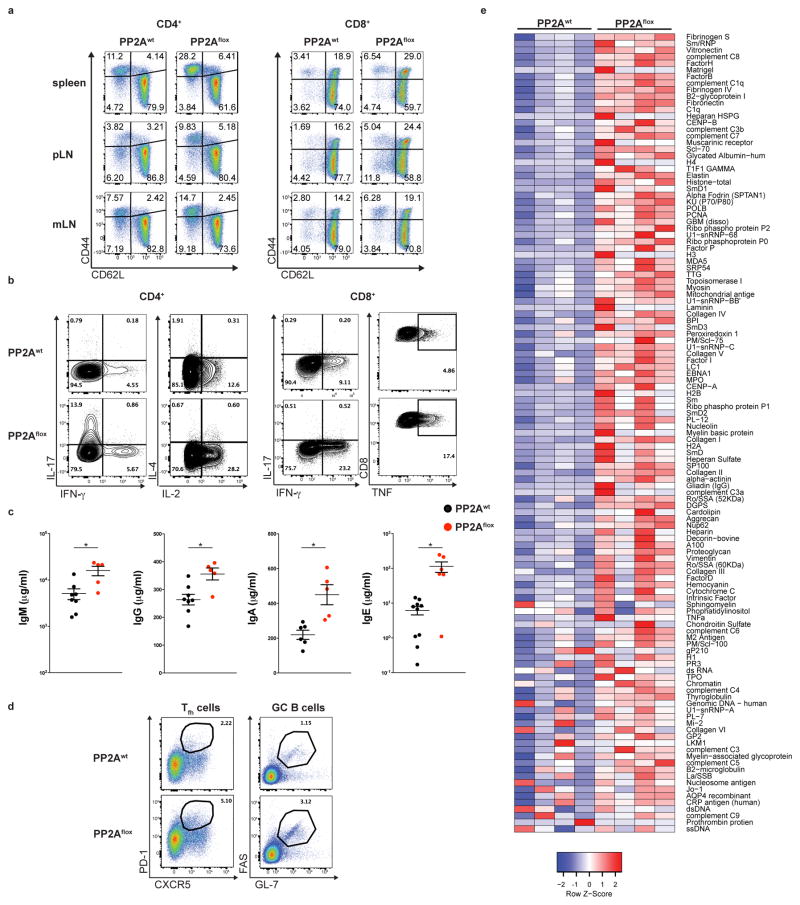
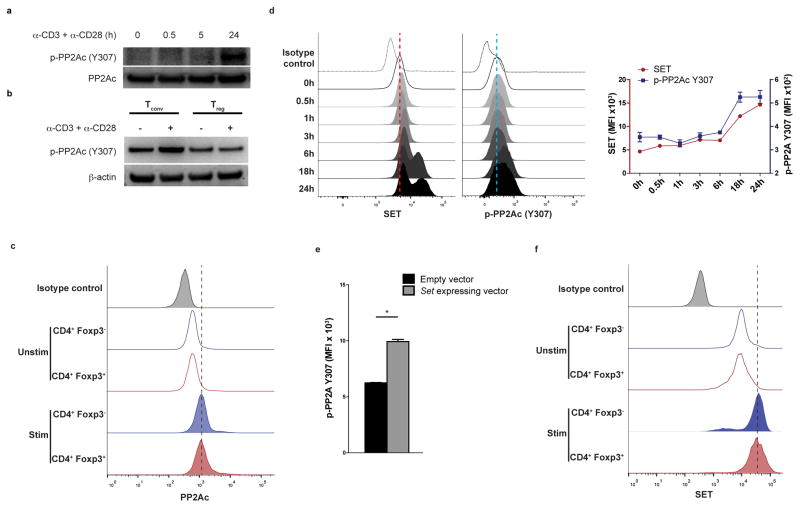
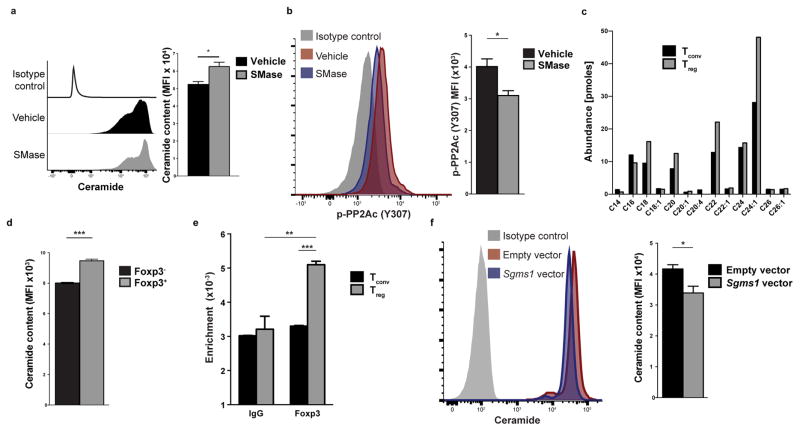
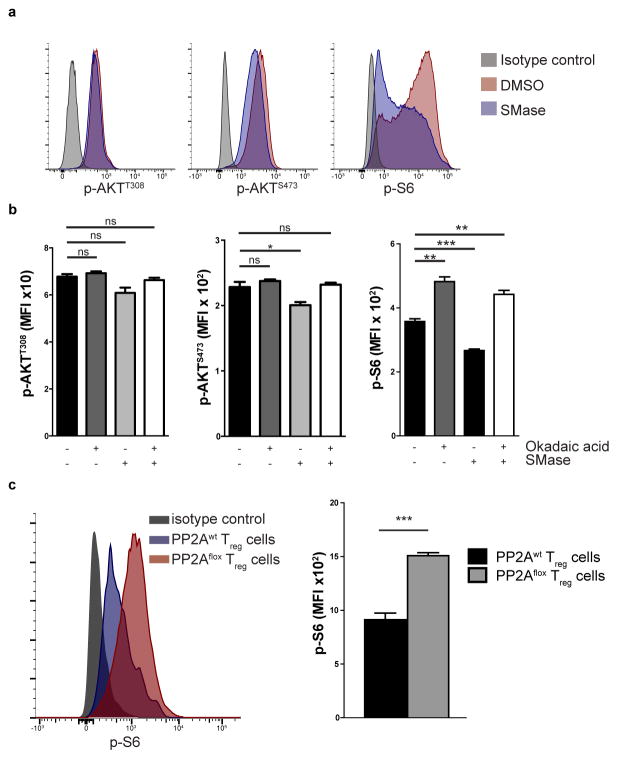
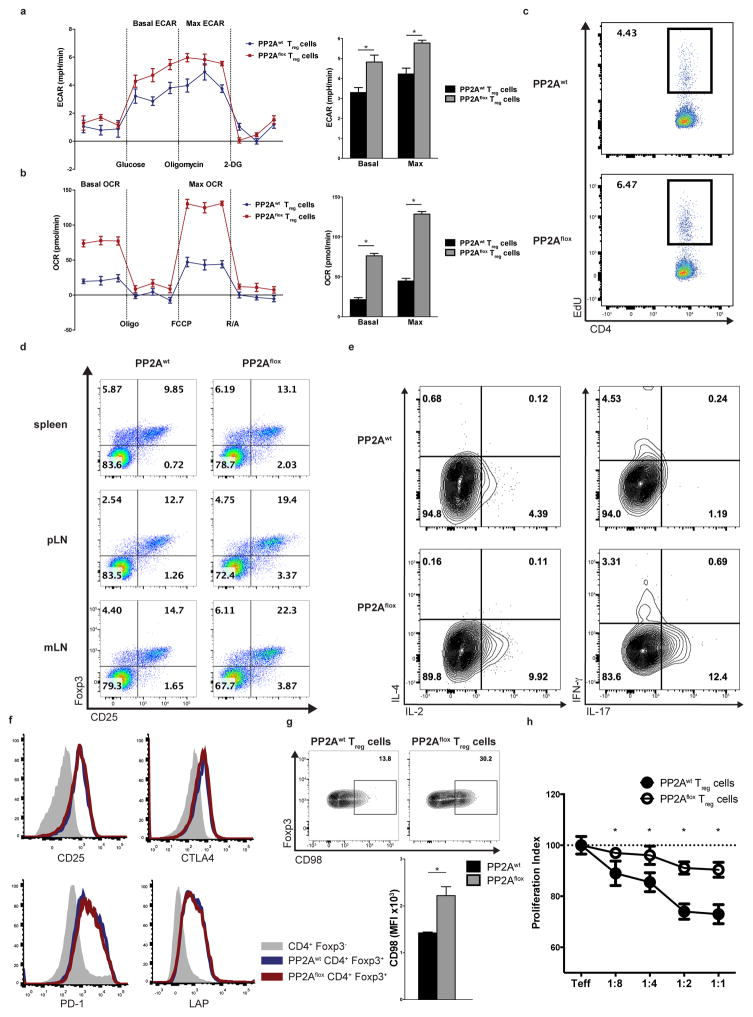
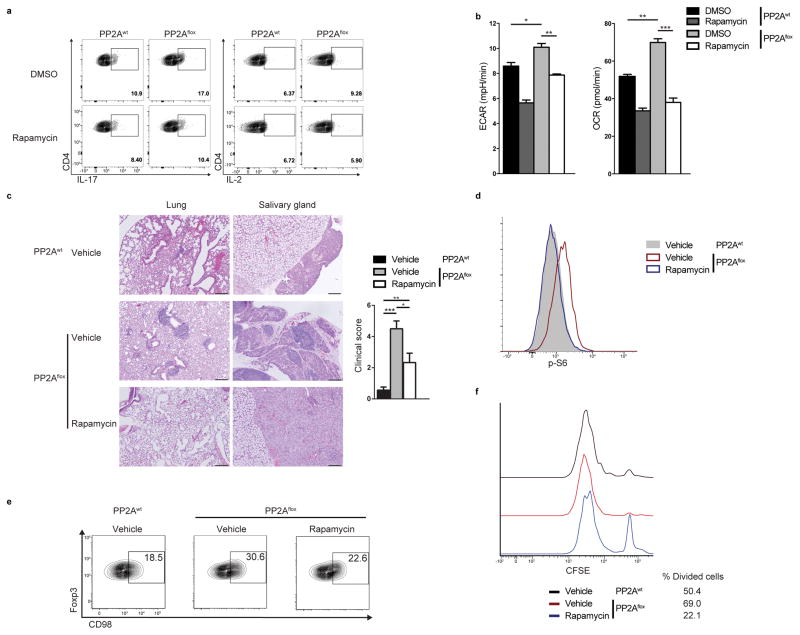
Homeostasis of the immune system depends on the proper function of regulatory T cells (T(reg) cells). Compromised suppressive activity of T(reg) cells leads to autoimmune disease and graft rejection and promotes anti-tumor immunity. Here we report a previously unrecognized requirement for the serine-threonine phosphatase PP2A in the function of T(reg) cells. T(reg) cells exhibited high PP2A activity, and T(reg) cell-specific ablation of the PP2A complex resulted in a severe, multi-organ, lymphoproliferative autoimmune disorder. Mass spectrometry revealed that PP2A associated with components of the mTOR metabolic-checkpoint kinase pathway and suppressed the activity of the mTORC1 complex. In the absence of PP2A, T(reg) cells altered their metabolic and cytokine profile and were unable to suppress effector immune responses. Therefore, PP2A is required for the function of T(reg) cells and the prevention of autoimmunity.


Conflict of interest statement

The authors have no competing financial interests to declare.

Figures

Figure 1
Figure 1. PP2Aflox mice develop multi-organ autoimmunity
(a, b) The body weight (a, n=17 for PP2Awt and n=9 for PP2Aflox) and the spleen weight (b, n=5 per group) of 10–14 week-old PP2Awt and PP2Aflox mice were quantified. (c) H&E staining of the lungs, the skin, the pancreas, the salivary glands and the stomach of PP2Awt and PP2Aflox mice (scale bar represents 200 μm). Images are from one experiment representative of three independent experiments with similar results (n=3 mice per group per experiment). Mean ± s.e.m. is shown, *P<0.001 (unpaired, two-tailed t-test).
Figure 2
Figure 2. Spontaneous T cell and B cell activation in PP2Aflox mice
(a, b) CD4+ and CD8+ T cells of 10–14 week-old PP2Awt and PP2Aflox mice were stained for CD62L and CD44 (a, spleen, peripheral and mesenteric lymph nodes) and for the production of the indicated cytokines (b, spleen). Data shown are from one experiment representative of three independent experiments (n=3 mice per group) (c) The levels of serum IgM, IgG, IgA and IgE in PP2Awt and PP2Aflox mice were quantified (n=8 for PP2Awt and n=5 for PP2Aflox mice). (d) The percentages of T follicular helper (Tfh) cells and germinal center (GC) B cells in the spleen from PP2Awt and PP2Aflox mice are shown. Data shown are from one experiment representative of two independent experiments (n=3 mice per group per experiment). (e) Sera from PP2Awt and PP2Aflox mice were analyzed for the presence of autoantibodies. Each individual column of the heatmap represents an individual mouse (total 4 mice per group). Mean ± s.e.m is shown. *P<0.01 (unpaired, two-tailed t-test).
Figure 3
Figure 3. TCR activation induces SET-mediated phosphorylation of PP2AC at Y307 in Tconv cells but not Treg cells
(a, b) Naïve CD4+ T cells (a) or Tconv and Treg cells (b) were stimulated with CD3 plus CD28 antibodies for the indicated time periods. Immunoblotting for p-PP2AC (Y307) was then performed. Data are from one experiment representative of two independent experiments with similar results (n=3 mice per experiment). (c, f) Splenocytes isolated from Foxp3IRES-GFP mice were stimulated with CD3 plus CD28 antibodies for 24 hours or left unstimulated. Intracellular staining was then performed for PP2AC (c) or SET (f). Data are from one experiment representative of three independent experiments with similar results (n=3 mice per experiment). (d) Naïve CD4+ T cells were stimulated with CD3 plus CD28 for 0, 0.5, 1, 3, 6, 18 and 24 hours. Intracellular staining was then performed for SET and p-PP2AC (Y307). A representative histogram (left) and quantification of the results (right) is shown from one of two independent experiments with similar results (n=3 per group). (e) Intracellular staining for p-PP2AC (Y307) of naïve CD4+ T cells activated with CD3 plus CD28 antibodies for 24 hours and then spin-infected with an empty or a Set-expressing mCherry lentiviral vector. The analysis was done on mCherry+ T cells (n=5 per group, one of two experiments with similar results is shown). Mean ± s.e.m. is shown, MFI: Mean fluorescent intensity, *P<0.01 (unpaired, two-tailed t-test).
Figure 4
Figure 4. Treg cells display higher ceramide content through Foxp3-mediated inhibition of Sgms1
(a, b) Naïve CD4+ T cells were stimulated with anti-CD3 plus anti-CD28 for 24h and then treated with sphingomyelinase (SMase, 0.5 units/mL) or vehicle (50% glycerol in PBS) for 1h. The cells were then stained for ceramide (a) or p-PP2AC (Y307) (b). A representative histogram (left) and quantification of the results (right) is shown (n=3, one of two experiments with similar results is shown). (c) Tconv and Treg cells were stimulated for 24h and then subjected to ESI-MS/MS for the quantification of ceramide species. (d) Ceramide content of CD3+CD4+Foxp3 and CD3+CD4+Foxp3+ was quantified using flow cytometry (n=3 mice). Data are from one of three experiments with similar results. (e) Tconv and Treg cells were subjected to chromatin immunoprecipitation using a Foxp3-specific antibody or an IgG control antibody. Shown is binding enrichment at the mouse Sgms1 gene, normalized to the input (n=3 per group, one representative of two independent experiments with similar results is shown). (f) Naïve CD4+ T cells were stimulated for 24h and then spin-infected with an mCherry-expressing lentivirus that harbored or not the murine Sgms1 coding sequence. CD4+mCherry+ cells were analyzed for ceramide content using flow cytometry. A representative histogram (left) and quantification of the results (right) is shown. Data are from one experiment representative of two independent experiments with similar results. Mean ± s.e.m. is shown, MFI: Mean fluorescent intensity, *P<0.05, **P<0.01, ***P<0.001 (unpaired, two-tailed t-test).
Figure 5
Figure 5. PP2A inhibits the mTORC1 pathway in Treg cells
(a) Jurkat T cells were treated with SMase (0.5 units/mL) or vehicle (50% glycerol in PBS) for 1 hour and then stained for p-AKTT308, p-AKTS473 and p-S6. Data are from one experiment representative of two independent experiments with similar results. (b) Naïve CD4+ T cells were stimulated with CD3 plus CD28 antibodies (2 μg/mL) for 24h and then incubated with okadaic acid or DMSO for 3 hours. During the last hour the cells were treated with SMase or vehicle and then stained for p-AKTT308, p-AKTS473 and p-S6 (n=3 per treatment group). Data are from one experiment representative of two independent experiments with similar results. (c) Foxp3+ Treg cells were isolated from PP2Awt and PP2Aflox mice and stained for p-S6 (n=3 mice per group). A representative histogram (left) and quantification of the results (right) is shown. Data are from one experiment representative of three independent experiments with similar results. Mean ± s.e.m., MFI: Mean fluorescent intensity, ns P>0.05, *P<0.05, **P<0.01, ***P<0.001 (unpaired, two-tailed t-test).
Figure 6
Figure 6. PP2Aflox Tregs exhibit metabolic, proliferation and cytokine production abnormalities
(a, b) The extracellular acidification rate (a, ECAR) and the oxygen consumption rate (b, OCR) of PP2Awt and PP2Aflox Treg cells are shown. Left: Representative stress tests (a: glycostress test, b: mitostress test). Right: quantification of the results is shown (n=4). Data are from one experiment representative of three independent experiments with similar results. (c) The proliferation rate of PP2Awt and PP2Aflox Treg cells was quantified in vivo after i.p. injection of EdU (n=3, one experiment is shown representative of two independent experiments). (d) The percentage of CD25+Foxp3-YFP+ T cells in the spleens, peripheral and mesenteric lymph nodes of 10–14 week-old PP2Awt and PP2Aflox mice is shown (n=4 mice per group, one experiment is shown representative of two independent experiments). (e) Treg cells from the spleens of 10–14 week-old PP2Awt and PP2Aflox mice were stimulated with PMA/Ionomycin for 6h and then stained intracellularly for the indicated cytokines (n=3 mice per group). Data are from one experiment representative of three independent experiments with similar results. (f, g) PP2Awt and PP2Aflox Treg cells were stained for CD25, CTLA-4, PD-1 and LAP (f) or CD98 (g, representative histogram and quantification of the results is shown). Data are from one experiment representative of two independent experiments with similar results (n=3 mice per group) (h) In vitro suppression assay using effector CD45.1+CD4+ (Teff) T cells and PP2Awt or PP2Aflox Treg cells at the indicated ratios (Teff:Treg cells). Mean ± s.e.m., MFI: Mean fluorescent intensity, *P<0.001 (unpaired, two-tailed t-test).
Figure 7
Figure 7. Rapamycin reverses the abnormal profile of the PP2Aflox Treg cells
(a, b) FACS-sorted PP2Awt and PP2Aflox Treg cells were stimulated with CD3 plus CD28 and then expanded for 4 days in the presence of 100 IU/mL of IL-2. During the final 24 hours, they were treated with 100nM of Rapamycin or DMSO. (a) The Treg cells (gated on FoxP3-YFP+CD4+ T cells) were re-stimulated with PMA/Ionomycin for 6 hours and stained for IL-17 and IL-2. (b) The ECAR and OCR of PP2Awt and PP2Aflox Treg cells (sorted again as Foxp3-YFP+CD4+ T cells at the end of the culture) were measured (n=3 mice per group, unpaired, two-tailed t-test). Data are from one experiment representative of two independent experiments with similar results. (c) Left: H&E staining of the lungs and the salivary glands of PP2Awt and PP2Aflox mice treated or not with rapamycin (scale bar represents 100 μm). Images are from one experiment representative of two independent experiments with similar results. Right: combined clinical score of inflammation in the liver, skin, stomach, salivary glands, lungs and pancreas of PP2Awt and PP2Aflox mice treated or not with rapamycin (one-way analysis of variance (ANOVA) followed by Tukey’s multiple comparison test). (d, e) Ex vivo amounts of p-S6 (d) and CD98 expression (e) in Tregs (FoxP3-YFP+) from mice in (c). (f) In vitro suppression assay using effector CD45.1+CD4+ (Teff) T cells and Treg cells from PP2Awt or PP2Aflox rapamycin-treated and vehicle-treated mice. Representative histograms showing CFSE dilution and percentage of divided cells (ratio Treg/Teff: 1/1). Data are from one experiment representative of two independent experiments with similar results. Mean ± s.e.m., *P<0.05, **P<0.01, ***P<0.001.

Comment in

Similar articles

Cited by

References

    1. Starr TK, Jameson SC, Hogquist KA. Positive and negative selection of T cells. Annu Rev Immunol. 2003;21:139–176. - PubMed
    1. Josefowicz SZ, Lu LF, Rudensky AY. Regulatory T cells: mechanisms of differentiation and function. Annu Rev Immunol. 2012;30:531–564. - PMC - PubMed
    1. Chi H. Regulation and function of mTOR signalling in T cell fate decisions. Nat Rev Immunol. 2012;12(5):325–338. - PMC - PubMed
    1. Lyon MF, Peters J, Glenister PH, Ball S, Wright E. The scurfy mouse mutant has previously unrecognized hematological abnormalities and resembles Wiskott-Aldrich syndrome. Proc Natl Acad Sci U S A. 1990;87(7):2433–2437. - PMC - PubMed
    1. Bennett CL, et al. The immune dysregulation, polyendocrinopathy, enteropathy, X-linked syndrome (IPEX) is caused by mutations of FOXP3. Nat Genet. 2001;27(1):20–21. - PubMed

Publication types

MeSH terms