. 2016 Apr;22(4):379-87.
doi: 10.1038/nm.4062. Epub 2016 Mar 14.

PTEN opposes negative selection and enables oncogenic transformation of pre-B cells

Affiliations

PTEN opposes negative selection and enables oncogenic transformation of pre-B cells

Seyedmehdi Shojaee et al. Nat Med. 2016 Apr.

Abstract

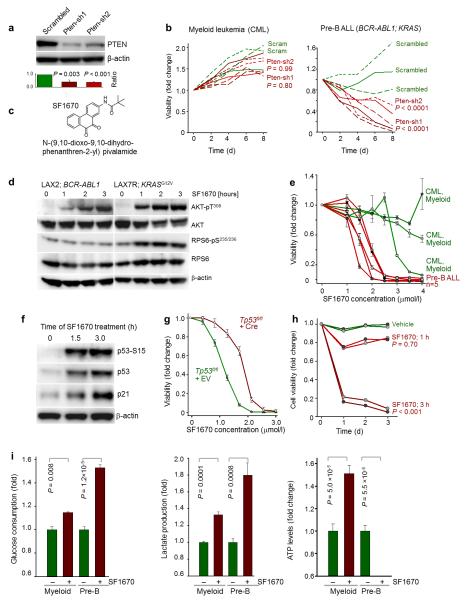
Phosphatase and tensin homolog (PTEN) is a negative regulator of the phosphatidylinositol 3-kinase (PI3K) and protein kinase B (AKT) signaling pathway and a potent tumor suppressor in many types of cancer. To test a tumor suppressive role for PTEN in pre-B acute lymphoblastic leukemia (ALL), we induced Cre-mediated deletion of Pten in mouse models of pre-B ALL. In contrast to its role as a tumor suppressor in other cancers, loss of one or both alleles of Pten caused rapid cell death of pre-B ALL cells and was sufficient to clear transplant recipient mice of leukemia. Small-molecule inhibition of PTEN in human pre-B ALL cells resulted in hyperactivation of AKT, activation of the p53 tumor suppressor cell cycle checkpoint and cell death. Loss of PTEN function in pre-B ALL cells was functionally equivalent to acute activation of autoreactive pre-B cell receptor signaling, which engaged a deletional checkpoint for the removal of autoreactive B cells. We propose that targeted inhibition of PTEN and hyperactivation of AKT triggers a checkpoint for the elimination of autoreactive B cells and represents a new strategy to overcome drug resistance in human ALL.


Figures

Figure 1
Figure 1. Pten is required for leukemic transformation of pre-B cells
(a) Deletion of Pten was confirmed after induction of Cre by tamoxifen in BCR-ABL1 transformed Ptenfl/fl pre-B cells at the genomic level by PCR (left) and by Western blot (right). β-actin was used as loading control. Representative blot, n = 3 (b) Viability of BCR-ABL1-transformed pre-B ALL cells, as measured by flow cytometry, after tamoxifen dependent induction of Pten deletion. P < 0.0001 was calculated by contingency table. (c) The fraction of BCR-ABL1GFP+ cells was measured over time by flow cytometry in pre-B cells. P value was calculated by contingency table (P < 0.0001). (d) Ptenfl/fl BCR-ABL1-transformed pre-B ALL cells transduced with tamoxifen-inducible Cre or an empty vector (EV) control were injected into NOD/SCID recipient mice (n = 7 per group). Pten deletion was induced 24 h before injection. P = 0.0002 was calculated by Mantel-Cox log-rank test. (e) Microarray gene expression analysis after 48 hours of induction of Pten deletion in BCR-ABL1-transformed pre-B ALL cells. (f) Confirming gene expression results for eight surface molecules by flow cytometry against forward scatters (FSC). (g) Expression of B cell markers were measured in vitro (left, n = 3) and in vivo (right, n = 4). Representative flow cytometry plots are shown. (h)Western blot measurement in Ptenfl/fl BCR-ABL1-transformed pre-B ALL cells using β-actin as loading control. Representative blot, n = 4. Error bars (b, c) represent S.D.
Figure 2
Figure 2. Deletion of Pten compromises BCR-ABL1 and NRAS-driven leukemogenesis
(a) The percentage of GFP+ cells were measured in BCR-ABL1 (left) or NRASG12D (right) transformed Ptenfl/fl pre-B cells transduced with inducible Cre-ERT2-GFP or GFP empty vector (EV) control after induction of Cre with tamoxifen by flow cytometry. For each plot, P < 0.0001 was obtained by contingency table. (b) Comparison of colony forming ability of BCR-ABL1 (left) or NRASG12D (right) transformed Ptenfl/fl pre-B cells after Pten deletion. (c) Measuring the induction of cell cycle arrest following 24 h of tamoxifen induced Pten deletion in BCR-ABL1 (left) or NRASG12D (right) transformed Ptenfl/fl pre-B cells. The percentages of each phase of the cell cycle are indicated. (d) The prevalence of cellular senescence was measure using β-galactosidase assay after deletion of Pten in BCR-ABL1 (left) or NRASG12D (right) transformed Ptenfl/fl pre-B cells. The percentages of cells stained with blue dots are depicted on the panels. Results in (ad) are representative of two independent experiments. Scale bars in (b) and (d) represent 1 mm and 15 μm respectively. P values (bd) were calculated by Student’s t test. (e) NOD/SCID recipient mice injected with 105 Ptenfl/fl BCR-ABL1-transformed pre-B ALL transduced with Cre-ERT2 (left) were treated with tamoxifen (0.4 mg/mouse) or corn oil (vehicle) (n = 7 per group). In a parallel experiment, NOD/SCID recipient mice were injected with 105 Ptenfl/fl NRASG12D transformed pre-B ALL cells transduced with Cre-ERT2 or empty vector (EV) control (right). In the latter experiment all mice were treated with Tamoxifen (0.4 mg/mouse; n = 7 per group). P values were calculated by Mantel-Cox log-rank test. All cells were labeled with luciferase before injection. Treatments were started on day 5 after transplantation and continued for ten consecutive days. Error bars (ab, d) represent S.D.
Figure 3
Figure 3. Pre-B ALL cells do not harbor genetic lesions in PTEN and do not tolerate hyperactivation of PI3K-AKT signaling
(a) Frequencies of genetic lesions of PTEN including mutations and deletions from the COSMIC data base for 16 types of human cancer. (b) Comparing the level of CpG methylation for PTEN promoter region in pre-B cells from healthy donors (n = 12), bone marrow biopsies from patients with pre-B ALL (n = 83) and patient-derived B cell Non-Hodgkin’s lymphoma cells (n = 68). (c) Comparing PTEN expression using RPPA assay for cases with newly diagnosed adult ALL (n = 155), T cell lineage ALL (n = 22) and mature B cell lymphoma (n = 11). P values in (bc) were calculated by two-sided Mann–Whitney Wilcoxon test. (d) PTEN expression in a panel of normal human CD19+ sorted pre-B cells (n = 3), patient-derived pre-B ALL (n = 8) and B cell Non-Hodgkin lymphoma samples (n = 4). β-actin was used as loading control. P values were calculated by Student’s t test. (e) Measuring the activity of Akt after deletion of Pten in BCR-ABL1- and NRASG12D- transformed pre-B ALL cells. β-actin was used as loading control. Representative blot, n = 3 (f) Schematic of pre-B cell receptor signaling and its interaction with PI3K/AKT pathway. (g) Rescuing cell death after Pten deletion in BCR-ABL1 (left) or NRASG12D (right) transformed Ptenfl/fl pre-B cells by using AKT inhibitor (AZD, 3 μmol/L). The percentage of GFP+ cells were measured by flow cytometry. (h) measuring the percentages of GFP+ cells after Pten deletion was induced in BCR-ABL1-transformed pre-B ALL cells in the presence or absence of AKT inhibitor (AZD, 3 μmol/L), PI3K inhibitor (BKM, 1 μmol/L) and Syk inhibitor (PRT; 3 μmol/L). For each EV and Cre transduced cells, P values were calculated by contingency table to compare treatment group with untreated control group (Ctrl). All P values for EV transduced cells are not significant (P>0.5, not shown). Error bars represent S.D. Results are representative of three independent experiments.
Figure 4
Figure 4. Hyperactivation of AKT is a defining feature of autoreactive pre-BCR signaling and triggers a checkpoint for removal of autoreactive pre-B cells
(a) Schematic of reconstitution system for inducible activation of pre-BCR signaling. (b) Relative changes of GFP+ cells relative to EV-transduced cells are shown after activation of pre-B cell signaling in BCR-ABL1 transformed pre-B ALL cells with two-day pre-treatment with inhibitors of Syk (PRT, 3 μmol/L) or AKT (AZD, 3 μmol/L). For each curve, P value was calculated by contingency table comparing treatment groups with untreated control group (Ctrl). P values for μHCNA-transduced cells were not significant (>0.5, not shown). (c) Comparing the phosphorylation of Syk, Akt and Rps6 by Western blot 5 minutes after addition of tamoxifen. Representative blot, n = 2. (d) Relative changes in the percentages of GFP+ cells after transduction of pre-B ALL cells with a GFP-tagged constitutive active Syk (SykCA; SykY348E/Y352E) or empty vector (EV) control in the presence of vehicle or inhibitors of AKT (AZD, 3 μmol/L), PI3K (BKM, 1 μmol/L) and Syk (PRT, 3 μmol/L). (e) Relative changes in the percentages of GFP+ cells after transduction of pre-B ALL cells with a GFP-tagged retroviral vector encoding myristoylated AKT (AKTCA) or GFP empty vector (EV) control in the presence or absence of AKT inhibitor (AZD, 3 μmol/L). (f) B→myeloid reprogramming of BCR-ABL1 transformed Ptenfl/fl pre-B ALL (CD19+ Mac1) to myeloid lineage (CD19 Mac1+) cells after induction of C/EBPα. (g) Expression of C/EBPα, the B cell lineage-specific transcription factor PAX5, total and phospho-AKTS473 and PTEN in B-lineage and B→myeloid reprogrammed cells. Representative blot, n = 2. (h) Changes in the frequency of GFP+ cells in B→myeloid (CD19 Mac1+) and pre-B cells (CD19+ Mac1) after induction of Cre-GFP by tamoxifen. P < 0.0001 was calculated using contingency table. All results presented in this figure are representative of two independent experiments with triplicates. Error bars (b, d–e, h) represent S.D. of the mean. For curves in (b, d and e), P values were calculated by contingency table comparing treatment groups with untreated control group (Ctrl).
Figure 5
Figure 5. pre-B cell-specific functions of PTEN in normal progenitor cells and leukemia
(a) PTEN protein levels in mouse cytokine-dependent myeloid progenitor cells (Sca1+, c-kit+, Lin), IL-7 dependent pre-B cells, BCR-ABL1-transformed myeloid and pre-B leukemia. PTEN/β-actin densitometry ratios were normalized to ratios calculated for myeloid progenitor cells. P-values were calculated by Student’s t test. Representative blot, n = 3. (b) Western blot measurement for PTEN in patient-derived CML samples (n = 5) and patient derived B-lineage ALL (n = 5). PTEN/β-actin densitometry ratios were calculated and the P = 0.00001 was calculated by Student’s t test. (c, d) The percentages of viable cells were measured after Cre–induced Pten deletion in myeloid progenitor cells (c, left) and pre-B cells (c, right) and their BCR-ABL1 transformed counterparts CML-like (d, left) and pre-B ALL (d, right) cells. P values were calculated using contingency tables. (e) The protein expression of cell cycle checkpoint molecules Arf, p53 and p21 after deletion of Pten in BCR-ABL1-transformed myeloid leukemia and pre-B ALL. Representative blot, n = 2. (f) Measuring total and phosphorylated form of p53 after 48 hours of Cre-induced Pten deletion in BCR-ABL1-transformed pre-B ALL in the presence of AKT inhibitor (AZD, 3 μmol/L) or vehicle. Representative blot, n = 3. (g) Glucose consumption, lactate production, and ATP levels were measured on day two following induction of Cre in Ptenfl/fl BCR-ABL1-transformed pre-B ALL or myeloid reprogrammed cells. Values obtained were normalized to number of viable cells and are shown as average relative levels. P values were calculated by Student’s t test. β-actin was used as loading control (ab, ef). Error bars (cd, g) represent SD of the mean.
Figure 6
Figure 6. Small molecule inhibitor of PTEN is specifically toxic in pre-B ALL
(a) Validating PTEN knockdown by two shRNA against PTEN using β-actin as loading control. Representative blot, n = 3. P values were calculated by Student’s t test comparing each PTEN shRNA to the scrambled shRNA. (b) Measuring the viability of three CML cell lines (KYO-1, KU812, JURL-MK1) and three patient derived pre-B ALL xenografts (LAX7R, LAX2 and ICN12) after transduction with two shRNA against PTEN and a scrambled sequence. P values were calculated using contingency tables comparing average viability of cells for each shRNA vs scrambled control. (c) Chemical structures of PTEN inhibitor SF1670. (d) Western blot measuring the activity AKT signaling pathway after treatment of two pre-B ALL cases with SF1670 (10 μmol/L). β-actin was used as loading control. Representative blot, n = 4. (e) Cell viability assay after SF1670 treatment of human pre-B ALL (n = 5, red) and CML (n = 3, green) cases. P < 0.0001 was calculated using contingency table comparing Pre-B ALL vs CML cells. Error bars represent SD. (f) Western blot measurement of p21, p53 and p53 (Ser15) on a pre-B ALL cells treated with SF1670 (10 μmol/L). β-actin was used as loading control. Representative blot, n = 3. (g) Cell viability assay after SF1670 treatment of BCR-ABL1- transformed pre-B ALL cells with or without Tp53 deletion. Error bars represent SD. P < 0.001 was calculated by contingency table. (h) Measuring viability of two pre-B ALL cases treated for only 1 or 3 h with SF1670 (10 μmol/L) for three consecutive days. P values were calculated by contingency table comparing average cell viability after each treatment with vehicle treated cells. The results are representative of three independent experiments. (i) Measuring Glucose consumption, lactate production, and ATP levels were after 24 hours treatment of CML cell line (KYO-1) and patient derived pre-B ALL case (LAX7R) with SF1670 (2.5 μmol/L). Values obtained were normalized to number of viable cells and are shown as average relative levels. P values were calculated by Student’s t test. Error bars represent SD.

Comment in

Similar articles

Cited by

References

    1. Osmond DG. Proliferation kinetics and the lifespan of B cells in central and peripheral lymphoid organs. Curr Opin Immunol. 1991;3:179–185. - PubMed
    1. Wardemann H, et al. Predominant autoantibody production by early human B cell precursors. Science.; 2003;301:1374–1377. - PubMed
    1. Keenan RA, et al. Censoring of autoreactive B cell development by the pre-B cell receptor. Science.; 2008;321:696–699. - PubMed
    1. Srinivasan L, et al. PI3 kinase signals BCR-dependent mature B cell survival. Cell. 2009;139:573–586. - PMC - PubMed
    1. Ramadani F, et al. The PI3K isoforms p110alpha and p110delta are essential for pre-B cell receptor signaling and B cell development. Sci Signal. 2010;3:ra60. - PMC - PubMed

Publication types

MeSH terms