. 2016 Mar 14:5:e12225.
doi: 10.7554/eLife.12225.

Appetite controlled by a cholecystokinin nucleus of the solitary tract to hypothalamus neurocircuit

Affiliations

Appetite controlled by a cholecystokinin nucleus of the solitary tract to hypothalamus neurocircuit

Giuseppe D'Agostino et al. Elife. .

Abstract

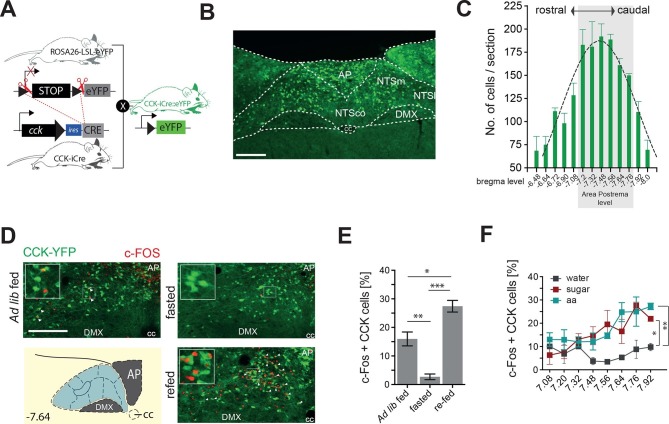
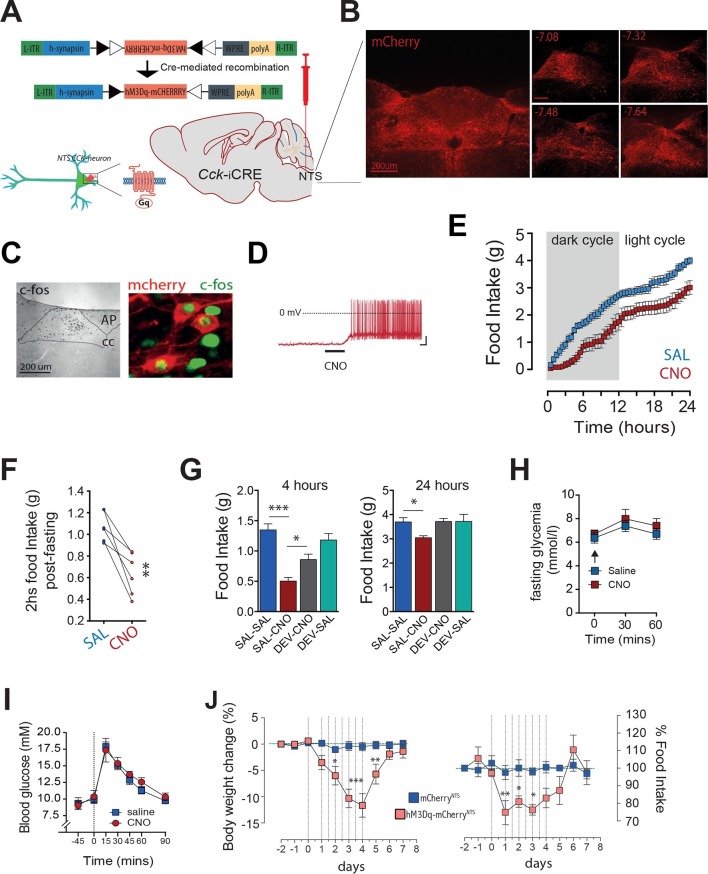
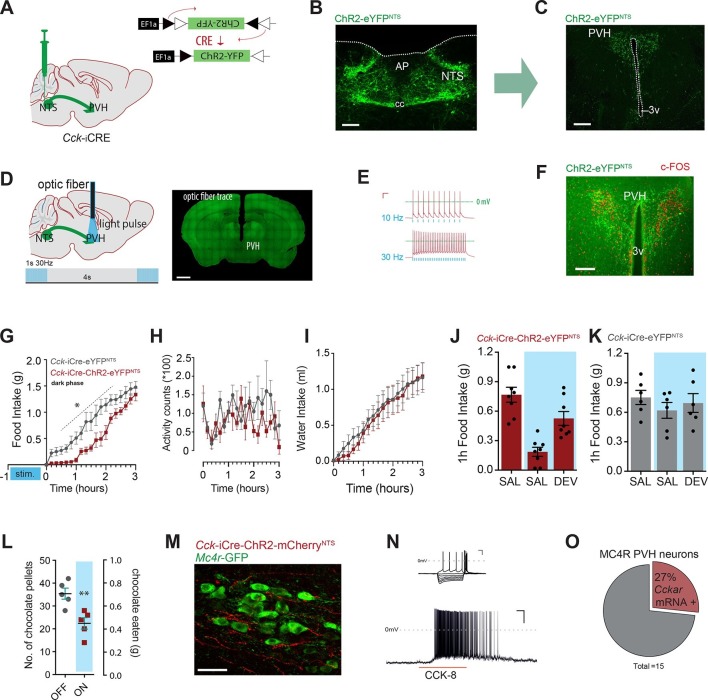
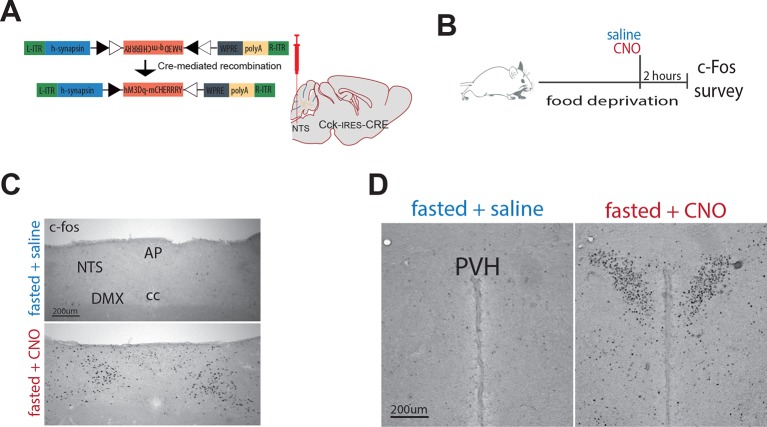
The nucleus of the solitary tract (NTS) is a key gateway for meal-related signals entering the brain from the periphery. However, the chemical mediators crucial to this process have not been fully elucidated. We reveal that a subset of NTS neurons containing cholecystokinin (CCK(NTS)) is responsive to nutritional state and that their activation reduces appetite and body weight in mice. Cell-specific anterograde tracing revealed that CCK(NTS) neurons provide a distinctive innervation of the paraventricular nucleus of the hypothalamus (PVH), with fibers and varicosities in close apposition to a subset of melanocortin-4 receptor (MC4R(PVH)) cells, which are also responsive to CCK. Optogenetic activation of CCK(NTS) axon terminals within the PVH reveal the satiating function of CCK(NTS) neurons to be mediated by a CCK(NTS)→PVH pathway that also encodes positive valence. These data identify the functional significance of CCK(NTS) neurons and reveal a sufficient and discrete NTS to hypothalamus circuit controlling appetite.

Keywords: feeding behavior; mouse; neuronal circuits; neuropeptides; neuroscience.


Conflict of interest statement

The authors declare that no competing interests exist.

Figures

Figure 1.
Figure 1.. CCKNTSneurons are activated by feeding.
(A) Schematic of mouse crossing to generate a CCK-iCre::R26-loxSTOPlox-eYFP mouse line (CckYFP). (B) Representative expression of CckYPF in a NTS coronal section. (C) Quantification of CckYPF-expressing cells across the rostral-to-caudal extent of the NTS. (D) Representative c-Fos-IR in CckYPF NTS cells in ad libitum fed, fasted or fasted then re-fed mice (white arrows denote colocalized neurons) and (E) quantification of c-FOS-positive CckYPF NTS cells (n = 3–4; one-way ANOVA F(2,7) = 39.82, p = 0.0001; Sidak’s post hoc comparison). (F) Quantification of c-FOS-IR across the rostral-to-caudal extent of the NTS in CckYPF cells by bregma level following intragastric delivery of water, amino acids (aa) or sucrose (n = 3–5 per group; one-way ANOVA, F(2,21) = 7.280, p = 0.0040; Tukey’s post hoc comparison). *p<0.05, **p< 0.01, ***p< 0.001. Scale bar in B and D represents 200 μm. AP, area postrema; DMX, dorsal motor nucleus; NTSco, nucleus of the solitary tract, commissural part; NTSm,nucleus of the solitary tract, medial part; NTSl, nucleus of the solitary tract, lateral part. DOI: http://dx.doi.org/10.7554/eLife.12225.003
Figure 2.
Figure 2.. Activation of CCKNTS neurons reduces feeding and body weight.
(A–D) Bilateral stereotaxic injection of Cre-dependent excitatory hM3Dq-mCherry virus into the NTS of male Cck-iCre mice facilitated activation of CCKNTS neurons. (A) Schematic and Cre-mediated recombination of hM3Dq-mCherry allele. (B) Representative image of Cre-dependent expression of hM3Dq-mCherry within the caudal aspect of the NTS of a Cck-iCre mouse (coronal sections; numbers indicate bregma levels, scale bar represents 200 μm). (C) c-Fos-IR in the NTS and co-expression (green) in hM3Dq-mCherry-transduced CCKNTS neurons (red) (scale bar represents 200 μm). (D) Membrane potential and firing rate of Cck-iCre-hM3Dq-mCherryNTS neurons increased upon 5 μM CNO application. (E) Cck-iCre-hM3Dq-mCherryNTS mice exhibited a significant reduction of spontaneous feeding following CNO, compared to saline, administration (n = 6; RM ANOVA, main effect of treatment [F(1,5) = 22.41, p = 0.0052], main effect of time [F(47,235) = 101.6, p<0.0001], and interaction [F(47,235) = 1.807, p = 0.0023]); tick marks on x-axis represent 3 hr, measurements collected with 30-min intervals) and (F) a reduction of post-fast re-feeding following CNO compared to saline administration (n = 6; paired t test, t(5) = 4.769, p = 0.005). (G) CNO-induced reduction in spontaneous feeding was attenuated by pre-treatment with the CCK-A-receptor antagonist, devazepide (DEV; 1 mg/kg), (n = 6; ANOVA, F(3,20) = 16.81, p<0.0001; Sidak’s post hoc comparison ***p<0.001, *p< 0.05). (H) CNO did not change fasting glucose level or (I) glucose disposal rate following a systemic glucose load (1 g/kg, IP). (J) Repeated CNO administrations over 4 days reduced body weight (n = 6; RM ANOVA, main effect of treatment [F(1,100) = 60.78, p<0.0001], main effect of time [F(9,100) = 8.877, p<0.0001], and interaction [F(9,100) = 7.483, p<0.0001]) and decreased food intake (main effect of treatment [F(1,100) = 16.13, p = 0.0001], main effect of time [F(9,100) = 4.106, p = 0.0002], and interaction [F(9,100) = 3.307, p = 0.0014]; Sidak’s post hoc comparisons, *p<0.05, **p<0.01, ***p<0.001) in Cck-iCre-hM3Dq-mCherryNTS as compared to Cck-iCre-mCherryNTS mice. DOI: http://dx.doi.org/10.7554/eLife.12225.004
Figure 3.
Figure 3.. Activation of CCKNTS neurons efferent to the PVH suppresses appetite.
(A) Schematic of CCKNTS→ PVH targeting strategy using bilateral NTS delivery of Cre-dependent ChR2-eYFP expressing vector in Cck-iCre mice. (B) Selective eYFP expression following Cre-mediated recombination in the caudal aspect of the NTS (scale bar represents 200 μm). (C) CCKNTS efferents (green) innervate the PVH (scale bar represents 400 μm). (D) CCKNTS axon targeting for photostimulation, positioning of the optic fiber and photostimulation parameters (scale bar represents 400 μm). (E) Current clamp recording of a CCKNTS neuron expressing ChR2 (scale bar 20 mV/100 ms). (F) Bilaterally transduced CCKNTS axons in the PVH and c-Fos-IR following PVH photostimulation (scale bar represents 200 μm). (G) In vivo optogenetic photostimulation of NTSCCK→PVH terminals in Cck-iCre-ChR2-eYFPNTS significantly reduced nocturnal feeding (n = 6, RM ANOVA: main effect of treatment (F(1,10) = 8.663, p = 0.0147), main effect of time (F(18,180) = 97.25, p<0.0001) and interaction (F(18,180) = 2.788, p = 0.0003) Sidak’s post hoc comparisons, *at least p<0.05) (H) without altering locomotor activity (RM ANOVA: main effect of treatment (F(1, 10) = 1.510, p = 0.0.2472), main effect of time (F(18,180) = 1.797, p = 0.0285) and interaction (F(18,180) = 1.198, p = 0.2671) or (I) water consumption (RM ANOVA: main effect of treatment (F(1,10) = 0.0924, p = 0.7673), main effect of time (F(18,180) = 50.68, p<0.0001) and interaction (F(18,180) = 0.2666, p = 0.9989) as compared to control Cck-iCre-eYFPNTS. Tick marks on x-axis represent 10-min intervals. (J) Real time food intake reduction following optogenetic activation of NTSCCK→PVH terminals in fasted Cck-iCre-ChR2-eYFPNTS and reversion following injection of CCK-A receptor antagonist (devazipide; DEV) (n = 8; RM one-way ANOVA, treatment F(1.809,12.66) = 16.15, p = 0.0004; individual F(7,14) = 0.4241, p = 0.8714, Sidak’s post hoc comparison **p<0.005, *p<0.05). (K) Neither photostimulation nor DEV treatment alter food intake in fasted Cck-iCre-eYFPNTS control mice (n = 6; RM one-way ANOVA, treatment F(1.294,6.469) = 1.486, p = 0. 2780; individual F(5,10) = 5.089, p = 0.014). (L) Photostimulation of NTSCCK→PVH terminals reduces total intake of chocolate pellets over 30 min following 18–20 hr of food deprivation (n = 5, paired two-tailed t-test, t(4) = 6.949, p = 0.0023), as compared to no photostimulation. (M) Representative confocal image of NTSCCK→PVH mCherry fibers and varicosities in close apposition to putative PVH MC4R-GFP neurons (scale bar represents 20 μm; 10 μm stack, maximum intensity projection). (N) Top, IV relationship of a PVH MC4R-GFP neuron produced by the superimposition of membrane potential deflection in response to a series of current injections of constant increment (scale bar 20 mV/200 ms); bottom, current clamp recording of the above neuron following bath application of CCK-8 (500 nM; scale bar 20 mV/30 s). (O) Percentage of PVH MC4R-neurons expressing CCK-A receptor mRNA as assessed by single-cell qPCR. NTS, nucleus of the solitary tract; PVH, paraventricular nucleus of the hypothalamus; AP, area postrema; cc, central canal; 3v, third ventricle. DOI: http://dx.doi.org/10.7554/eLife.12225.005
Figure 3—figure supplement 1.
Figure 3—figure supplement 1.. Chemogenetic activation of CCKNTS neurons elicits c-Fos in the paraventricular nucleus of the hypothalamus (PVH).
(A) Schematic and Cre-mediated recombination of hM3Dq-mCherry vector. (B) Cck-iCre-hM3Dq-mCherryNTS mice were food deprived overnight and then treated with a single systemic injection of CNO (0.3 mg/kg; IP) or vehicle. 2 hr following CNO injection, mice were transcardially perfused with saline then fixative, brains extracted and processed for c-Fos immunohistochemistry (c-Fos-IR). Compared to saline, CNO administration increased c-Fos-IR in the (C) NTS and (D) PVH of Cck-iCre::hM3Dq-mCherryNTS mice. AP, area postrema; NTS, nucleus of the solitary tract; cc, central canal; DMX, dorsal motor nucleus of the vagus; PVH, paraventricular nucleus of the hypothalamus. Scale bar represents 200 μm. DOI: http://dx.doi.org/10.7554/eLife.12225.006
Figure 3—figure supplement 2.
Figure 3—figure supplement 2.. Hypothalamic projections of CCKNTS neurons.
Representative hypothalamic coronal sections from a Cck-iCre-ChR2-eYFPNTS mouse. Scale bar represents 200 μm. 3v, third ventricle; AHA, anterior hypothalamic (hyp) area, anterior part; AHP, anterior hyp area, posterior part; Arc, arcuate hyp nucleus; DM, dorsomedial hyp nucleus; DMD, dorsomedial hyp nucleus dorsal; DMV, dorsomedial hyp nucleus ventral; f, fornix; LA, lateroanterior hyp nucleus; LH, lateral hyp area; ME, median eminence; mt, mamillothalamic tract; opt, optic tract; Pe, periventricular hyp; PVH, paraventricular nucleus of the hypothalamus; SCh, suprachiasmatic nucleus; VMH, ventromedial hyp nucleus; ZI, zona incerta. DOI: http://dx.doi.org/10.7554/eLife.12225.007
Figure 3—figure supplement 3.
Figure 3—figure supplement 3.. Subset of PVH MC4R neurons express CCKA receptor and are responsive to CCK.
(A) Schematic of mouse crossing to generate a Mc4r-t2a-Cre::tdTomato mouse line. (B) Schematic of PVH location in a coronal hypothalamic section. (C) CT values for individual Mc4r-t2a-Cre::tdTomato PVH neurons used for single-cell qPCR of isolated cells. Cckar mRNA was detected in 4 out of 15 analyzed cells. Cell No. 9 was considered negative. (D) Representative traces from current clamp recording of a Mc4r-t2a-Cre::tdTomato PVH neuron activated following bath application of CCK-8 (100 nM; 6/20 cells) and blockade in presence of the CCK-A receptor antagonist SR 27,897 (250 nM; 0/11 cells). Scale bar 20 mV/1 min. DOI: http://dx.doi.org/10.7554/eLife.12225.008
Figure 4.
Figure 4.. CCKNTS neurons signal positive valence via the PVH.
(A and D) Experimental strategies for the interrogation of the valence encoded by NTSCCK→PVH terminals. (B) Food-deprived Cck-iCre-ChR2-eYFPNTS mice exhibited a significant place preference for the photostimulation-paired chamber during a real-time place preference assay, as compared to control Cck-iCre-eYFPNTS mice (n = 5–6; Two-way ANOVA – fed: no effect of photostimulation (F(1,18) = 0.3244, p = 0.5760), no effect of ChR2 (F(1,18) = 0.001145, p = 0.9734) or interaction (F(1,18) = 0.5007, p = 0.4883); food deprived: main effect of photostimulation (F(1,18) = 5.289, p = 0.0336), no effect of ChR2 (F(1,18) = 0.08811, p = 0.7700) and interaction (F(1,18) = 12.63, p = 0.0023); Sidak’s post hoc comparisons,*p = 0.05). (C) Representative real-time place preference location plots one representative mouse per condition. (E) Cck-iCre-ChR2-eYFPNTS developed preference for the photostimulation-paired arm in a three-trial T-maze test (n = 5–6, main effect of treatment (F(1,27) = 15.93, p = 0.0005) main effect of trials (F(2,27) = 3.36, p = 0.0498) and interaction (F(2,27) = 4.36, p = 0.0228); Sidak’s post hoc comparisons, ***p<0.001), as compared to Cck-iCre::eYFPNTS. (F) Representative T-maze location plots from one representative mouse per condition. NTS, nucleus of the solitary tract; PVH, paraventricular nucleus of the hypothalamus. DOI: http://dx.doi.org/10.7554/eLife.12225.009

Comment in

References

    1. Alexander GM, Rogan SC, Abbas AI, Armbruster BN, Pei Y, Allen JA, Nonneman RJ, Hartmann J, Moy SS, Nicolelis MA, McNamara JO, Roth BL. Remote control of neuronal activity in transgenic mice expressing evolved G protein-coupled receptors. Neuron. 2009;63:27–39. doi: 10.1016/j.neuron.2009.06.014. - DOI - PMC - PubMed
    1. Appleyard SM, Bailey TW, Doyle MW, Jin YH, Smart JL, Low MJ, Andresen MC. Proopiomelanocortin neurons in nucleus tractus solitarius are activated by visceral afferents: regulation by cholecystokinin and opioids. Journal of Neuroscience. 2005;25:3578–3585. doi: 10.1523/JNEUROSCI.4177-04.2005. - DOI - PMC - PubMed
    1. Balthasar N, Dalgaard LT, Lee CE, Yu J, Funahashi H, Williams T, Ferreira M, Tang V, McGovern RA, Kenny CD, Christiansen LM, Edelstein E, Choi B, Boss O, Aschkenasi C, Zhang Chen-yu, Mountjoy K, Kishi T, Elmquist JK, Lowell BB. Divergence of melanocortin pathways in the control of food intake and energy expenditure. Cell. 2005;123:493–505. doi: 10.1016/j.cell.2005.08.035. - DOI - PubMed
    1. Blevins JE, Stanley BG, Reidelberger RD. Brain regions where cholecystokinin suppresses feeding in rats. Brain Research. 2000;860:1–10. doi: 10.1016/S0006-8993(99)02477-4. - DOI - PubMed
    1. Blouet C, Schwartz GJ. Brainstem nutrient sensing in the nucleus of the solitary tract inhibits feeding. Cell Metabolism. 2012;16:579–587. doi: 10.1016/j.cmet.2012.10.003. - DOI - PMC - PubMed

Publication types

Substances

LinkOut - more resources