

doi: 10.1021/jacs.5b11606.
Epub 2016 Mar 14.
Calcium Uncaging with Visible Light
Affiliations
- PMID: 26974387
- PMCID: PMC4851165
- DOI: 10.1021/jacs.5b11606
Item in Clipboard
Calcium Uncaging with Visible Light
J Am Chem Soc.
.
Abstract
We have designed a nitroaromatic photochemical protecting group that absorbs visible light in the violet-blue range. The chromophore is a dinitro derivative of bisstyrylthiophene (or BIST) that absorbs light very effectively (ε440 = 66,000 M(-1) cm(-1) and two-photon cross section of 350 GM at 775 nm). We developed a "caged calcium" molecule by conjugation of BIST to a Ca(2+) chelator that upon laser flash photolysis rapidly releases Ca(2+) in <0.2 ms. Using the patch-clamp method the optical probe, loaded with Ca(2+), was delivered into acutely isolated mouse cardiac myocytes, where either one- and two-photon uncaging of Ca(2+) induced highly local or cell-wide physiological Ca(2+) signaling events.
Figures
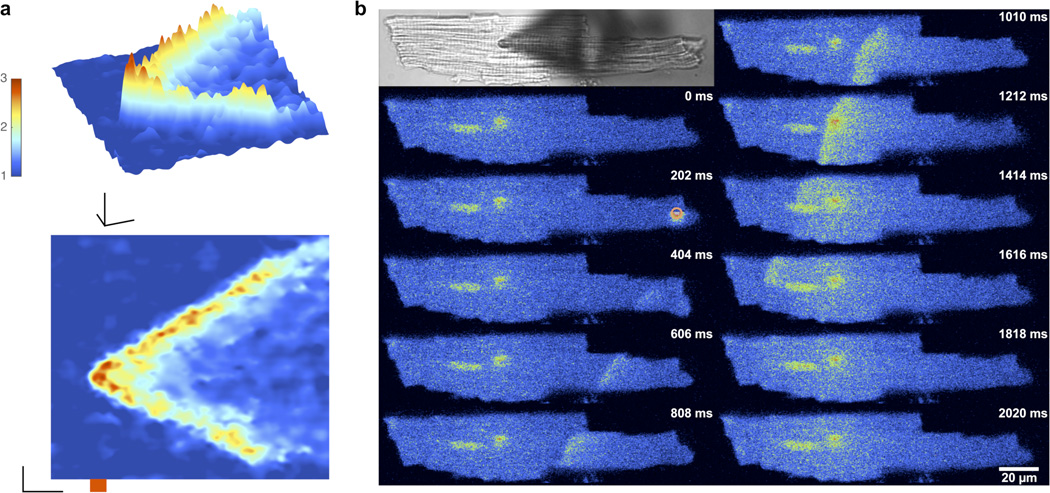
Reagents and conditions: (a) Carboxymethyl-4-cyanophenylmethylsulfonium trifluoromethanesulfonate, Cs2CO3, THF; (b) diethylene glycol, NaH; (c) CBr4, PPh3, DCM; (d) NaN3, Nal, DMF; (e) Pd(PPh3)4, 2,4,6-trivinyl-boroxin pyridine complex, K2CO3, DME, H2O; (f) dibromothiophene, Pd(OAc)2, LiCI, TBACI, NaHCO3, DMF; (g) PPh3, dioxane, NaOH (aq); (h) BrCH2COOEt, pentamethylpiperidine, acetonitrile; (i) KOH, MeOH (note for clarity the countercation is not shown); (j) CaCI2 in H2O (note for clarity the ionic valence and counterion are not depicted).
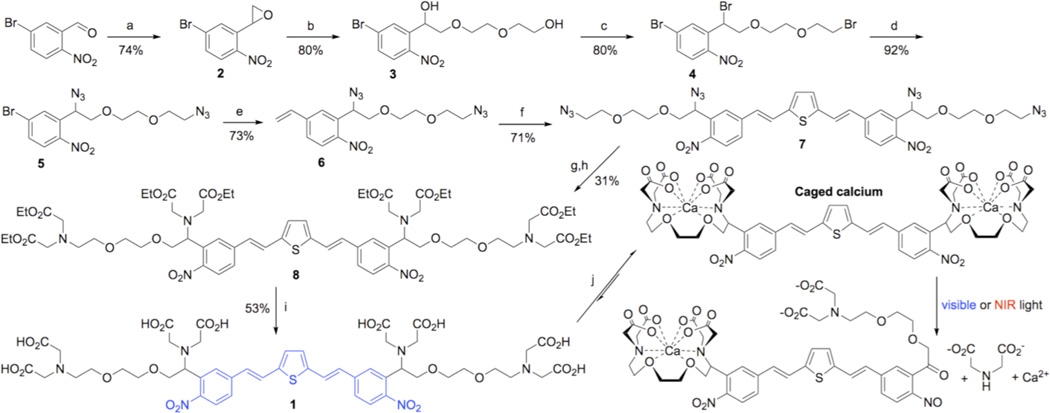
Nonlinear absorption properties of BIST derivatives were measured using the z-scan technique or by 2P fluorescence emission. Rapid changes in [Ca2+]free were monitored in point scan mode (10 µs per pixel) or in bidirectional line scanning mode (244 µs per line) using laser-scanning confocal microscopy at 561 or 473 nm after 2P photolysis with a mode-locked Ti:sapphire laser tuned to 810 or 720 nm. (a) Absorption spectra of the BIST-2EGTA (blue) and ortho-nitroveratryl (DM-nitrophen, violet) chromophores showing their relative 1P maxima. (b) 2P absorption spectra of BIST derivatives. Compound 9 had a 2P absorption maximum in DMSO of 740 GM at 775 nm (orange). Each data point is an average of 5 or 6 measurements. Compounds 10a (R purple) and 10b (R green) have a 2P absorption maximum in DMSO of 350 GM at 775 nm. All points are shown ± SD. (c) Example of Ca titration of a solution of BIST-2EGTA with X-rhod-1. Addition of 0.1 mM amount of CaCI2 to a solution of BIST-2EGTA (0.5 mM) at pH 7.2 with KCI (100 mM) showed the chelator had a high prephotolysis affinity for Ca2+. (d) 2P uncaging of BIST-2EGTA produced a rapid increase in Ca monitored by point scan confocal imaging using rhod-FF. The exponential time-constant for the fluorescence increase was 164 µs. (e) The relative efficacy of 2P uncaging of DM-nitrophen at 810 and 720 nm was determined by monitoring the photoreleased Ca2+ during a power train at these two wavelengths. Both wavelengths showed a quadratic dependence on incident power, and release was 7.4 ± 0.23 times more effective at 720 nm (closed red diamonds) compared to 810 nm (open black diamonds). fluo-3 was used to monitor Ca2+ release. (f) Ca2+ release from BIST-2EGTA:Ca2+ complex at 810 and 720 nm was determined by monitoring the fluorescence signal from rhod-FF during a power train at these two wavelengths (810, open black squares; 720 closed red squares). The increase in fluorescence showed a quadratic dependence on incident power and was equally effective at both wavelengths. An identical power train was also used for photolysis of DM-nitrophen (720, closed red diamonds). The resting [Ca2+]free, the Ca2+-bound, and Ca2+-free indicator concentrations were the same for both caged calcium compounds.
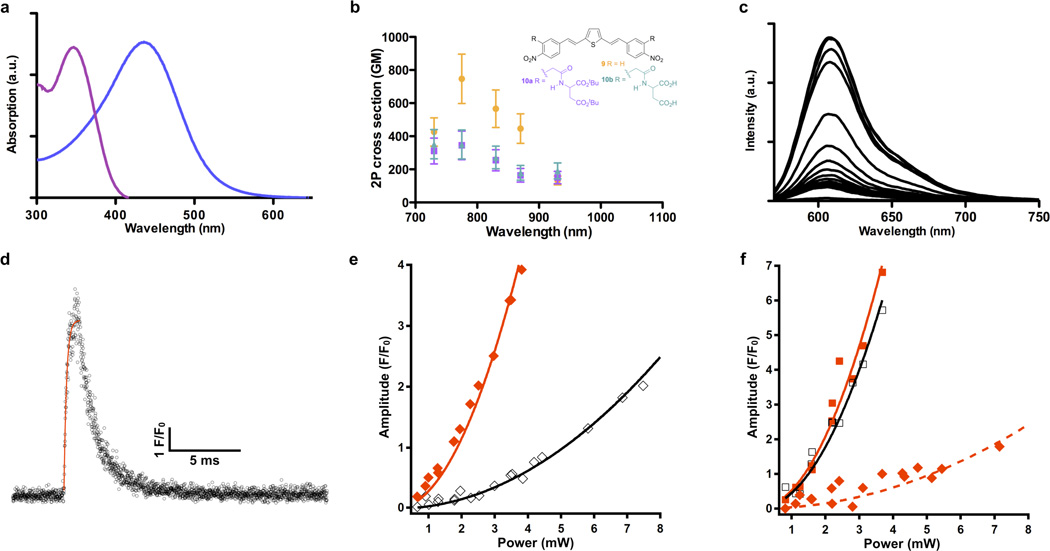
Single cardiac myocytes were loaded via a patch pipette with BIST-2EGTA and rhod-2. Changes in [Ca2+]free were monitored in line scan mode (2.116 ms per line) using laser-scanning confocal microscopy at 561 nm after 2P uncaging at the center of the line with a mode-locked Ti:sapphire laser tuned to 810 nm. Line scan data are displayed as 3D surface plots (time in x, space in y and fluorescence as F/F0 on a pseudo-color scale in z) with the corresponding 2D plots (time in x and space in y) below each 3D panel. Scale bars are 1 F/F0, 5 µn and 50 ms. (a) Point 2P irradiation with 5 ms pulse (red bar) triggered local Ca2+-induced Ca2+ release from the SR. (b) Photolysis of BIST-2EGTA produced highly spatially confined Ca2+ release. The cell was treated with caffeine (20 mM) to unload the Ca2+ from the SR. (c) Increasing pulse duration to 20 ms initiated a Ca2+ “mini” wave, with discrete Ca2+ release events apparent beyond the initial uncaging location, (d) Reducing pulse duration to 1 ms produced rapid, efficient and highly localized Ca2+-induced Ca2+ release, (e) Pure photolytic release of Ca2+ from BIST-2EGTA during irradiation for 1 ms (cell treated with caffeine as in b).
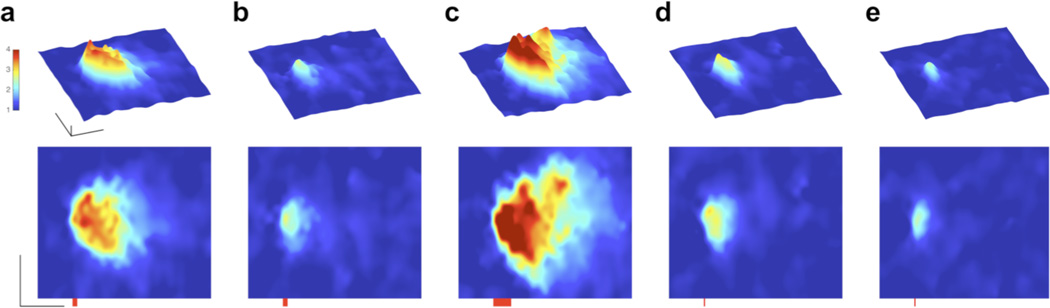
Single cardiac myocytes were loaded via a patch pipette with BIST-2EGTA and X-rhod-5F or rhod-2. Changes in [Ca2+]free were monitored in line scan (x,t) mode (2.116 ms per line) using laser-scanning confocal microscopy at 561 nm after 2P uncaging at the center of the line or by whole cell frame scan (202 ms per frame, 406 × 96 pixels) imaging after uncaging with visible light. A mode-locked Ti:sapphire laser tuned to 810 nm was used for 2P excitation (20 mW, 20 ms). A 405-nm continuous-wave laser was used for uncaging with visible light (10 mW, 100 ms). Line scan data are displayed as 3D surface plots (time in x, space in y and fluorescence as F/F0 on a pseudo-color scale in z) with the corresponding 2D plots (time in x and distance in y) below, (a) Rapid line scan confocal imaging revealed 2P excitation (20 ms, red bar) could initiate Ca2+ signals that propagated extensively in both directions away from the initial uncaging position. Scale bars for units of 1 F/F0, 5 µn and 50 ms. (b) Uncaging with visible light (orange circle) initiated a Ca2+ wave that propagated throughout the cell. Top left is a transmitted light image of the cell with the pipette seen as a shadow. Pseudocolor images represent raw fluorescence intensity data. Frame sequence is top left to bottom left, followed by top right to bottom right. The nucleus and patch pipette can be seen as bright structures in the left portion of the cell. The time stamp is from the beginning of each frame.
References
-
- Brieke C, Rohrbach F, Gottschalk A, Mayer G, Heckel A. Angew Chem Int Edit. 2012;51:8446–8476. - PubMed
-
- Barltrop JA, Plant PJ, Schofield P. Chem. Commun. 1966:822–823.
-
- Kaplan JH, Forbush B, Hoffman JF. Biochemistry. 1978;17:1929–1935. - PubMed
-
- McGall GH, Barone AD, Diggelmann M, Fodor SPA, Gentalen E, Ngo N. J. Am. Chem. Soc. 1997;119:5081–5090.
Publication types
MeSH terms
Substances
Grants and funding
LinkOut - more resources
Full Text Sources
Other Literature Sources
Miscellaneous
