. 2016 Jun;15(6):662-8.
doi: 10.1038/nmat4585. Epub 2016 Mar 14.

Paramagnetic fluorinated nanoemulsions for sensitive cellular fluorine-19 magnetic resonance imaging

Affiliations

Paramagnetic fluorinated nanoemulsions for sensitive cellular fluorine-19 magnetic resonance imaging

Alexander A Kislukhin et al. Nat Mater. 2016 Jun.

Abstract

Fluorine-19 magnetic resonance imaging ((19)F MRI) probes enable quantitative in vivo detection of cell therapies and inflammatory cells. Here, we describe the formulation of perfluorocarbon-based nanoemulsions with improved sensitivity for cellular MRI. Reduction of the (19)F spin-lattice relaxation time (T1) enables rapid imaging and an improved signal-to-noise ratio, thereby improving cell detection sensitivity. We synthesized metal-binding β-diketones conjugated to linear perfluoropolyether (PFPE), formulated these fluorinated ligands as aqueous nanoemulsions, and then metallated them with various transition and lanthanide ions in the fluorous phase. Iron(III) tris-β-diketonate ('FETRIS') nanoemulsions with PFPE have low cytotoxicity (<20%) and superior MRI properties. Moreover, the (19)F T1 can readily be reduced by an order of magnitude and tuned by stoichiometric modulation of the iron concentration. The resulting (19)F MRI detection sensitivity is enhanced by three- to fivefold over previously used tracers at 11.7 T, and is predicted to increase by at least eightfold at the clinical field strength of 3 T.


Figures

Figure 1
Figure 1. Comparison of iron and gadolinium diketonates (H-fod) as 19F relaxation agents for PFPE
The relaxometry results (9.4 T) are displayed for PFPE emulsions (120 g/L PFPE) containing H-fod (2.8 mM) 24 hours after the addition of 0.7 mM metal ions. R1 and R2 values are reported for the main PFPE peak at −91.4 ppm. The results show that Fe3+ is a more effective R1 agent than Gd3+.
Figure 2
Figure 2. Preparation and characterization of metal-binding nanoemulsions for 19F MRI
a, Synthesis of metal-binding fluorinated diketones (FDK) from PFPE-OMe (denoted as RFCO2Me). b, Structures of fluorocarbons used for 19F MRI. c, Composition and preparation of various metal-binding (A, B, D, F, G) and control (C, E) fluorocarbon nanoemulsions. d, 19F NMR spectra (11.7 T) of emulsions A–C (4.5 g/L 19F, 90% D2O). Signals from terminal CF2 of diketone ligands are well separated from other peaks and are used to determine ligand concentration. The peak at −76 ppm is the reference (CF3CO2Na, TFA). e, Addition of aqueous metal chlorides to FDK emulsions yields metalated emulsions; Ar = pAn. f, Absorption spectra of metal-binding emulsion B (70 µM diketone, 0.09 g/L 19F) (color) and control emulsion C (0.09 g/L) (---) in the presence of Fe3+. Increasing [Fe3+] causes the appearance of ferric tris-diketonate charge transfer bands at 395 and 500 nm that grow linearly in intensity until the ca. 3:1 ligand:Fe ratio is reached at 25 µM Fe3+.
Figure 3
Figure 3. Fluorine-19 relaxometry of metalated PFPE emulsions
a, R1 and 19F NMR spectra of FETRIS nanoemulsion (4.5 g/L 19F, 3.5 mM diketone) in the presence of 0.5 mM metal ions, 15 mM HEPES, and at pH 7.4. The peaks from different 19F spectra are scaled to the same absolute intensity. b, Relaxometric analysis of Fe3+ and Gd3+ binding capacity. Shown are measurements of R1 for both PFPE (fluorous phase) and trifluoroacetate reference (TFA) added to the aqueous phase. c, Magnetic field dependence at T = 295 K and d, temperature (B0 = 9.4 T) dependence of observed relaxation rates R1 (●) and R2 (x) in FETRIS nanoemulsion (22.5 g/L 19F, 17.5 mM diketone, 2.8 mM Fe3+) and predicted R1 (—) values using Eqs. S1–S4. Predicted R1 values represent best fit to SBM equations, with r = 1.19 nm, τF (295 K) = 0.80 ns, τv (295 K) = 3.59 ps, the Arrhenius temperature dependence with activation energies of 3.6 kcal/mol for τF and 4.5 kcal/mol for τv. The diamagnetic contributions to R1 are presumed to be negligible and Δ fixed at 0.2 cm−1. R1 values increase, while R2 values decrease, at lower magnetic field strengths, suggesting that there will be no degradation of SNR at clinical fields due to line broadening.
Figure 4
Figure 4. Relaxometry stability of FETRIS nanoemulsions in the presence of competing aqueous ligand
Nanoemulsion B and F, both metalated with 0.7 mM Fe3+, were treated at 37 °C with 75 mM EDTA dissolved in aqueous phase. Shown are R1 values of PFPE (formula image
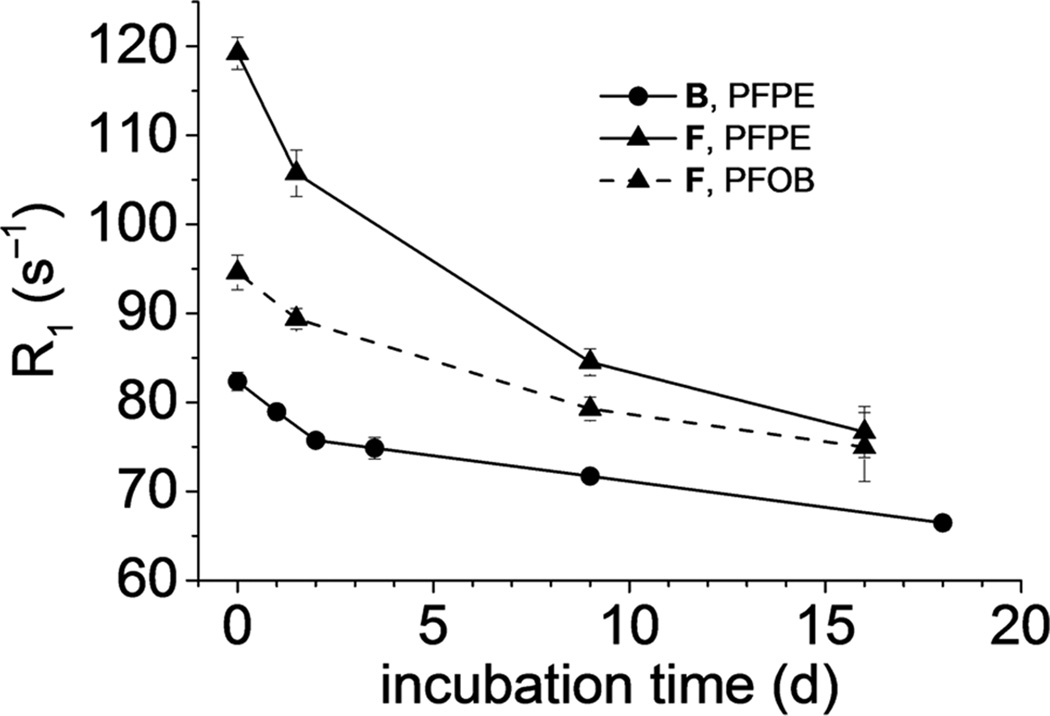
) in nanoemulsion B, and values for blend nanoemulsion F, including PFPE components (formula image) and the CF3 signal of PFOB (formula image). A slight decrease over time is observed, as slow Fe3+ efflux occurs from the fluorous phase and irreversibly binds to EDTA. Error bars are standard deviations from three independent replicates.
Figure 5
Figure 5. Cell labeling with FETRIS nanoemulsion
Cells (GL261) were labeled in culture using FETRIS nanoemulsion. a, Cell viability. b, Cell uptake of FETRIS as measured by 19F NMR. c, Correlation of uptake determined by 19F NMR with optical absorbance of cell lysate at 390 nm due to FETRIS. Error bars are standard deviations from three independent replicates.
Figure 6
Figure 6. MRI of FETRIS nanoemulsion
a. Phantom comprised of two agarose-embedded NMR tubes containing FETRIS nanoemulsion (4.5 g/L 19F) with 0.5 mM Fe3+ (R1/R2 = 32.5/170 s−1) and nanoemulsion without metal (R1/R2 2.2/3.7 s−1), denoted +Fe and −Fe, respectively. The top panel shows unthresholded 19F images, and below, the 19F image is thresholded, rendered in hot-iron pseudo-color (scale bar), and overlaid onto the grayscale 1H image. The 19F/1H MRI data were acquired using a GRE sequence. b, Displays mouse GL261 glioma cells (5×10⁶) labeled with FETRIS nanoemulsion ex vivo and injected subcutaneously into mouse flank. The 19F data is rendered in pseudo-color and placed on a grayscale slice from the 1H data. After 24 hours, mice were imaged, and a cell ‘hot-spot’ is seen on the right flank in the axial view. Cells labeled with metal-free nanoemulsion and injected on the contralateral side could not be detected. Asterisk is adjacent chemical shift displacement artifact from hyperintense subcutaneous fat at 11.7T. The 19F and 1H images were acquired using ZTE and GRE pulse sequences, respectively. For display, a co-registered 2D GRE slice was embedded into a 3D rendering of the 19F data.

References

    1. Ahrens ET, Bulte JWM. Tracking immune cells in vivo using magnetic resonance imaging. Nat Rev Immunol. 2013;13:755–763. - PMC - PubMed
    1. Ahrens ET, Flores R, Xu HY, Morel PA. In vivo imaging platform for tracking immunotherapeutic cells. Nat Biotechnol. 2005;23:983–987. - PubMed
    1. Srinivas M, Morel PA, Ernst LA, Laidlaw DH, Ahrens ET. Fluorine-19 MRI for visualization and quantification of cell migration in a diabetes model. Magn Reson Med. 2007;58:725–734. - PubMed
    1. Srinivas M, et al. In vivo cytometry of antigen-specific T cells using 19F MRI. Magn Reson Med. 2009;62:747–753. - PMC - PubMed
    1. Ahrens ET, Helfer BM, O'Hanlon CF, Schirda C. Clinical cell therapy imaging using a perfluorocarbon tracer and fluorine-19 MRI. Magn Reson Med. 2014;72:1696–1701. - PMC - PubMed

Publication types