. 2016 Apr;18(4):382-92.
doi: 10.1038/ncb3323. Epub 2016 Mar 14.

How the kinetochore couples microtubule force and centromere stretch to move chromosomes

Affiliations

How the kinetochore couples microtubule force and centromere stretch to move chromosomes

Aussie Suzuki et al. Nat Cell Biol. 2016 Apr.

Abstract

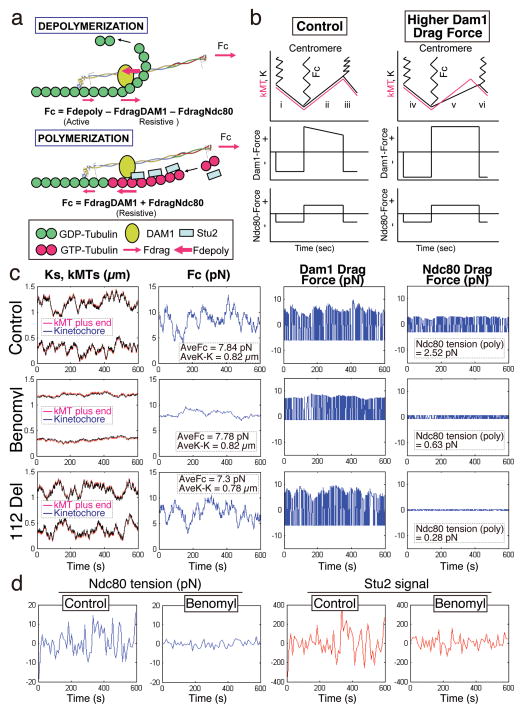
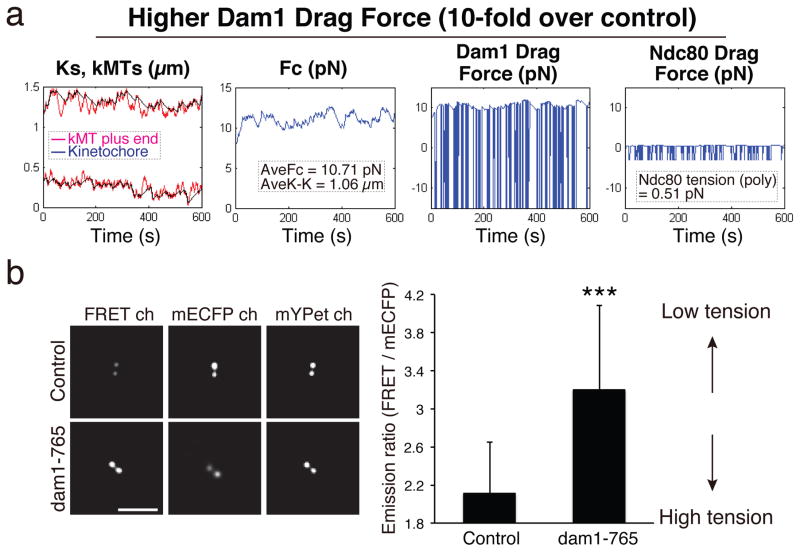
The Ndc80 complex (Ndc80, Nuf2, Spc24 and Spc25) is a highly conserved kinetochore protein essential for end-on anchorage to spindle microtubule plus ends and for force generation coupled to plus-end polymerization and depolymerization. Spc24/Spc25 at one end of the Ndc80 complex binds the kinetochore. The N-terminal tail and CH domains of Ndc80 bind microtubules, and an internal domain binds microtubule-associated proteins (MAPs) such as the Dam1 complex. To determine how the microtubule- and MAP-binding domains of Ndc80 contribute to force production at the kinetochore in budding yeast, we have inserted a FRET tension sensor into the Ndc80 protein about halfway between its microtubule-binding and internal loop domains. The data support a mechanical model of force generation at metaphase where the position of the kinetochore relative to the microtubule plus end reflects the relative strengths of microtubule depolymerization, centromere stretch and microtubule-binding interactions with the Ndc80 and Dam1 complexes.


Conflict of interest statement

Competing financial interests

The authors declare no competing financial interests.

Figures

Figure 1
Figure 1. The Ndc80 FRET Biosensor detects tension at the N-terminus of Ndc80 in vivo
(a) Cartoon of Ndc80 protein complex. We inserted FRET tension sensor at 410 aa in Ndc80 protein. This site is located between the CH and Loop domains. For a zero tension control, we fused the FRET sensor to the C-terminus of Nuf2 (Nuf2 FRET control). (b) The Ndc80 FRET biosensor exhibits higher FRET at lower tension and lower FRET at higher tension. (c) Representative FRET images (left) and Emission Ratios (right) for separated sister kinetochore clusters at metaphase for the Ndc80 FRET sensor (n = 117 kinetochore clusters) and Nuf2-FRET control (n = 100 kinetochore clusters). *** Unpaired Student t-test (two-tailed), p < 0.01. Error bars are SD from the means. The mean values were calculated using data pooled from 3 independent experiments. Scale bar is 5μm (c).
Figure 2
Figure 2. Tension during cell cycle monitored by Ndc80 FRET biosensor
(a) Cartoon of the yeast cell cycle. K-K distance is Ndc80-Ndc80 (FRET sensor) distance between sister kinetochore clusters. (b) Representative Ndc80 FRET images throughout the cell cycle. (c) The Emission Ratio for each cell cycle stage for the Ndc80 FRET biosensor (left) or Nuf2-FRET control (right, note the different scale). Interphase: n = 118 (Ndc80), 97 (Nuf2), prometaphase: n = 17 (Ndc80), metaphase: n = 117 (Ndc80), 98 (Nuf2), early/middle anaphase: n = 276 (Ndc80), 102 (Nuf2), late anaphase: n = 105 (Ndc80), 96 (Nuf2), telophase: n = 101 (Ndc80), 81 (Nuf2). n values represent the number of kinetochore clusters. *** Unpaired Student t-test (two-tailed), p < 0.01. (d) Cartoon of diploid cells expressing Ndc80-mECFP (inserted at aa 410) and Ndc80-mYPet (inserted at aa 410) (left, top). Representative FRET images of diploid cells are shown left, bottom for different cell cycle stages. The bar graph on the right shows the Emission Ratio for each stage (n = 100 kinetochore clusters each). The Emission Ratio value for no FRET (red bars) was measured by bleed-through from mECFP and cross excitation from mYPet (see Supplementary Fig. 2d and Methods). Scale bars are 2.5 μm. Error bars are SD from the means. The mean values were calculated using data pooled from 2 independent experiments. The mean values of Emission Ratio, FRET efficiency, K-K distance are listed in Supplementary Table 1.
Figure 3
Figure 3. The Tension Detected by the Ndc80 FRET Sensor Depends on the N-terminal tail of Ndc80
(a) Diagram of the yeast Ndc80 protein. The unstructured N-terminal tail domain has 7 serine or threonine targets for the Aurora B kinase. The 70 Del deleted the first 70 aa and the 112 Del deleted the first 112 aa of Ndc80 protein. (b) Representative images at metaphase, of control, 70 Del, and 112 Del mutants (left). The average Ndc80 FRET Emission Ratio for each condition is shown in the bar graph (control: 2.12 ± 0.54, n = 117, 70 Del: 2.89 ± 0.64, n = 120, 112 Del: 3.68 ± 0.76, n = 149). n values represent number of kinetochores clusters. (c) The average K-K distance for each condition of (b) (n = 100 kinetochore pairs). (d) Representative time-lapse images (top) and the mean duration from prometaphase (PM) to anaphase onset and anaphase onset to late anaphase in each condition of (b) (bottom). n = 29, 27, 25, 29, 32, 27 cells (from left to right). (e) The percentage of cells in PM (prometaphase) or M (metaphase) in each condition of (b). n = 100 kinetochore pairs. Scale bars are 1μm (a, c–d). Error bars are SD from the means, Unpaired Student t-test (two-tailed): ***p < 0.01, **p < 0.05, * < 0.1. The mean values were calculated using data pooled from 3 independent experiments (b–d) or 2 independent experiments (e). All N-terminal tail mutant proteins were expressed by the endogenous Ndc80 promoter to maintain expression level (Supplementary Figs. 3a–c). The mean values of Emission Ratio, FRET efficiency, K-K distance are listed in Supplementary Table 1.
Figure 4
Figure 4. Stu2-GFP Intensity and Ndc80 FRET Emission Ratio fluctuate in metaphase
(a) Two examples of fluctuations in Stu2-GFP intensities for separated sister kinetochore clusters (K1 and K2) in a control metaphase cell, a cell treated with low-dose benomyl, and a control cell at anaphase. K1 intensity is normalized by K2 intensity at each time point to control for fluctuations in illumination intensity (See Methods). Note, that the integrated fluorescence intensity of a sister kinetochore cluster decreases with depth into the cell beneath the coverslip surface. At metaphase both sister kinetochore clusters are at about the same depth, but in anaphase, interpolar spindle elongation often occurs at an angle to the coverslip surface, making the intensity of the sister kinetochore clusters unequal, and reducing the average value of the K1/K2 ratio from near 1 at metaphase, where K2 was the larger value. (b) Plots of normalized fluctuations in Ndc80 FRET Emission Ratio (K2/K1) from Supplementary Fig. 4b images in a control cell and a cell treated with low-dose benomyl (55 μM). (c) Representative cell showing Stu2-tdTomato and Ndc80 FRET images during metaphase and a plot of FRET emission (K1/K2) and Stu2 signal at K1 (the upper kinetochore) (See Methods and Supplementary Fig. 4c). Another example is shown in Supplementary Fig. 4d. We analyzed 12 cells from 3 independent experiments (a–c). (d) Representative images of Ndc80 FRET, mECFP, and mYpet control metaphase cells, and cells treated with benomyl (55 μM, 165 μM, or 551 μM). The bar graph shows the average Ndc80 FRET Emission Ratio and K-K distance (n = 117, 103, 105, 105 kinetochores from left to right). The mean values were calculated using data pooled from 3 independent experiments. ** Unpaired Student t-test (two-tailed), p < 0.05. Scale bars are 1 μm (a, c) and 2.5 μm (d). The mean values of Emission Ratio, FRET efficiency, K-K distance are listed in Supplementary Table 1.
Figure 5
Figure 5. Mechanical model and computer simulations for the Ndc80 force coupler at kinetochores of bi-oriented chromosomes in metaphase budding yeast
(a) A cross-section diagram of the mechanical model along a single MT protofilament during depolymerization (top) and polymerization (bottom) (See Text and Methods for details). The Dam1 complex is anchored to Ndc80 inside of the tension sensor at a site like the Ndc80 loop domain. During depolymerization, pushing force on the Dam1 complex by curling protofilaments (Fdepoly), moves the Ndc80 complex poleward at the rate of depolymerization generating a pulling force on the centromere, Fc, and generates compressive drag forces on both the MTBDs of Ndc80 (FdragNdc80) and the DAM1 complex (FdragDam1). During polymerization, the force from centromere stretch, Fc, pulls the Ndc80 complex away from the pole generating tensile drag forces on the MTBDs of Ndc80 and the Dam1 complex. At the tips of polymerizing MTs, GTP-tubulin and Stu-2 proteins increase the force on the Dam1 complex to prevent detachment from the MT tip. (b) Kinetics predicted for the Ndc80 force coupler during kMT depolymerization and polymerization at constant velocity in control (left) and higher Dam1 drag force (right). (c) Computer simulations of mechanical model in A for all 16 sister kinetochore pairs at metaphase in budding yeast for wild type (top), for low dose benomyl to reduce dynamicity (middle), and for reduced Ndc80 drag force (112 Del) (bottom). (d) The difference in fluctuations in Ndc80 tension and Stu2 concentration in simulations of wild type and low dose benomyl treated cells (See Methods and Supplementary Table 2 for more details, parameter values, and simulation results.)
Figure 6
Figure 6. The tension at Ndc80 MTBDs is dependent on Dam1 drag force
(a) Computer simulations of mechanical model for metaphase budding yeast for the condition when Dam1 drag force was increased 10-fold over control. Ndc80 tension was significantly reduced and the mean length of kMTs became longer than the mean distance of kinetochores to their poles. (b) Representative Ndc80 FRET, mECFP, and mYpet images for a control cell and a dam1-765 cell (left). The average Emission Ratio at metaphase for control (2.12 ± 0.54, n = 117) and dam1-765 cells (3.20 ± 0.88, n = 80) (right). n values represent number of kinetochores clusters. *** Unpaired Student t-test (two-tailed), p < 0.01. Error bars are SD from the means. Scale bars are 5 μm. The mean values were calculated using data pooled from 2 independent experiments. The mean values of Emission Ratio, FRET efficiency, K-K distance are listed in Supplementary Table 1.
Figure 7
Figure 7. Schematic of Force Coupler model in budding yeast metaphase
Models for the Ndc80 force coupler during polymerization in wild-type, partial and whole N-terminal tail deletion mutants. The N-terminal tail has a critical role in Ndc80 tension. Normal mean K-K stretch was maintained despite reduction (partial tail deletion) or lack (whole N-terminal tail deletion) of tension in Ndc80 at the position of the FRET sensor. During depolymerization, forces from peeling protofilaments push the Dam1 and Ndc80 complexes along kMTs toward the pole to stretch the centromere; the MTBDs of both Dam1 and Ndc80 are under compression. During polymerization, force from centromere stretch pulls the Ndc80 force coupler along kMTs with the MTBDs of Dam1 and Ndc80 under tension.

References

    1. Wang HW, et al. Architecture and flexibility of the yeast Ndc80 kinetochore complex. J Mol Biol. 2008;383:894–903. - PMC - PubMed
    1. Ciferri C, et al. Implications for kinetochore-microtubule attachment from the structure of an engineered Ndc80 complex. Cell. 2008;133:427–439. - PMC - PubMed
    1. Suzuki A, Badger BL, Salmon ED. A quantitative description of Ndc80 complex linkage to human kinetochores. Nature communications. 2015;6:8161. - PMC - PubMed
    1. Wei RR, Al-Bassam J, Harrison SC. The Ndc80/HEC1 complex is a contact point for kinetochore-microtubule attachment. Nature structural & molecular biology. 2007;14:54–59. - PubMed
    1. Hsu KS, Toda T. Ndc80 internal loop interacts with Dis1/TOG to ensure proper kinetochore-spindle attachment in fission yeast. Current biology: CB. 2011;21:214–220. - PMC - PubMed

Publication types

MeSH terms