. 2016 Mar 15:6:23077.
doi: 10.1038/srep23077.

Growth inhibition and apoptosis in cancer cells induced by polyphenolic compounds of Acacia hydaspica: Involvement of multiple signal transduction pathways

Affiliations

Growth inhibition and apoptosis in cancer cells induced by polyphenolic compounds of Acacia hydaspica: Involvement of multiple signal transduction pathways

Tayyaba Afsar et al. Sci Rep. .

Abstract

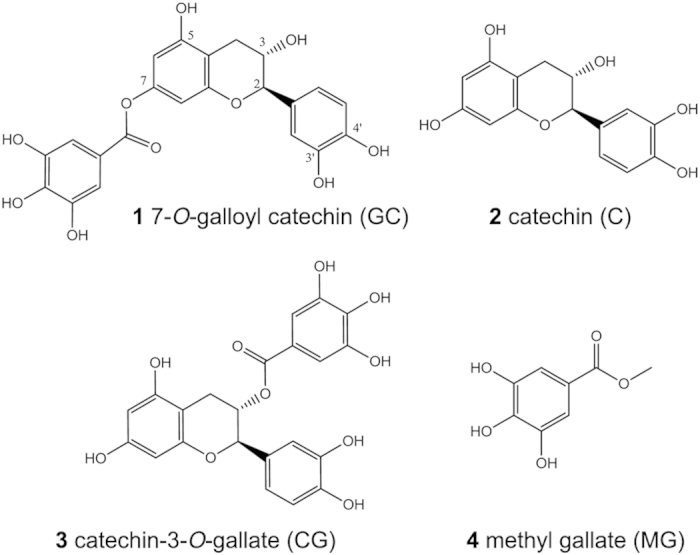
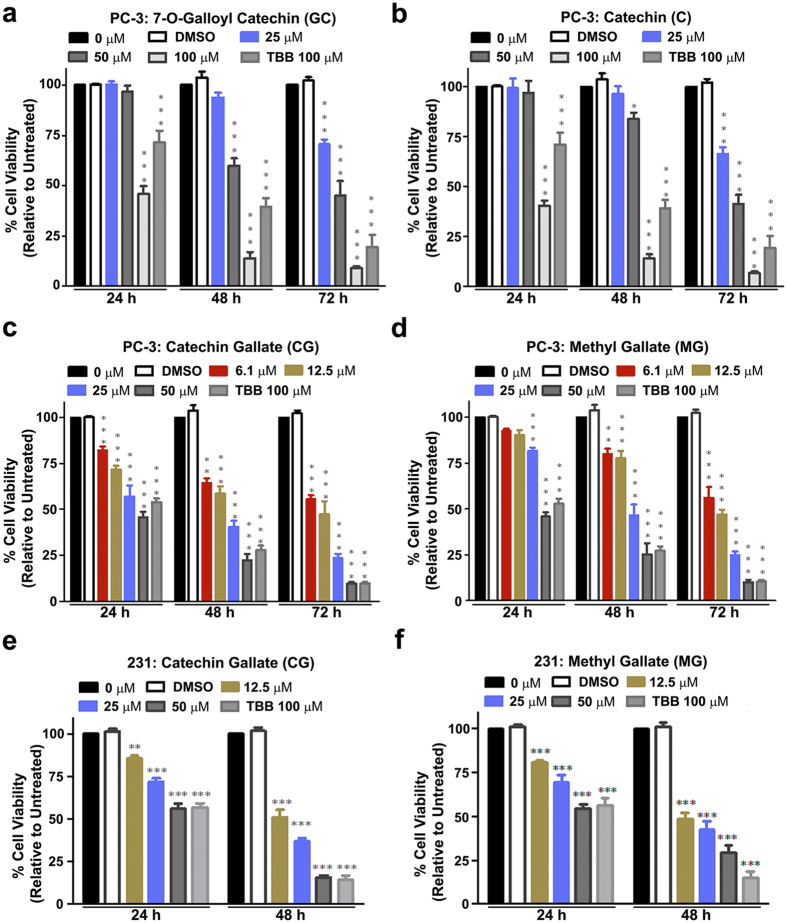
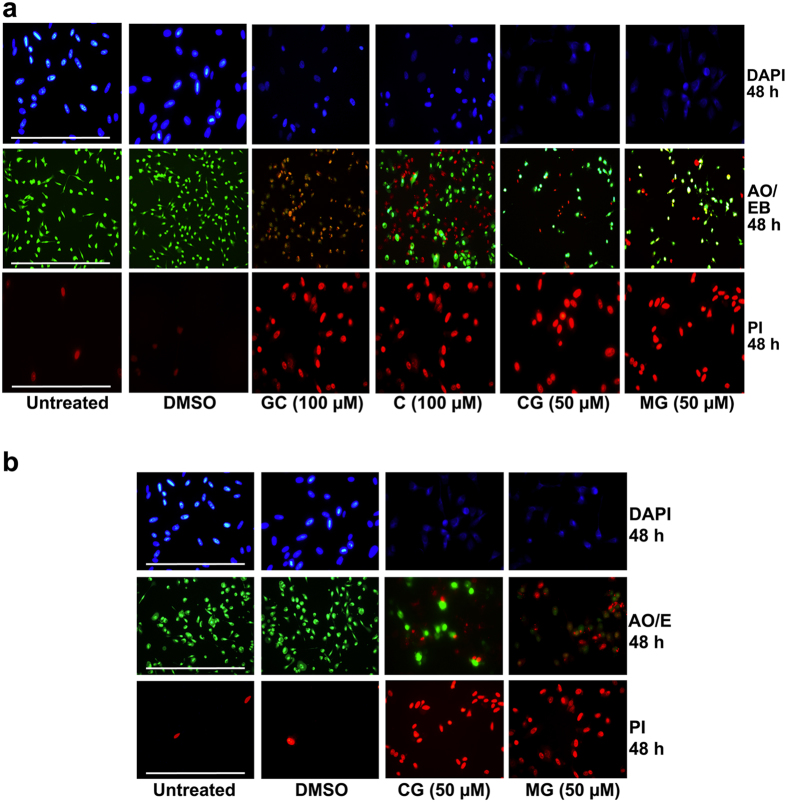
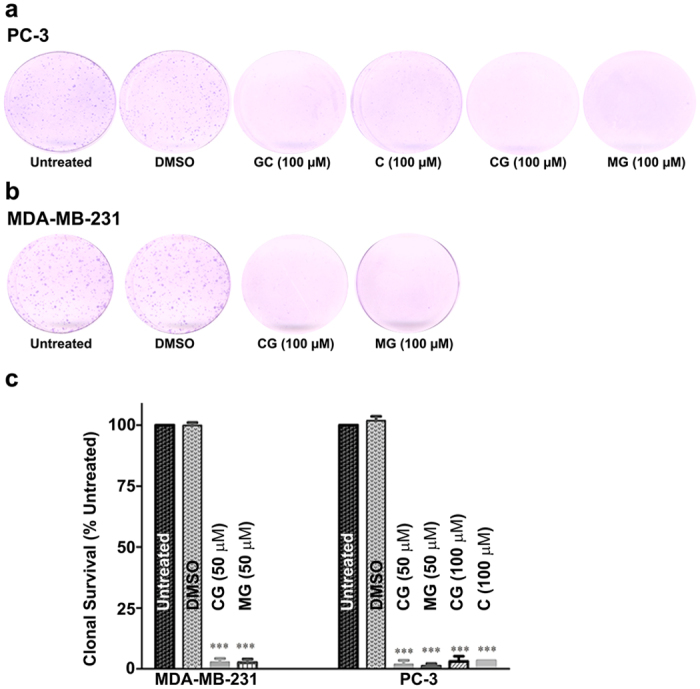
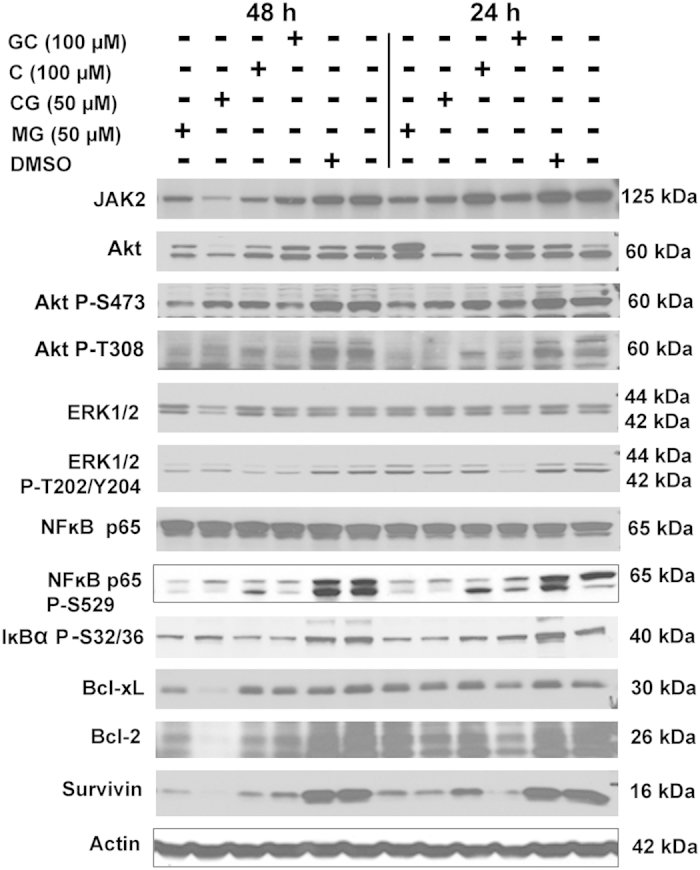
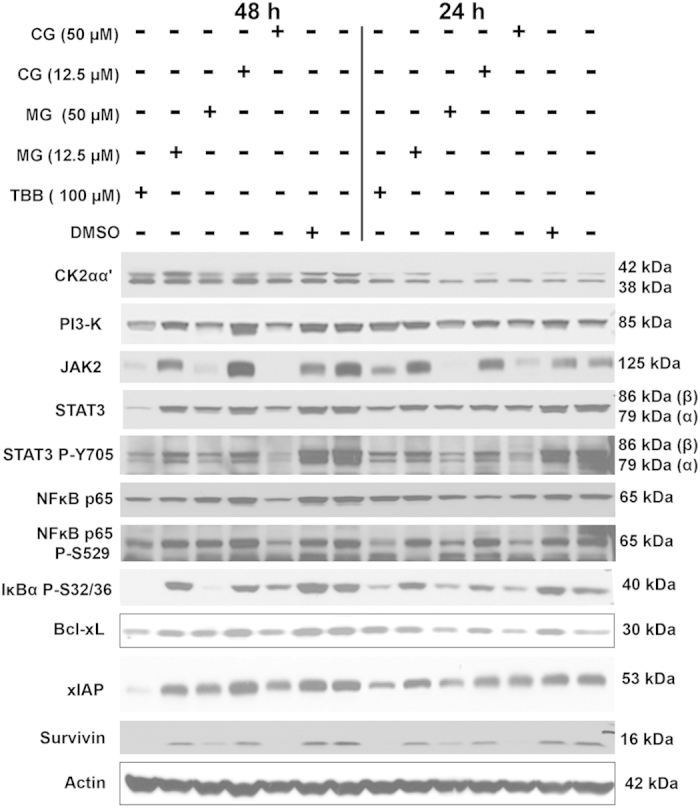
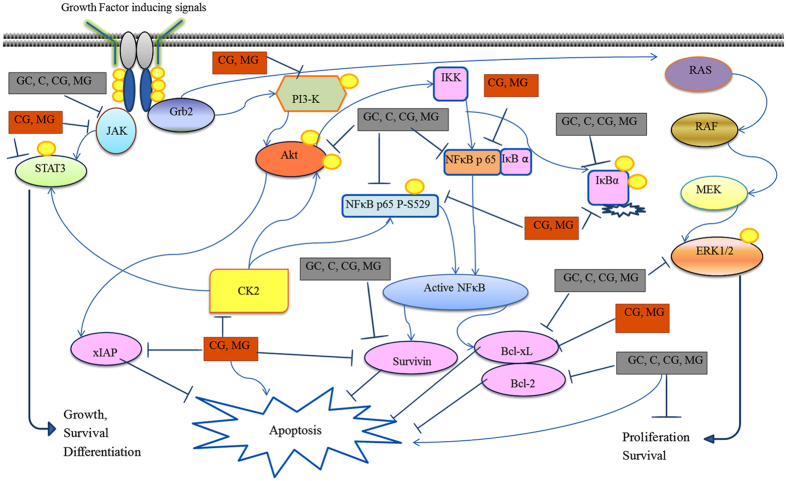
Acacia hydaspica R. Parker is known for its medicinal uses in multiple ailments. In this study, we performed bioassay-guided fractionation of cytotoxic compounds from A. hydaspica and investigated their effects on growth and signaling activity in prostate and breast cancer cell lines. Four active polyphenolic compounds were identified as 7-O-galloyl catechin (GC), catechin (C), methyl gallate (MG), and catechin-3-O-gallate (CG). The four compounds inhibited prostate cancer PC-3 cell growth in a dose-dependent manner, whereas CG and MG inhibited breast cancer MDA-MB-231 cell growth. All tested compounds inhibited cell survival and colony growth in both cell lines, and there was evidence of chromatin condensation, cell shrinkage and apoptotic bodies. Further, acridine orange, ethidium bromide, propidium iodide and DAPI staining demonstrated that cell death occurred partly via apoptosis in both PC-3 and MDA-MB-231 cells. In PC-3 cells treatment repressed the expression of anti-apoptotic molecules Bcl-2, Bcl-xL and survivin, coupled with down-regulation of signaling pathways AKT, NFκB, ERK1/2 and JAK/STAT. In MDA-MB-231 cells, treatment induced reduction of CK2α, Bcl-xL, survivin and xIAP protein expression along with suppression of NFκB, JAK/STAT and PI3K pathways. Our findings suggest that certain polyphenolic compounds derived from A. hydaspica may be promising chemopreventive/therapeutic candidates against cancer.


Figures

Figure 1
Figure 1. Structures of isolated compounds from A. hydaspica R. Parker.
Chemical structures of the various compounds purified from A. hydaspica are shown.
Figure 2
Figure 2. Cell viability in cells treated with AHC compounds.
(a–d) Prostate cancer PC-3 cells were treated with varying concentrations of (a) 7-O-galloyl catechin, (b) catechin, (c) catechin gallate, or (d) methyl gallate for 24, 48 and 72 h as indicated. TBB was included as a positive control and DMSO was included as a negative control at a concentration equivalent to 100 μM AHC compound. Cell viability was determined relative to the untreated (0 μM) cells. (e,f) Breast cancer MDA-MB-231 cells were treated with varying concentrations of (e) catechin gallate, or (f) methyl gallate for 24 or 48 h, as indicated. All other conditions are as describe for (ad). Data are presented as mean ± SEM (n = 3). Data analyzed by two-way ANOVA with Bonferroni post-test. The asterisks *, **, ***indicate significant difference at p < 0.05, p < 0.001 and p < 0.0001, respectively, from the untreated control cells.
Figure 3
Figure 3. Detection of apoptosis by fluoresence microscopy in cells after treatment with AHC compounds.
(a) PC-3 cells were treated with GC, CG or MG for 48 h, as indicated below the panels. Cells were stained with DAPI, acridine orange and ethidium bromide (AO/EB), or propidium iodide (PI) as indicated on the right side of the panels. (b) MDA-MB-231 cells were treated with CG or MG for 48 h as indicated below the panels. Cells were stained with DAPI, acridine orange and ethidium bromide (AO/EB), or propidium iodide (PI) as indicated on the right of the panels. Images of cells were captured at 200-fold magnification. Scale bar is 100 μm.
Figure 4
Figure 4. Clonogenic survival assays following treatment with AHC compounds.
(a,b) PC-3 (a) or MDA-MB-231 (b) cells were treated with AHC compounds or equal dilution DMSO (as indicated below the plate images). After 48 h, the compounds were removed and cells seeded at a density of 1000 cells for PC-3 and 500 cells for MDA-MB-231 on 35 mm plates. After 7 days of growth, the cells were stained with crystal violet and the stained plates scanned. Representative plates are shown. (c) Crystal violet stained colonies were quantified as described in the “Materials and methods” section. The percent inhibition of PC-3 and MDA-MB-231 colony formation relative to untreated control is graphed. Data are presented as mean ± SEM of at least 3 independent experiments. Data analyzed by one-way ANOVA with Bonferroni post-test. Asterisks ***indicate significant difference at p < 0.0001 relative to untreated control.
Figure 5
Figure 5. Western blot analyses following treatment of PC-3 cells with AHC compounds.
Western blot analysis of cellular lysates prepared from PC-3 cells treated with 7-O-galloyl catechin (GC), catechin (C), catechin gallate (CG), methyl gallate (MG), or equal dilution of DMSO was performed. Treatments are indicated above the blots. The protein detected is indicated to the left of each blot, and the size of protein detected is indicated to the right of each blot. The quantitation of the data is shown in Supplementary Table 2. Cropped blots are shown. Full sized blots are included in Supplementary Fig. 3. All gels and blots were run under the same experimental conditions as described in Methods.
Figure 6
Figure 6. Western blot analyses following treatment of MDA-MB-231 cells with AHC compounds.
Western blot analysis of cellular lysates prepared from MDA-MB-231 cells treated with 2 concentrations each of catechin gallate (CG) and methyl gallate (MG), or dilution of DMSO representing the highest concentration was performed. Treatments are indicated above the blots. The protein detected is indicated to the left of each blot, and the size of protein detected is indicated to the right of each blot. The quantitation of the data is shown in Supplementary Table 3. Cropped blots are shown. Full sized blots are included in Supplementary Fig. 4. All gels and blots were run under the same experimental conditions as described in Methods.
Figure 7
Figure 7. Proposed signaling pathways and anti-apoptotic proteins expression affected by compounds isolated from A. hydaspica.
A diagram of the effects of AHC compounds, in PC-3 and MDA-MB-231 cells as detected by western blot analyses is depicted. Effective compounds against PC-3 cells are depicted in grey boxes. Effective compounds against MDA-MB-231 cells are depicted in red boxes. Arrows indicate activation or stimulation. Blocked lines indicate inhibition. Yellow circles indicate phosphorylation.

References

    1. Siegel R. L., Miller K. D. & Jemal A. Cancer statistics, 2015. CA. Cancer J. Clin. 65, 5–29 (2015). - PubMed
    1. Global Burden of Disease Cancer, C. et al. The Global Burden of Cancer 2013. JAMA Oncol 1, 505–527 (2015). - PMC - PubMed
    1. Armstrong C. M. & Gao A. C. Drug resistance in castration resistant prostate cancer: resistance mechanisms and emerging treatment strategies. Am J Clin Exp Urol 3, 64–76 (2015). - PMC - PubMed
    1. Skibinski A. & Kuperwasser C. The origin of breast tumor heterogeneity. Oncogene 34, 5309–5316 (2015). - PMC - PubMed
    1. Alimirah F., Chen J., Basrawala Z., Xin H. & Choubey D. DU-145 and PC-3 human prostate cancer cell lines express androgen receptor: implications for the androgen receptor functions and regulation. FEBS Lett. 580, 2294–2300 (2006). - PubMed

Publication types

MeSH terms