. 2016 Mar 15:7:10997.
doi: 10.1038/ncomms10997.

Perinuclear Arp2/3-driven actin polymerization enables nuclear deformation to facilitate cell migration through complex environments

Affiliations

Perinuclear Arp2/3-driven actin polymerization enables nuclear deformation to facilitate cell migration through complex environments

Hawa-Racine Thiam et al. Nat Commun. .

Abstract

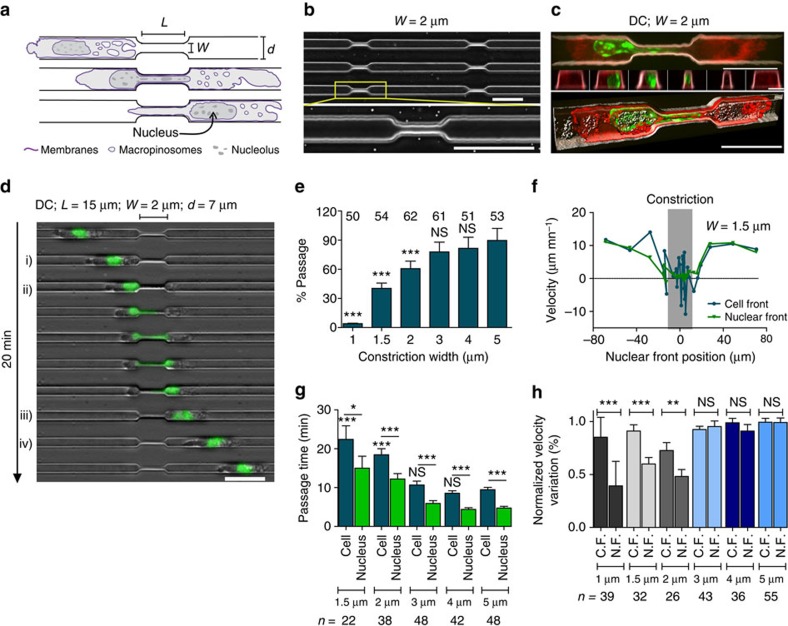
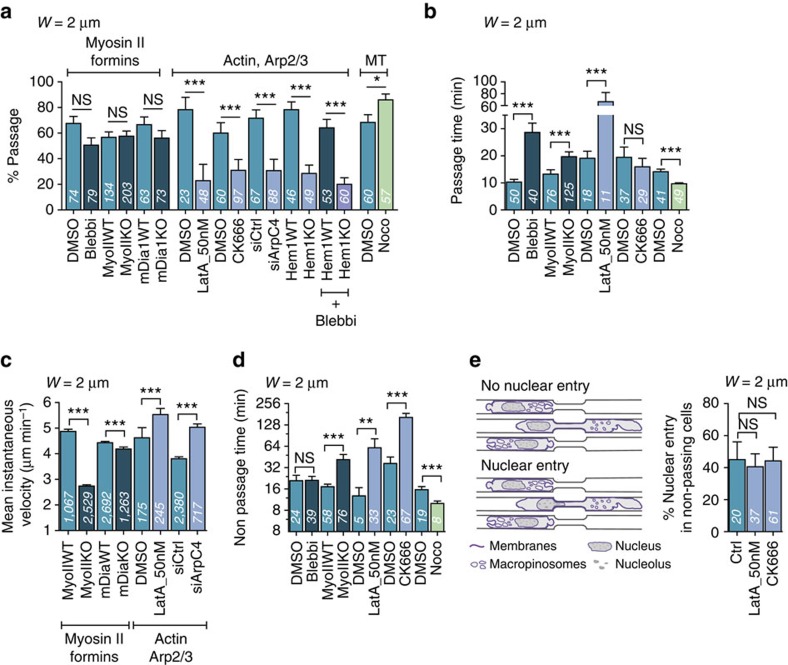
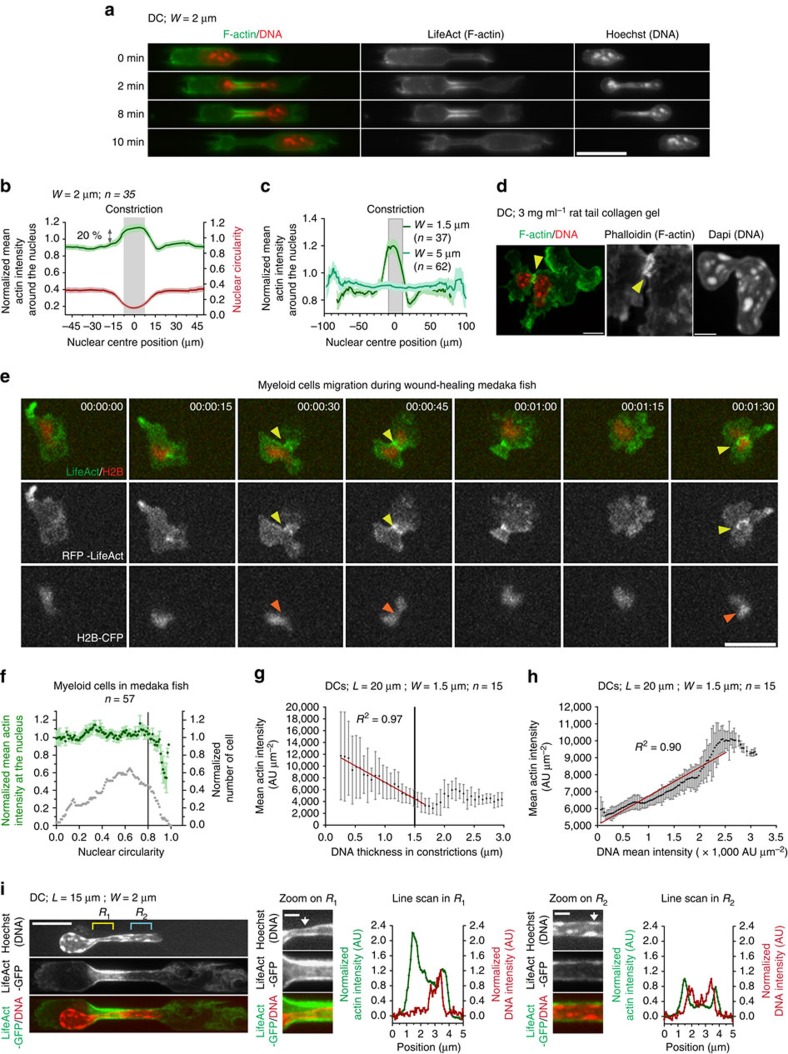
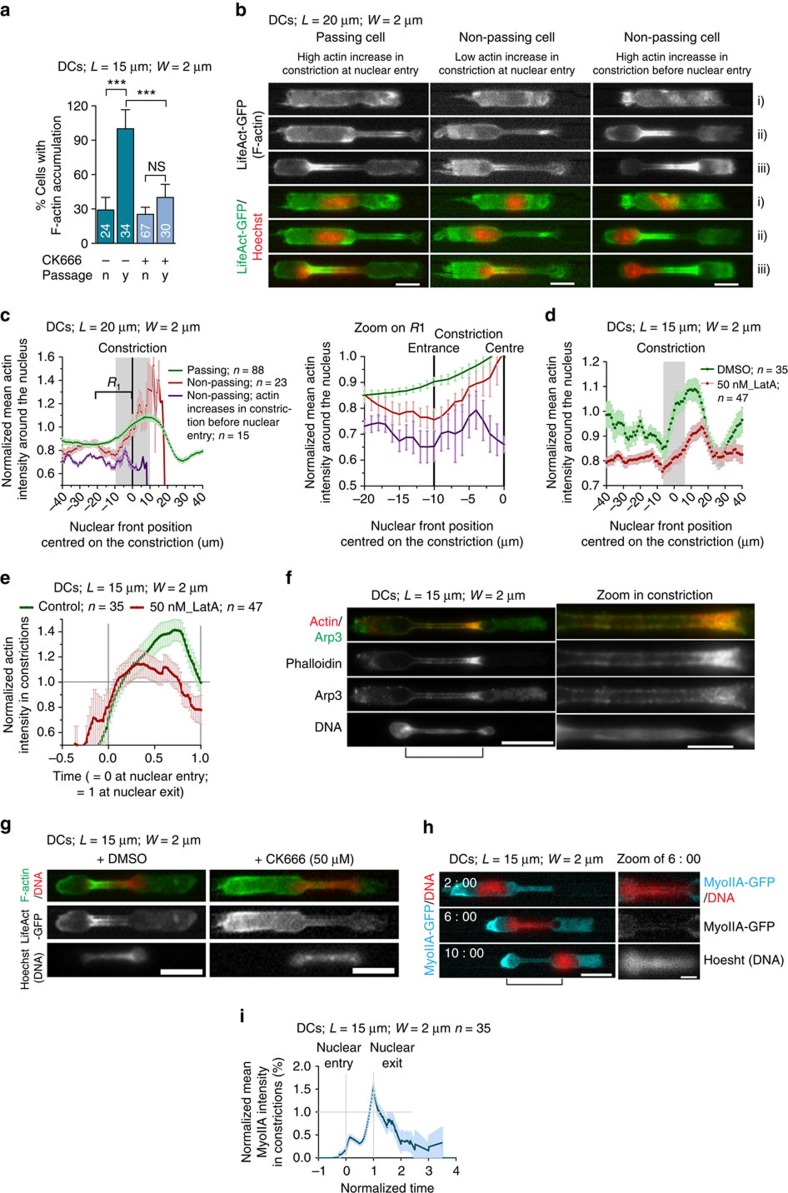
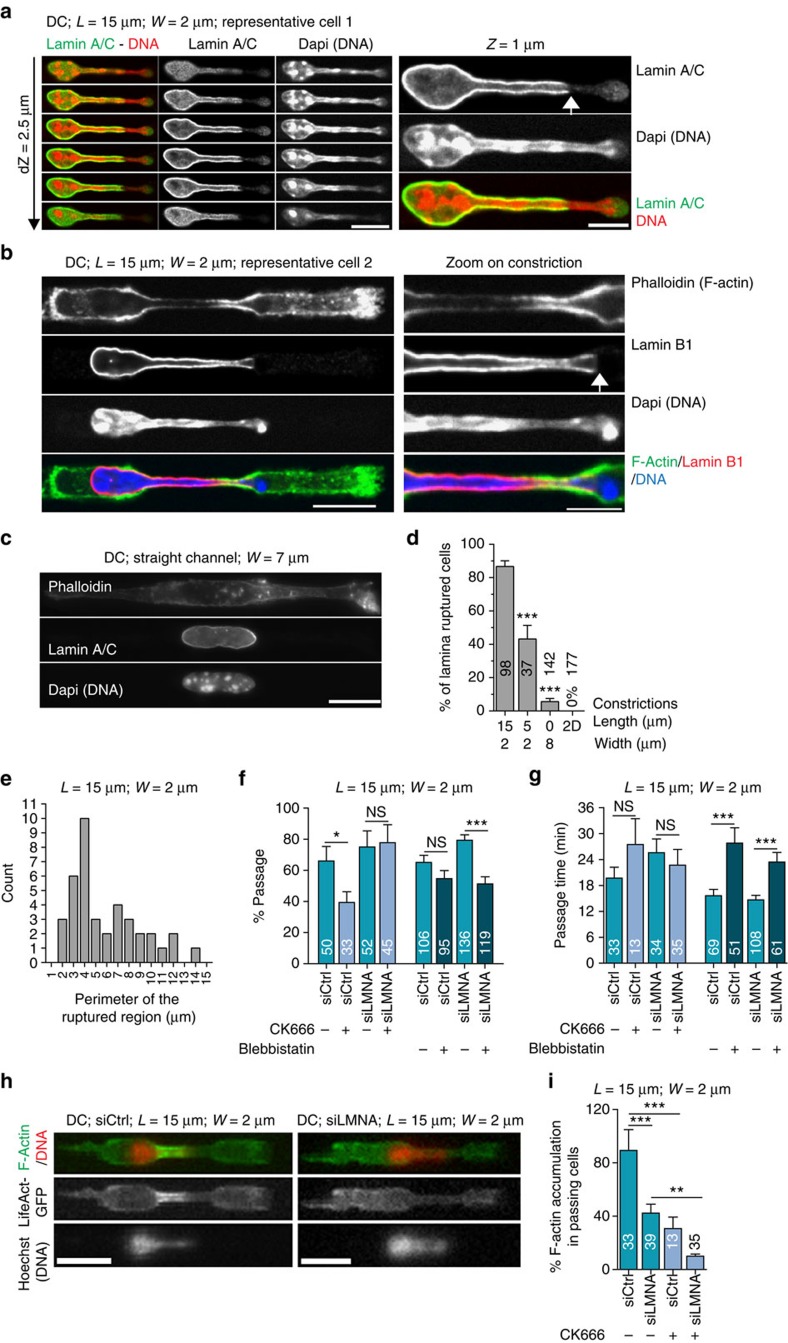
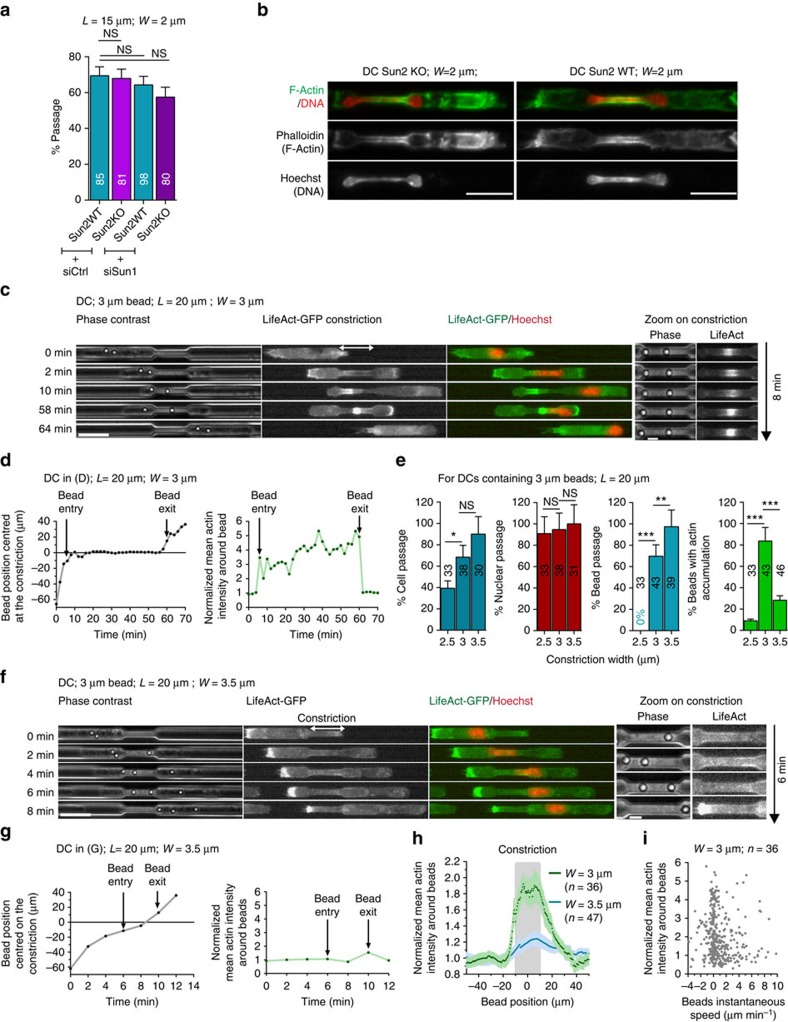
Cell migration has two opposite faces: although necessary for physiological processes such as immune responses, it can also have detrimental effects by enabling metastatic cells to invade new organs. In vivo, migration occurs in complex environments and often requires a high cellular deformability, a property limited by the cell nucleus. Here we show that dendritic cells, the sentinels of the immune system, possess a mechanism to pass through micrometric constrictions. This mechanism is based on a rapid Arp2/3-dependent actin nucleation around the nucleus that disrupts the nuclear lamina, the main structure limiting nuclear deformability. The cells' requirement for Arp2/3 to pass through constrictions can be relieved when nuclear stiffness is decreased by suppressing lamin A/C expression. We propose a new role for Arp2/3 in three-dimensional cell migration, allowing fast-moving cells such as leukocytes to rapidly and efficiently migrate through narrow gaps, a process probably important for their function.


Figures

Figure 1
Figure 1. The nucleus imposes a physical limitation to DC migration through micrometric pores.
(a) Schematic representation of the experimental setup. (b) Top: representative image of a field of channels with constrictions. Bottom: zoom on a single constriction. Scale bar, 30 μm. (c) Top: representative image of an Iaβ-GFP (red)-expressing DC stained with Hoechst (DNA, green), passing through a 2-μm constriction coated with pLL-PEG-Rhodamin (grey levels). Scale bar, 15 μm. Middle: views of the channel cross-section before, along and after the constriction. Scale bar, 4 μm. Bottom: perspective view (45°) of a 3D iso-surface reconstruction. Scale bar, 15 μm. (d) Representative sequential images of a DC stained with Hoechst (green) migrating through a constriction. (i) Cell entry, (ii) nuclear entry, (iii) nuclear exit and (iv) cell exit. Scale bar, 30 μm. Time in minutes: seconds. (e) Percentage of passage through 20-μm-long constrictions. Numbers above bars represent the number of cells scored. (f) Representative cell (blue) and nuclear (green) front instantaneous velocity as a function of the nuclear front position in 1.5 μm constrictions.(g) Cell (blue) and nuclear (green) passage time in 20-μm-long constrictions. (e,g) Unless when indicated by a spanner, statistical test was against the value for 5-μm-wide constrictions. (h) Cell and nuclear front velocities inside constrictions, normalized by the cell centre of mass velocity before the constriction. C.F., cell front; N.F., nuclear front. Error bars represent the s.e.m. (g,h) n represents the number of cells. ***P-value<0.0001, **P-value<0.001 and *P-value<0.01; NS,=nonsignificant. Statistical test: Fisher's test for e, Mann–Whitney test for g and h. Error bars are s.e.m. (a,d) L and W for constriction length and width, respectively; d for channel width; N≥2.
Figure 2
Figure 2. Arp2/3-based actin polymerization is required for DC passage through constrictions.
(a) Percentage of passage and (b) passage time in 2-μm-wide constrictions. Blebbi, blebbistatin; LatA, latrunculin A; MT, microtubules; Noco, nocodazole. (c) Mean instantaneous speed in straight 7-μm-wide channels. (d) Non-passage time in 2-μm-wide constrictions. (e) Left: schematic of the nuclear entry events. Right: percentage of nuclear entry in non-passing cells. (a,b,d,e) Numbers in bars represent the number of scored cells. (c) Numbers in bars represent the number of cell tracks for each condition. ***P-value<0.0001, **P-value<0.001 and *P-value<0.01; NS, nonsignificant. Statistical test: Fisher's test for a and e, Mann–Whitney test for b,c and d. Error bars are s.e.m. N≥3.
Figure 3
Figure 3. A dynamic actin meshwork forms around the nucleus and deform this organelle during its passage through narrow constrictions.
(a) Sequential images of a representative LifeAct-GFP (green) expressing DC stained with Hoechst (red) passing a 2-μm-wide constriction. Scale bar, 20 μm. (b) Normalized mean actin intensity around the nucleus (green) and nuclear circularity (red) of cells crossing 2-μm-wide constrictions as a function of the nuclear centre of mass position relative to the centre of the constriction. (c) Normalized mean actin intensity around the nucleus in 1.5 μm (dark green) and 5 μm (light green) wide constrictions as a function of the nuclear centre of mass position relative to the centre of the constriction. (d) Immunostaining of a DC migrating in a collagen gel; yellow arrows show actin accumulation at the site of nuclear deformation. Scale bar, 10 μm (left); 5 μm (right). (e) RFP-LifeAct (green)- and H2B-CFP (red)-expressing myeloid cells migrating in mekada fish during in vivo wound healing. Yellow arrows indicate actin accumulation around the deformed nucleus (orange arrows, representative of 53 of the 66 observed cells). Time frames in hours: minutes: seconds. Scale bar, 15 μm. (f) Normalized mean actin intensity at the nuclear region in myeloid cells migrating in mekada fish as a function of nuclear circularity. Error bars are s.e.m. (g) Mean actin intensity as a function of DNA thickness at a position X in 1.5-μm-wide constrictions. Red line indicates the linear regression of the data for DNA tickness smaller than 1.5 μm (the constriction width). Error bars are s.d. (h) Mean actin intensity as a function of mean DNA intensity at a position X in 1.5-μm-wide constrictions. Red line indicates the linear regression of the data for DNA mean intensity smaller than 2,500 AU μm−2. Error bars are s.e.m. (i) Representative spinning disc images of LifeAct-GFP-expressing (actin, green) DC stained with Hoechst (DNA, red) in 2-μm-wide constrictions. Scale bar, 10 μm. White arrow indicates the position of the line scan. Scale bar, 2 μm. L, constriction length; n, number of cells; W, constriction width. N≥2.
Figure 4
Figure 4. The dynamic perinuclear actin network is nucleated by Arp2/3.
(a) Percentage of cells with F-actin accumulation in 2-μm-wide constrictions after nuclear entry. n, no; y, yes. Numbers represent the number of cells scored. ***P<0.0001 by Fisher's test. (b) Representative images of LifeAct-GFP (green)-expressing DCs stained with Hoechst (red) passing or failing to pass a 2-μm-wide constriction. (i) Time point before cell and nuclear entry in constriction; (ii) time point after cell but before nuclear entry in constriction; (iii) time point after cell and nuclear entry in constriction. Scale bar, 10 μm. (c) Left graph: normalized mean actin intensity in DCs that succeed (green) or fail (red and purple) to pass 2-μm-wide constrictions as a function of nuclear front position centred on the constriction. Grey bar represents the constriction. Right graph: zoom on constriction entry (region R1) of the left graph. (d) Normalized mean actin intensity in DMSO-treated (green) and 50 nM of Latrunculin A-treated (red) DCs as a function of nuclear front position centred on the constriction. Grey bar represents the constriction. (e) Normalized mean actin intensity in constriction measured in DMSO-treated (green) and 50 nM of Latrunculin A-treated DCs as a function of the nuclear entry and exit time. (c,d,e) Dark and light colours respectively represent the mean and the s.d. (f) Representative image of a DC immunostained for Arp2/3 and stained for actin filaments in a 2-μm-wide constriction. Scale bar, 15 μm (left); 5 μm (right). The pinched DNA at the actin accumulation site is noteworthy. (g) LifeAct-GFP (green)-expressing DCs stained with Hoechst (red) in 2-μm-wide constrictions. Left: control cell; right: after Arp2/3 inhibition. Scale bar, 15 μm. (h) Sequential images of a representative myosin IIA-GFP (cyan)-expressing DC stained with Hoechst (red). Scale bar, 15 μm (left); 5 μm (right). (i) Normalized mean myosin IIA-GFP (blue) intensity in 2-μm-wide constrictions. L, constriction length; n, number of cells; W, constriction width. N≥2. All error bars are s.e.m.
Figure 5
Figure 5. Arp2/3-nucleated perinuclear actin facilitates nuclear squeezing through constrictions by weakening the lamin A/C network.
Representative images of immunostained DCs (a), (b) in 2-μm-wide constrictions and (c) in 8-μm-wide channels. White arrows indicate region of ruptured lamin A/C or Lamin B1 network. Scale bars10 μm (a,b (left panel) and b); 5 μm (a,b (right panel)). (d) Percentage of DCs showing a ruptured lamina network in 2-μm-wide and 15- or 5-μm-long constrictions, in straight 8-μm-wide channels and on two-dimensional substrates. (e) Histogram of the perimeter of the ruptured lamina region in 2-μm-wide and 15-μm-long constrictions. (f) Percentage of passage and (g) passage time in 2-μm-wide constrictions of DCs treated as indicated. (h) LifeAct-GFP (green)-expressing DCs stained with Hoechst (red). Left: control siRNA; right: laminA/C siRNA. Scale bar, 15 μm. (i) Percentage of passing cells with F-actin accumulation in 2-μm-wide constrictions. siCtrl, control siRNA; siLMNA, Lamin A/C siRNA. (d,f,g,i) Numbers represent the number of cells observed. Error bars are s.e.m. ***P-value<0.0001, **P-value<0.001 and *P-value<0.01. NS, nonsignificant. Statistical test: Fisher's test for c and f, Mann–Whitney test for d. L, constriction length; W, constriction width.. N≥3.
Figure 6
Figure 6. Actin assembly inside constrictions is not specific to the nucleus and can be induced by confinement of rigid particles.
(a) Percentage of passage in 2-μm-wide constrictions of DCs treated as indicated. Error bars are s.e.m. (b) Representative images of Sun2 KO (left) and Sun 2 WT (right) immunostained DCs in 2-μm-wide and 15-μm-long constrictions. N=2; scale bar, 15 μm. Sequential images of representative LifeAct-GFP (green)-expressing DCs with a 3 μm internalized bead stained with Hoechst (red) passing 3 μm (c) and 3.5 μm (f) wide constrictions. Scale bar 20 μm (c,f (left)); 5 μm (zoom). (d) Left: bead position centred at the constriction; (d) right: normalized mean actin intensity around the first bead of the cell shown in c over time. (e) For DCs with internalized beads, percentage of cells with F-actin accumulation around beads (‘Peribead'), percentage of cell, bead and nuclear passage as function of the constriction width (2.5, 3 and 3.5 μm). Numbers represent the number of cells observed for N=3. Error bars are s.e.m. (g) Left: bead position centred at the constriction; (g) right: normalized mean actin intensity around the third bead of the cell shown in f over time. (h) Normalized mean actin intensity around beads in 3- (green) and 3.5-μm (blue)- wide constrictions as a function of the bead centre of mass position relative to the centre of the constriction. Error bars are s.e.m. (i) Normalized mean actin intensity around beads as function of beads velocity in 3-μm-wide constrictions. L, constriction length; W, constriction width.. ***P-value<0.0001, **P-value<0.001 and *P-value<0.01. NS, nonsignificant. Statistical test: Fisher's test.

References

    1. Danuser G., Allard J. & Mogilner A. Mathematical modeling of eukaryotic cell migration: insights beyond experiments. Annu. Rev. Cell Dev. Biol. 29, 501–528 (2013) . - PMC - PubMed
    1. Ridley A. J. et al. Cell migration: integrating signals from front to back. Science 302, 1704–1709 (2003) . - PubMed
    1. Wilson C. A. et al. Myosin II contributes to cell-scale actin network treadmilling through network disassembly. Nature 465, 373–377 (2010) . - PMC - PubMed
    1. Chan C. E. & Odde D. J. Traction dynamics of filopodia on compliant substrates. Science 322, 1687–1691 (2008) . - PubMed
    1. Gupton S. L. & Waterman-Storer C. M. Spatiotemporal feedback between actomyosin and focal-adhesion systems optimizes rapid cell migration. Cell 125, 1361–1374 (2006) . - PubMed

Publication types

LinkOut - more resources