

Waist-to-height ratio as an indicator of 'early health risk': simpler and more predictive than using a 'matrix' based on BMI and waist circumference
- PMID: 26975935
- PMCID: PMC4800150
- DOI: 10.1136/bmjopen-2015-010159
Waist-to-height ratio as an indicator of 'early health risk': simpler and more predictive than using a 'matrix' based on BMI and waist circumference
Abstract
Objectives: There is now good evidence that central obesity carries more health risks compared with total obesity assessed by body mass index (BMI). It has therefore been suggested that waist circumference (WC), a proxy for central obesity, should be included with BMI in a 'matrix' to categorise health risk. We wanted to compare how the adult UK population is classified using such a 'matrix' with that using another proxy for central obesity, waist-to-height ratio (WHtR), using a boundary value of 0.5. Further, we wished to compare cardiometabolic risk factors in adults with 'healthy' BMI divided according to whether they have WHtR below or above 0.5.
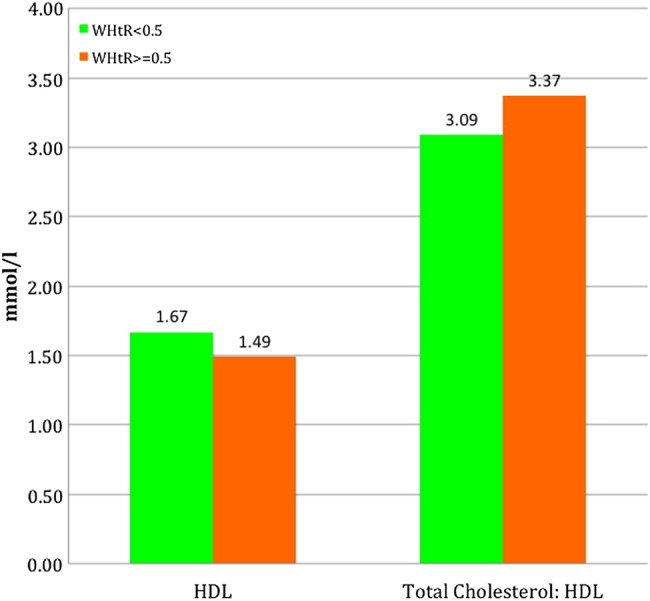
Setting, participants and outcome measures: Recent data from 4 years (2008-2012) of the UK National Diet and Nutrition Survey (NDNS) (n=1453 adults) were used to cross-classify respondents on anthropometric indices. Regression was used to examine differences in levels of risk factors (triglycerides (TG), total cholesterol (TC), low-density lipoprotein (LDL), high-density lipoprotein (HDL), TC: HDL, glycated haemoglobin (HbA1c), fasting glucose, systolic (SBP) and diastolic blood pressure (DBP)) according to WHtR below and above 0.5, with adjustment for confounders (age, sex and BMI).
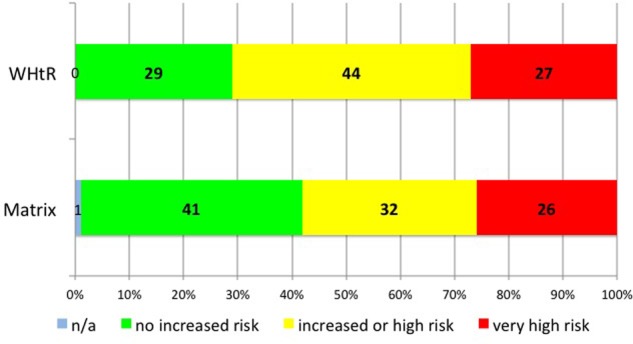
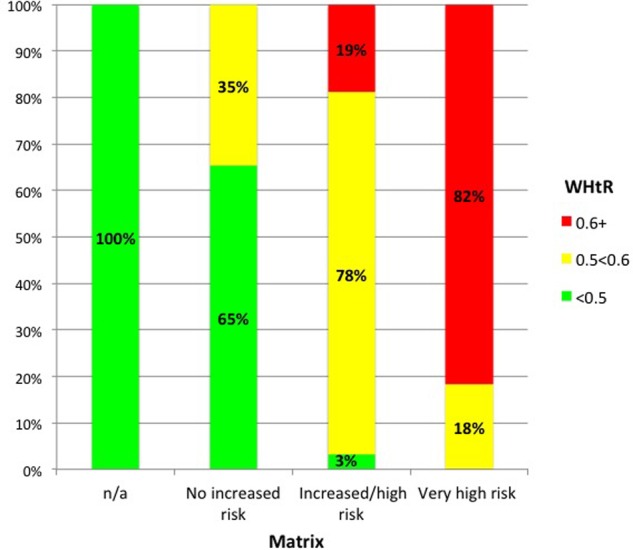
Results: 35% of the group who were judged to be at 'no increased risk' using the 'matrix' had WHtR ≥ 0.5. The 'matrix' did not assign 'increased risk' to those with a 'healthy' BMI and 'high' waist circumference. However, our analysis showed that the group with 'healthy' BMI, and WHtR ≥ 0.5, had some significantly higher cardiometabolic risk factors compared to the group with 'healthy' BMI but WHtR below 0.5.
Conclusions: Use of a simple boundary value for WHtR (0.5) identifies more people at 'early health risk' than does a more complex 'matrix' using traditional boundary values for BMI and WC. WHtR may be a simpler and more predictive indicator of the 'early heath risks' associated with central obesity.
Keywords: PUBLIC HEALTH.
Published by the BMJ Publishing Group Limited. For permission to use (where not already granted under a licence) please go to http://www.bmj.com/company/products-services/rights-and-licensing/
Figures
References
-
- Janssen I, Katzmarzyk PT, Ross R. Waist circumference and not body mass index explains obesity-related health risk. Am J Clin Nutr 2004;79:379–84. - PubMed
MeSH terms
LinkOut - more resources
Full Text Sources
Other Literature Sources
Medical
Miscellaneous