. 2016 Mar 15:7:11007.
doi: 10.1038/ncomms11007.

Therapeutic targeting and rapid mobilization of endosteal HSC using a small molecule integrin antagonist

Affiliations

Therapeutic targeting and rapid mobilization of endosteal HSC using a small molecule integrin antagonist

Benjamin Cao et al. Nat Commun. .

Abstract

The inherent disadvantages of using granulocyte colony-stimulating factor (G-CSF) for hematopoietic stem cell (HSC) mobilization have driven efforts to identify alternate strategies based on single doses of small molecules. Here, we show targeting α9β1/α4β1 integrins with a single dose of a small molecule antagonist (BOP (N-(benzenesulfonyl)-L-prolyl-L-O-(1-pyrrolidinylcarbonyl)tyrosine)) rapidly mobilizes long-term multi-lineage reconstituting HSC. Synergistic engraftment augmentation is observed when BOP is co-administered with AMD3100. Impressively, HSC in equal volumes of peripheral blood (PB) mobilized with this combination effectively out-competes PB mobilized with G-CSF. The enhanced mobilization observed using BOP and AMD3100 is recapitulated in a humanized NODSCIDIL2Rγ(-/-) model, demonstrated by a significant increase in PB CD34(+) cells. Using a related fluorescent analogue of BOP (R-BC154), we show that this class of antagonists preferentially bind human and mouse HSC and progenitors via endogenously primed/activated α9β1/α4β1 within the endosteal niche. These results support using dual α9β1/α4β1 inhibitors as effective, rapid and transient mobilization agents with promising clinical applications.


Figures
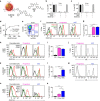
Figure 1
Figure 1. R-BC154 and BOP preferentially bind human and murine HSC and progenitors in a divalent cation and integrin-dependent manner.
(a) Chemical structure of R-BC154 (1) and BOP (2). (b) Use of R-BC154, BOP and BIO5192 to demonstrate specific detection of binding to α9 (grey) in human and (c) murine overexpressing cell lines (LN18 and CHO respectively) compared with α4 (black) in the presence of 1 mM Ca2+/Mg2+ n=3 and is representative of at least two independent experiments. (d) Dose response of R-BC154 binding to human CB MNC. n=3 and is representative of two independent experiments. Binding in the presence of cations is significantly greater at all concentrations except 0 nM (P<0.005). (e) Representative populations of CB HSC (CD34+CD38), progenitors (CD34+CD38+) and committed cells (CD34CD38+). (f) R-BC154 binding to CB MNC committed cells, progenitors and HSC in the presence of 1 mM Ca2+/Mg2+ alone, or in combination with BOP or BIO5192. Data are representative of three individual samples. US, unstained. α9—specific binding via α9β1, α4—specific binding via α4β1. (g) Specific binding of R-BC154 binding to α9β1 on CB-committed cells (CC), progenitors (prog) and HSC. n=3 (h) R-BC154 binding to human BM (huBM). Data are representative of three individual samples. (i) Specific binding of R-BC154 to huBM α9β1. n=3 (j) α9β1 expression on huBM progenitors and HSC (grey solid line, dashed line IgG1 isotype control). Data are representative of three individual samples. (k) R-BC154 binding to humanized NSG (huNSG) BM. Data are representative of three individual samples. (l) Specific binding of R-BC154 to huNSG BM α9β1. n=3. (m) α9β1 expression on huNSG BM progenitors and HSC (grey solid line, dashed line IgG1 isotype control). Data are representative of three individual samples. (n) R-BC154 binding to mu BM-committed cells, progenitors (LinSca-1+c-kit+; LSK) and HSC (LSKCD150+CD48; LSKSLAM). Data are representative of three individual samples. (o) Specific binding of R-BC154 to mu BM α9β1. n=3. CB CD34+ cells were transplanted into 6.5 week old male (n=1) and female (n=2) NSG mice (k,l). Around 7–8-week-old female C57 mice were used for n and o. All data are mean±s.e.m. Analysis using one-way ANOVA (g,i,l,o) or two-way ANOVA (d), *P<0.05, **P<0.01, ***P<0.005, ****P<0.001.
Figure 2
Figure 2. R-BC154 targets HSC and progenitors via endogenously activated/primed α49 integrins in endosteal BM.
(a) Schematic of central BM (cBM; blue) and endosteal BM (eBM; orange). (b) in vivo R-BC154 binding to huNSG central (blue) and endosteal (orange) BM huCD34+ cells compared with uninjected control (grey). Data are representative of three animals. (c) In vitro R-BC154 binding to huNSG central and endosteal BM progenitors (CD34+CD38+ cells) and HSC (CD34+CD38 cells) in the absence of exogenous cations compared with uninjected control. Data are the representative of three samples. (d) Quantified R-BC154 binding from c, n=3. (e) In vitro R-BC154 binding to murine central and endosteal BM progenitors (LSK cells) and HSC (LSKSLAM cells) in the absence of exogenous cations compared to uninjected control. Data are representative of >10 samples. (f) Quantified R-BC154 binding from e, n=5. (g) Representative XFM images depicting the elastic scattering, Compton scattering and calcium distribution profile of a diaphyseal cross-section of non-decalcified murine femur. White arrow depicts calcium gradient radiating away from the endosteal surface (red dotted line). The hashed white line at ∼100 μm from the bone surface represents the interface between eBM and cBM. (h) Calcium content across representative line a to b in g, which begins ∼20 μm and extends to ∼220 μm from the endosteal surface. Data are expressed as arbitrary units (a.u.) n=10 different lines a to b. Representative of three animals. (i) Quantitative analysis of calcium, magnesium and manganese in murine BM central and endosteal extracellular fluid, (j) membrane bound (k) and intracellular. n=3. The endosteal extracellular component has been corrected for mechanically caused release (Supplementary Fig. 2a). CB CD34+ cells were transplanted into 9-week-old female NSG mice (bd). Around 7–8-week-old female mice were used for eh. All data are mean±s.e.m. Analysis using t-test, *P<0.05, ***P<0.005, ****P<0.001.
Figure 3
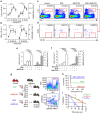
Figure 3. The α9β14β1 integrin antagonist BOP rapidly mobilizes murine long-term repopulating HSC.
(a) Dose-dependent mobilization of murine progenitors (LSK, white square) and HSC (LSKSLAM, grey square) with BOP. Data are pooled from two biological repeats; n>3 per group. (b) Time-course of progenitor and HSC mobilization with 10 mg kg−1 BOP. Time 0 is the vehicle control group. Data are pooled from two biological repeats. n=5 Individual animals per time point, not repetitive analysis. (c) Representative dot plots of PB progenitors and (d) HSC 1 h after a single dose of vehicle, BOP, AMD3100 or BOP+AMD3100 in combination, n>3. (e) Analysis of progenitor and HSC content in PB after 1 h treatment with vehicle, BOP, AMD3100 or BOP+AMD3100 in combination. (f) Total PB progenitor and HSC content 1 h after a single dose of vehicle (n=5), BIO5192 alone (n=5) or in combination with AMD3100 (n=5), or BOP in combination with AMD3100 (n=3). (g) Schematic of limiting dilution transplant analysis of mobilized RFP PB (five recipients per group). Representative dot plots of recipient BM multi-lineage engraftment. (h) Survival of recipients transplanted with 30 μl of RFP-mobilized PB. (i) Long-term HSC frequency in PB mobilized following BOP (green line), AMD3100 (red line) or BOP+AMD3100 (blue line). Around 7–8-week-old female (ae) and male (f) C57 mice were used. 7–8 week old male (n=15) and female (n=10) RFP donors and male C57 recipients were used for gi. All data are mean±s.e.m. Analysis using one-way ANOVA, *P<0.05, **P<0.01, ***P<0.005, ****P<0.001.
Figure 4
Figure 4. BOP and AMD3100 combination is a rapid and effective alternative to G-CSF.
(a) Analysis of PB progenitor (LSK) and HSC (LSKSLAM) content following a single dose of BOP (n=4), 4 days of G-CSF (n=3) or 4 days of G-CSF+1 dose of BOP (n=3). Data are representative of three independent experiments. (b) Analysis of PB progenitor and HSC content following a single dose of BOP+AMD3100 (n=8), 4 days of G-CSF (n=3), 4 days of G-CSF+1 dose of AMD3100 (n=9) or 4 days of G-CSF+1 dose of BOP+AMD3100 (n=8). Data are a pool of two independent experiments. (c) Schematic of serial competitive transplant assay. (d) Proportion of PB RFP+ white blood cells (WBC) in 1° recipients. Each data point is an individual recipient from one of two transplants. 1st=crosses, 2nd=circles. Dashed line is mathematically expected engraftment level. (e) Analysis of PB RFP+ and GFP+ lymphoid (B220+ and CD3+) and myeloid (Gr1+/Mac1+) engraftment in 1° recipients. n=8; pooled from 1st and 2nd experiments. (f) 2° recipient PB analysis. Each data point is an individual recipient. Dashed line is mathematically expected engraftment level. (g) Analysis of PB RFP+ and GFP+ lymphoid (B220+ and CD3+) and myeloid (Gr1+/Mac1+) engraftment in 2° recipients 20 weeks post transplant. Data are grouped based on the 5 individual 2° donors. n=4 2°recipients per donor. UD=undetectable. Around 7–8-week-old female C57 mice were used for a and b. Around 6–7-week-old male RFP and GFP and 9-week-old female C57 recipients were used for d and e. Secondary C57 recipients were 7 weeks old (f,g). All data are mean±s.e.m. Analysis using one-way ANOVA (a,b), or t-test (d,f) *P<0.05, **P<0.01, ***P<0.005, ****P<0.001.
Figure 5
Figure 5. The combination of BOP and AMD3100 effectively mobilizes human CD34+ stem and progenitors in humanized NSG (huNSG) mice.
(a) Representative flow cytometric plot of huNSG PB. (b) Analysis of huCD45+CD34+ cell content in huNSG PB following mobilization. Data are expressed as fold increase in CD34+ cells per ml PB relative to saline control and each data point represents an individual animal. Red bar, mean. CB CD34+ cells were transplanted into 6–10-week-old female and male NSG mice. Analysis using one-way ANOVA, **P<0.01, ****P<0.001.

References

    1. Petit I. et al. G-CSF induces stem cell mobilization by decreasing bone marrow SDF-1 and up-regulating CXCR4. Nat. Immunol. 3, 687–694 (2002) . - PubMed
    1. Levesque J. P., Hendy J., Takamatsu Y., Simmons P. J. & Bendall L. J. Disruption of the CXCR4/CXCL12 chemotactic interaction during hematopoietic stem cell mobilization induced by GCSF or cyclophosphamide. J. Clin. Invest. 111, 187–196 (2003) . - PMC - PubMed
    1. Winkler I. G. et al. Hematopoietic stem cell mobilizing agents G-CSF, cyclophosphamide or AMD3100 have distinct mechanisms of action on bone marrow HSC niches and bone formation. Leukemia 26, 1594–1601 (2012) . - PubMed
    1. Cashen A. F., Lazarus H. M. & Devine S. M. Mobilizing stem cells from normal donors: is it possible to improve upon G-CSF? Bone Marrow Transplant. 39, 577–588 (2007) . - PubMed
    1. Gertz M. A. Current status of stem cell mobilization. Br. J. Haematol. 150, 647–662 (2010) . - PubMed

Publication types