. 2016 Apr 22;84(5):1650-1669.
doi: 10.1128/IAI.01438-15. Print 2016 May.

Multiscale Model of Mycobacterium tuberculosis Infection Maps Metabolite and Gene Perturbations to Granuloma Sterilization Predictions

Affiliations

Multiscale Model of Mycobacterium tuberculosis Infection Maps Metabolite and Gene Perturbations to Granuloma Sterilization Predictions

Elsje Pienaar et al. Infect Immun. .

Abstract

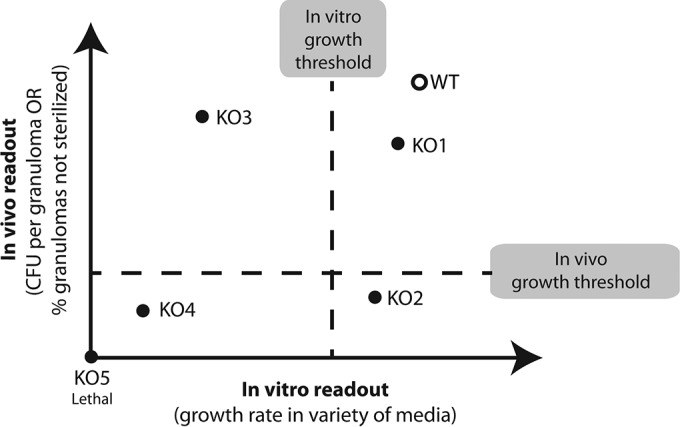
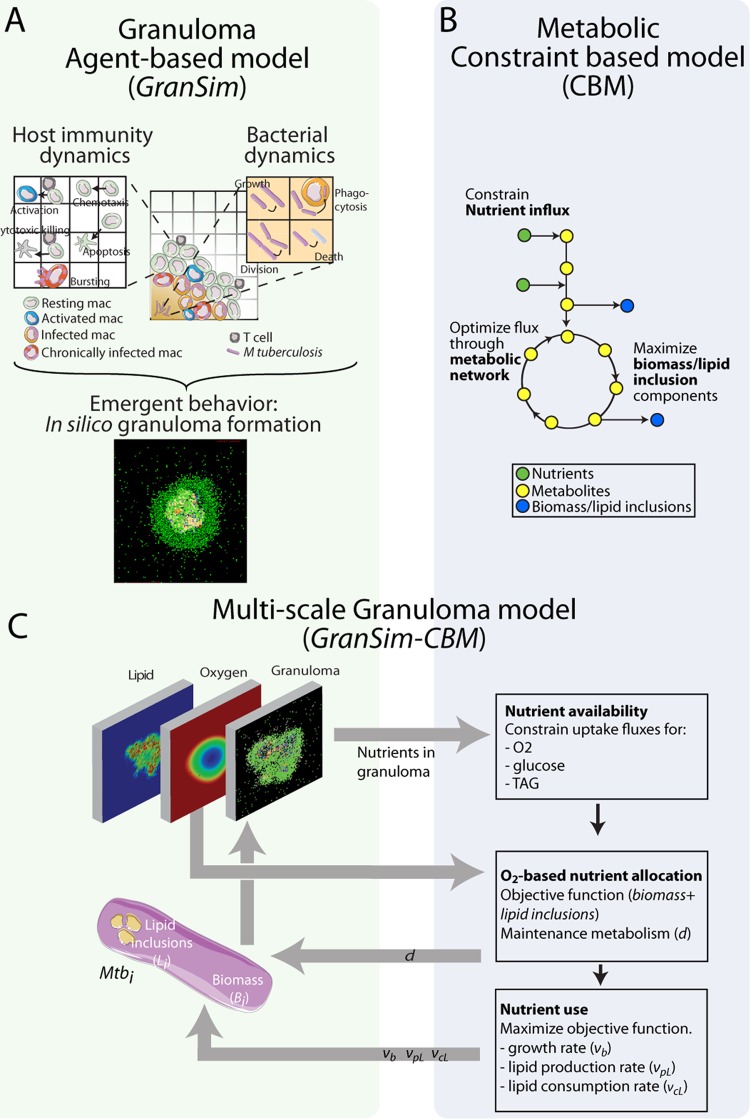
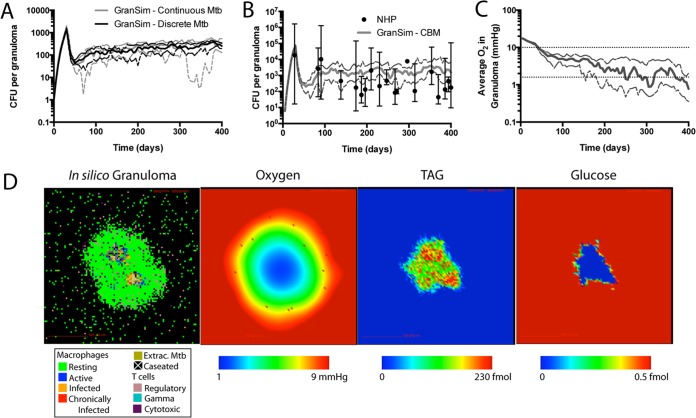
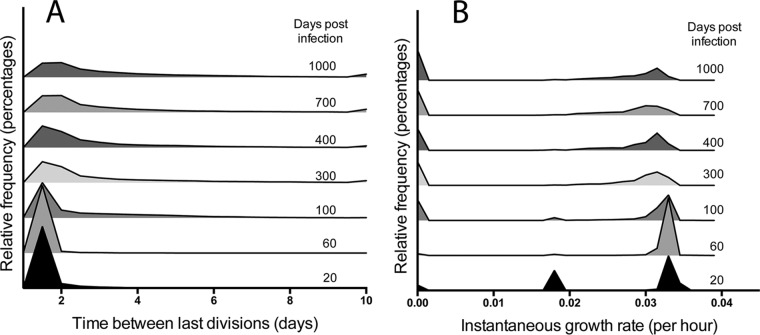
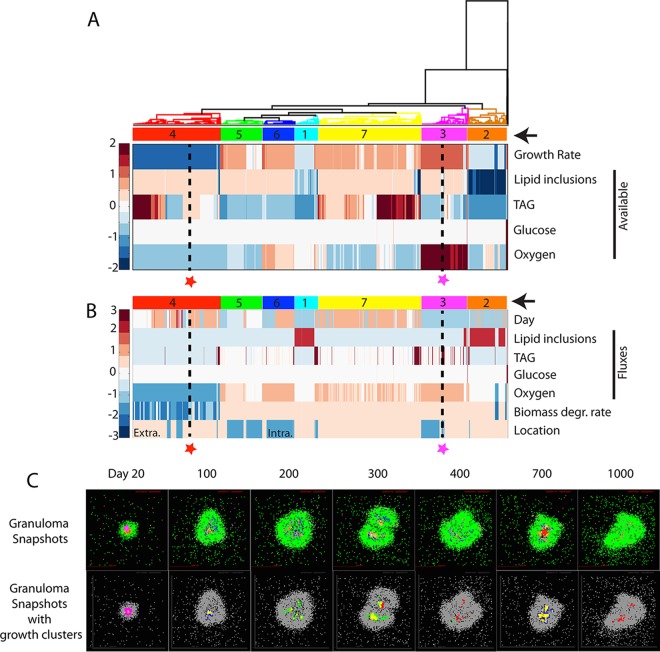
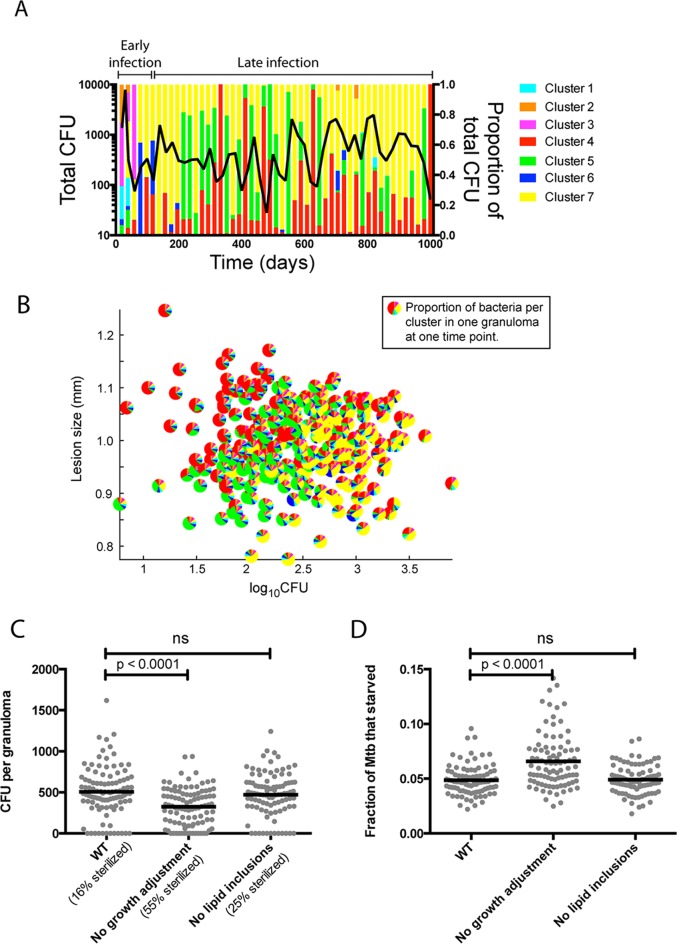
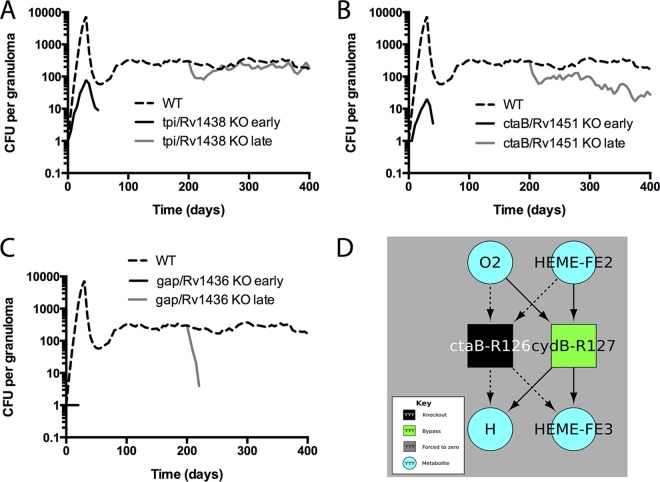
Granulomas are a hallmark of tuberculosis. Inside granulomas, the pathogen Mycobacterium tuberculosis may enter a metabolically inactive state that is less susceptible to antibiotics. Understanding M. tuberculosis metabolism within granulomas could contribute to reducing the lengthy treatment required for tuberculosis and provide additional targets for new drugs. Two key adaptations of M. tuberculosis are a nonreplicating phenotype and accumulation of lipid inclusions in response to hypoxic conditions. To explore how these adaptations influence granuloma-scale outcomes in vivo, we present a multiscale in silico model of granuloma formation in tuberculosis. The model comprises host immunity, M. tuberculosis metabolism, M. tuberculosis growth adaptation to hypoxia, and nutrient diffusion. We calibrated our model to in vivo data from nonhuman primates and rabbits and apply the model to predict M. tuberculosis population dynamics and heterogeneity within granulomas. We found that bacterial populations are highly dynamic throughout infection in response to changing oxygen levels and host immunity pressures. Our results indicate that a nonreplicating phenotype, but not lipid inclusion formation, is important for long-term M. tuberculosis survival in granulomas. We used virtual M. tuberculosis knockouts to predict the impact of both metabolic enzyme inhibitors and metabolic pathways exploited to overcome inhibition. Results indicate that knockouts whose growth rates are below ∼66% of the wild-type growth rate in a culture medium featuring lipid as the only carbon source are unable to sustain infections in granulomas. By mapping metabolite- and gene-scale perturbations to granuloma-scale outcomes and predicting mechanisms of sterilization, our method provides a powerful tool for hypothesis testing and guiding experimental searches for novel antituberculosis interventions.


Figures

FIG 1
FIG 1
Paradigm for predicting in vivo attenuations from in vitro experiments. In screening for M. tuberculosis drug targets, the correct method for mapping in vitro phenotypes of knockout (KO) mutants (bacterial scale) to in vivo outcomes (host tissue scale) is not obvious. Defining attenuated mutants relative to wild-type (WT) growth in vitro can result in incorrect identification of drug targets. For example, KO mutants can be identified as attenuated in vitro but can result in no attenuation when tested in vivo (i.e., false-positive attenuation prediction associated with, e.g., KO3). Or mutants could be dismissed as nonattenuated in vitro but could show attenuation in vivo (i.e., false-negative attenuation prediction associated with, e.g., KO2). Our model system is capable of bridging in vitro and in vivo outcomes. Results can be used to identify such misclassifications, to guide in vivo screening, and to suggest in vitro screening conditions that are more predictive of in vivo infection outcomes.
FIG 2
FIG 2
Multiscale model system bridging metabolic scale to tissue scale. (A) GranSim, our agent-based model of granuloma formation and function, incorporates host immune functions (see references , and for details) as well as bacterial dynamics for the first time on an individual-bacterium level. In silico granulomas are an emergent behavior of the system. mac, macrophages. (B) The constraint-based model (CBM) uses a stoichiometric matrix representing the metabolic network of M. tuberculosis (45) to predict growth rates based on the bacterial objective function (growth versus lipid inclusion production) (13). (C) The combination model GranSim-CBM tracks granuloma formation and environmental nutrient conditions (oxygen, TAG, and glucose) (left) and uses the CBM to predict growth rates and lipid inclusion formation for each bacterial agent based on its local environment and internal lipid inclusion stores (right). Mtbi, ith bacterial agent.
FIG 3
FIG 3
GranSim-CBM model calibration to experimental data. (A) Discretization of M. tuberculosis in GranSim does not affect bacterial loads in granulomas (CFU) compared to previous model versions with continuous M. tuberculosis representation (35–38, 40, 41). (B) GranSim-CBM is calibrated to experimental data from animal models of TB. GranSim-CBM predictions of CFU per granuloma are calibrated to measurements from the NHP model of TB (21, 77–79). (C) The predicted oxygen concentration in granulomas is calibrated to direct measurements in rabbit granulomas (lower dotted line), and the threshold for pimonidazole (PIMO) hypoxia stain is shown for reference (upper dotted line). For panels A to C, solid lines show medians and dashed lines show 95% confidence intervals. n = 15. (D) Snapshot of a representative in silico granuloma at 300 dpi, with predicted oxygen, TAG, and glucose levels within the granuloma. Extrac., extracellular.
FIG 4
FIG 4
Distributions of bacterial growth over time. (A) Histogram showing the distribution of populations of bacteria by generation time. Bacteria with generation times longer than 10 days are included in the histogram at the 10-day time point. (B) Histogram showing distribution of bacteria by instantaneous growth rate. Results are averages of 100 replicate simulations performed with the baseline parameter set in Table 4.
FIG 5
FIG 5
Hierarchical clustering of bacteria by nutrient conditions and spatial location. (A) Bacteria (columns) from multiple time points from a representative granuloma are hierarchically clustered based on growth rate and level of lipid inclusions, TAG, glucose, and oxygen available in each bacterium's immediate environment (rows). Data for each nutrient are standardized to the row average. Clusters are numbered and highlighted with color codes indicated by arrows on the right. Two bacteria are highlighted (red and magenta stars with black dashed lines) as examples discussed in the text. These two bacteria are also used as examples in the discussion of panels B and C. (B) Bacterial clusters from panel A are further characterized by plotting their time points (day), fluxes from the CBM (i.e., optimal uptake fluxes for each nutrient calculated by the CBM based on the available nutrients), biomass degradation rate, and cellular location. Values for each output are standardized by row values. Extra., extracellular; Intra., intracellular. (C) Bacteria and their growth clusters are localized within granulomas. Granuloma simulation snapshots are shown in the top row with agent colors corresponding to those in Fig. 3D. The example bacteria from panels A and B are located in these granuloma snapshots with stars in the panels for 20 dpi and 700 dpi. Bacterial growth clusters are shown in the granulomas (bottom row) using color codes of clusters from panels A and B.
FIG 6
FIG 6
Importance of growth adaptation for long-term survival of M. tuberculosis in granulomas. (A) Proportions of bacteria in each growth cluster (the 7 clusters identified in Fig. 5) were quantified every 20 days over the course of infection (right y axis) and plotted with total CFU (left y axis). (B) Each pie symbol represents 1 granuloma (data represent 300 granulomas randomly selected from a collection of 100 granulomas sampled at different time points after 200 dpi). Slices represent proportions of bacterial populations within each growth cluster. (C and D) Comparisons of WT simulations to simulations in which growth adaptation or the ability to accumulate lipid inclusions was removed. (C) Time-averaged CFU between 200 and 1,000 dpi. (D) Fraction of bacteria that died from starvation by 1,000 dpi (i.e., biomass < τdeath) for individual granulomas (n = 100). P values indicate results from the Kruskall-Wallis test with Dunn's correction for multiple comparisons. Lines show means. ns, not significant.
FIG 7
FIG 7
Bacterial loads over time for different virtual KO mutants. Data represent predicted total CFU (median) over time for the WT (dashed line), knockouts from the start of infection (black line), or mid-infection knockouts from 200 dpi (gray line). Data from three representative gene products are shown. (A) tpi/Rv1438, a triosephosphate isomerase which has a role in glycolysis. (B) ctaB/Rv1451, a cytochrome c oxidase assembly factor. (C) gap/Rv1436, a probable GAPDH (glyceraldehyde 3-phosphate dehydrogenase) involved in the second phase of glycolysis. n = 20 for the knockouts; n = 100 for the WT. (D) Bypass reactions identified by flux variability analysis (FVA). Squares represent chemical reactions corresponding to the enzyme label. Metabolites used or produced by any of the depicted reactions are included (teal circles). This diagram shows the reactions eliminated by a gene knockout (black square) and reactions that became “required” (defined as leading to attenuation if removed) in the knockout but that were not required in the WT (green square). Dashed arrows correspond to metabolite usage or production no longer present in the knockout (as the reaction has been removed); solid arrows correspond to reactants of the bypass (green) reactions. To summarize what can be gleaned from this figure, the protein encoded by ctaB is required for cytochrome bc1 oxidase activity. Thus, a knockout mutant in ctaB makes use of a bypass flux through cydB, which is part of the less efficient cytochrome bd complex. Under conditions in which cydB was also knocked out (or severely inhibited by drugs), the model predicts that M. tuberculosis would be further attenuated in growth (though not necessarily incapable of growth). Identical results were obtained for knockouts in any of the following genes annotated as required for cytochrome c oxidase activity: ctaB, ctaC, ctaD, ctaE, fixA, fixB, qcrA, qcrB, qcrC, and Rv1456c.
FIG 8
FIG 8
Predicting in vivo attenuations from in vitro M. tuberculosis growth rates. We implemented the paradigm described in Fig. 1 by correlating CBM-predicted growth rates and average GranSim-CBM-predicted CFU per granuloma. We plotted CBM-predicted growth rates for single gene knockouts in rich media (A) or lipid-only media (B and C) versus average GranSim-CBM predicted CFU per granuloma when knocked out from the start of infection (A and B) or knocked out mid-infection at 200 dpi (C). Scatter plot of means ± standard errors of the means (SEM) (n = 20) for each knockout and wild type. Note that the high-CFU-burden knockouts can be cleanly separated from the low-CFU-burden knockouts on the basis of the CBM growth rate in lipid-only media but that the timing of the knockout moves the in vitro threshold to the left (arrow in panel C).

References

    1. McFee RB. 2013. Update—pathogens of concern. Dis Mon 59:437–438. doi:10.1016/j.disamonth.2013.10.006. - DOI - PubMed
    1. WHO. 2014. Global tuberculosis report. WHO, Geneva, Switzerland.
    1. Gengenbacher M, Kaufmann SH. 2012. Mycobacterium tuberculosis: success through dormancy. FEMS Microbiol Rev 36:514–532. doi:10.1111/j.1574-6976.2012.00331.x. - DOI - PMC - PubMed
    1. Gomez JE, McKinney JD. 2004. M. tuberculosis persistence, latency, and drug tolerance. Tuberculosis (Edinb) 84:29–44. doi:10.1016/j.tube.2003.08.003. - DOI - PubMed
    1. Aldridge BB, Fernandez-Suarez M, Heller D, Ambravaneswaran V, Irimia D, Toner M, Fortune SM. 2012. Asymmetry and aging of mycobacterial cells lead to variable growth and antibiotic susceptibility. Science 335:100–104. doi:10.1126/science.1216166. - DOI - PMC - PubMed

Publication types

LinkOut - more resources