

Carbon isotopes characterize rapid changes in atmospheric carbon dioxide during the last deglaciation
- PMID: 26976561
- PMCID: PMC4822573
- DOI: 10.1073/pnas.1513868113
Carbon isotopes characterize rapid changes in atmospheric carbon dioxide during the last deglaciation
Abstract
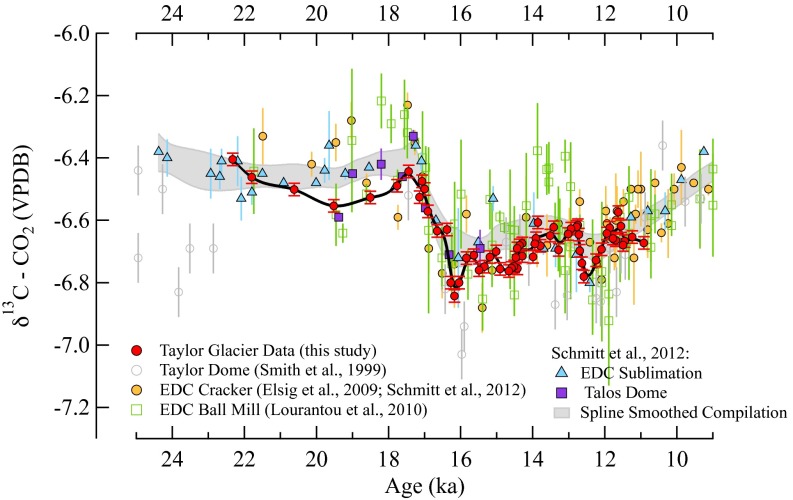
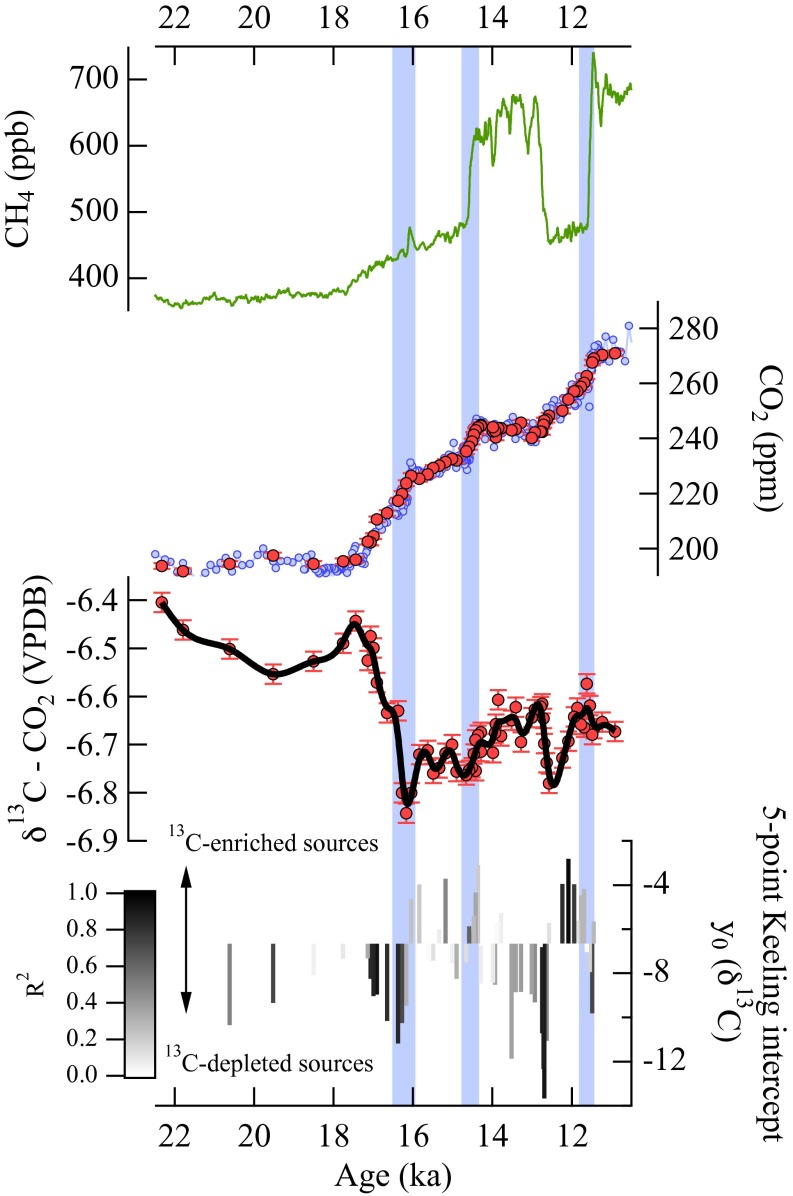
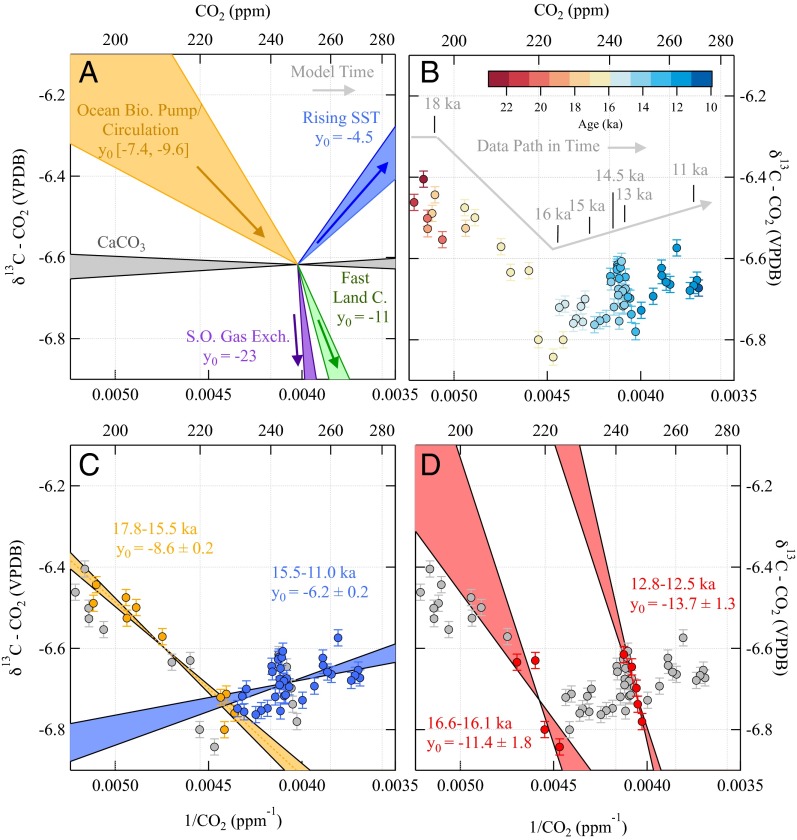
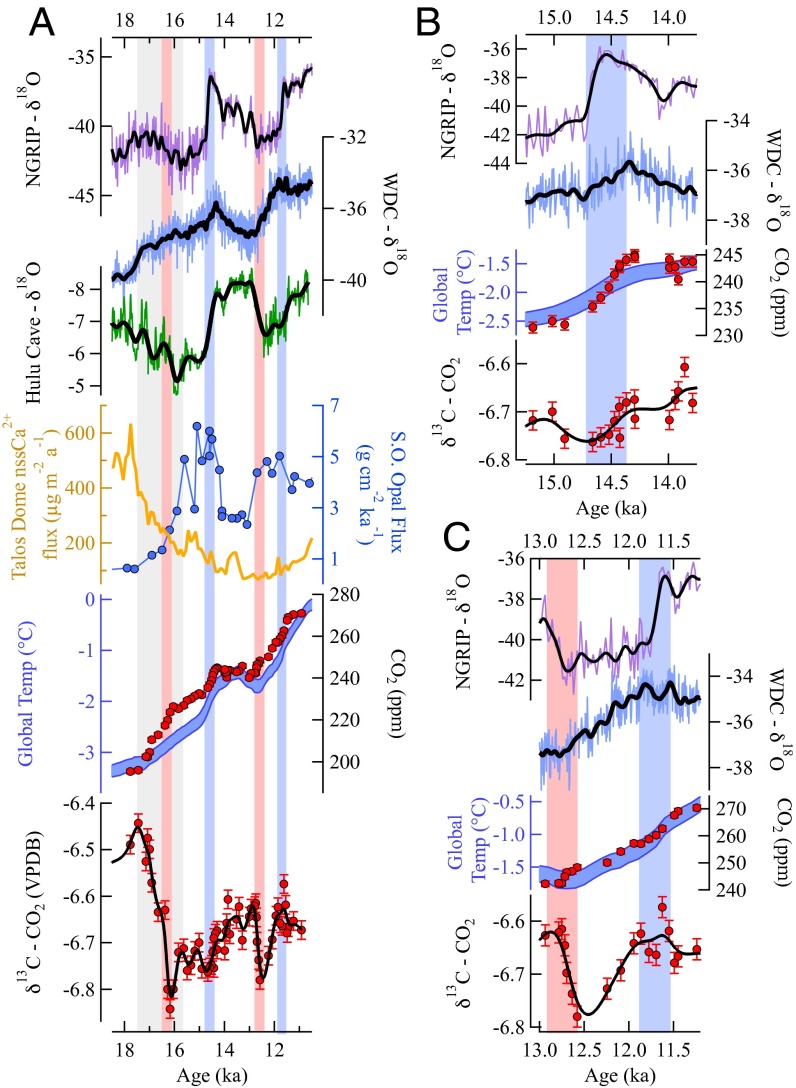
An understanding of the mechanisms that control CO2 change during glacial-interglacial cycles remains elusive. Here we help to constrain changing sources with a high-precision, high-resolution deglacial record of the stable isotopic composition of carbon in CO2(δ(13)C-CO2) in air extracted from ice samples from Taylor Glacier, Antarctica. During the initial rise in atmospheric CO2 from 17.6 to 15.5 ka, these data demarcate a decrease in δ(13)C-CO2, likely due to a weakened oceanic biological pump. From 15.5 to 11.5 ka, the continued atmospheric CO2 rise of 40 ppm is associated with small changes in δ(13)C-CO2, consistent with a nearly equal contribution from a further weakening of the biological pump and rising ocean temperature. These two trends, related to marine sources, are punctuated at 16.3 and 12.9 ka with abrupt, century-scale perturbations in δ(13)C-CO2 that suggest rapid oxidation of organic land carbon or enhanced air-sea gas exchange in the Southern Ocean. Additional century-scale increases in atmospheric CO2 coincident with increases in atmospheric CH4 and Northern Hemisphere temperature at the onset of the Bølling (14.6-14.3 ka) and Holocene (11.6-11.4 ka) intervals are associated with small changes in δ(13)C-CO2, suggesting a combination of sources that included rising surface ocean temperature.
Keywords: atmospheric CO2; carbon cycle; ice cores; last deglaciation; paleoclimate.
Conflict of interest statement
The authors declare no conflict of interest.
Figures
References
-
- Berner W, Oeschger H, Stauffer B. Information on the CO2 cycle from ice core Studies. Radiocarbon. 1980;22(2):227–235.
-
- Delmas RJ, Ascencio J-M, Legrand M. Polar ice evidence that atmospheric CO2 20,000 yr BP was 50% of present. Nature. 1980;284(5752):155–157.
-
- Kohfeld KE, Ridgwell A. Glacial-interglacial variability in atmospheric CO2. Geophys Monogr Ser. 2009;187:251–286.
-
- Ciais P, et al. 2013. Carbon and other biogeochemical cycles. Climate Change: The Physical Science Basis. Contribution of Working Group I to the Fifth Assessment Report of the Intergovernmental Panel on Climate Change eds Stocker, T.F., et al. (Cambridge Univ Press, Cambridge, UK), pp 465–570.
-
- Toggweiler JR. Variation of atmospheric CO2 by ventilation of the ocean’s deepest water. Paleoceanography. 1999;14(5):571–588.
Publication types
LinkOut - more resources
Full Text Sources
Other Literature Sources
