. 2016 Mar 29;113(13):3497-502.
doi: 10.1073/pnas.1516139113. Epub 2016 Mar 14.

Optogenetic skeletal muscle-powered adaptive biological machines

Affiliations

Optogenetic skeletal muscle-powered adaptive biological machines

Ritu Raman et al. Proc Natl Acad Sci U S A. .

Abstract

Complex biological systems sense, process, and respond to their surroundings in real time. The ability of such systems to adapt their behavioral response to suit a range of dynamic environmental signals motivates the use of biological materials for other engineering applications. As a step toward forward engineering biological machines (bio-bots) capable of nonnatural functional behaviors, we created a modular light-controlled skeletal muscle-powered bioactuator that can generate up to 300 µN (0.56 kPa) of active tension force in response to a noninvasive optical stimulus. When coupled to a 3D printed flexible bio-bot skeleton, these actuators drive directional locomotion (310 µm/s or 1.3 body lengths/min) and 2D rotational steering (2°/s) in a precisely targeted and controllable manner. The muscle actuators dynamically adapt to their surroundings by adjusting performance in response to "exercise" training stimuli. This demonstration sets the stage for developing multicellular bio-integrated machines and systems for a range of applications.

Keywords: bioactuator; soft robotics; stereolithography; tissue engineering.


Conflict of interest statement

The authors declare no conflict of interest.

Figures

Fig. 1.
Fig. 1.
Design and fabrication of optogenetic muscle ring-powered bio-bots. (A) Stereolithographic 3D printing is used to fabricate ring and strip injection molds and bio-bot skeletons from a PEGDA photosensitive resin. (B) C2C12 myoblasts are engineered to incorporate a mutant variant of the blue-light sensitive cation channel, Channelrhodopsin-2, in the cell membrane. The ion channel is tagged with a red fluorescent tdTomato tag. (C) Optogenetic myoblasts embedded within a natural hydrogel matrix. (D) Injection molding of cell/gel solution into muscle strip and ring molds. (E) Manual transfer of muscle rings from the injection mold to the bio-bot skeleton (Movie S1). (F) Optimization of muscle ring thickness as a function of cell concentration.
Fig. S1.
Fig. S1.
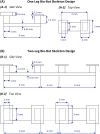
(A) Design dimensions for asymmetric one-leg bio-bot skeletons shown as side view (A-1) and top view (A-2) schematics. (B) Design dimensions for symmetric two-leg bio-bot skeletons shown as side view (B-1) and top view (B-2) schematics.
Fig. S2.
Fig. S2.
Schematic showing timeline of growth, differentiation, and exercise training of tissue engineered modular muscle ring actuators.
Fig. S3.
Fig. S3.
(A) Characterization of ring thickness as a function of fibrin concentration. A concentration of 4 mg/mL was chosen for its ability to generate compact muscle strips with high cellular density. Higher concentrations than this resulted in marginal changes in muscle strip thickness. (B) The dimensions of rings can be readily modified to power larger-scale bio-bot structures by adjusting the volume of the cell/gel solution. This ring was formed from 240 µL cell/gel solution, compared with those used in the study, which were formed from 120 µL cell/gel solution. (C) The modularity of the muscle ring actuator design allows for the addition of multiple muscle rings per device, providing an added mechanism of improving functional performance of bio-integrated machines and systems in the future. (D) The modularity of the muscle ring actuator design also enables the fabrication of multilegged bio-bot structures, such as the “four-leg” bio-bot shown here. Because directional locomotion and 2D steering proved to be achievable even with two-leg structures, only data for two-leg structures were presented in this study.
Fig. 2.
Fig. 2.
Characterization of muscle ring architecture. (A) Alignment of myotubes within various regions of muscle rings assessed via FFT analysis of fluorescent myosin marker. Fluorescence image (Upper Left), FFT (Upper Right), and normalized gray value of the FFT as a function of angle (Lower Left) are presented for three regions of muscle rings, shown as green highlights on a whole device (Lower Right). (B) Multichannel fluorescence imaging of DAPI cell nucleus marker, the optogenetic ChR2 tdTomato tag, and the MF-20 myosin marker imaged via confocal fluorescence microscopy and presented as a merged 3D stack. (C) Scanning electron microscopy image of muscle ring surface. (D) Cross-section of fluorescent immunostained muscle ring, showing uniform distribution of mature functional myotubes throughout the entire cross-section.
Fig. S4.
Fig. S4.
(A) Passive tension force produced by muscle strips and muscle rings. There is no significant difference between the passive tension forces produced by muscle strips and rings (P < 0.05, n = 9, one-way ANOVA, post hoc Tukey test). (B) Optogenetic muscle rings produced paced contractions in response to optical stimulus at frequencies from 1 to 4 Hz. Muscle rings tested at higher-frequency stimulations produced paced contractions until a tetanus frequency above 8–10 Hz (n = 4). (C) Effect of increasing optical intensity on the directional locomotive speed of optically stimulated asymmetric one-leg bio-bots. A maximum energy density of 1.9 mW/mm2 was used for all experiments presented in this study. (D) Active tension force produced by muscle strips and rings in response to electrical stimulation reveals that electrical stimulation produces comparable contractile forces for both actuator designs (P < 0.05, n = 3, one-way ANOVA, post hoc Tukey test).
Fig. 3.
Fig. 3.
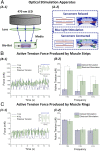
Optically stimulated actuation of muscle strips and rings. (A) Apparatus used to optically stimulate engineered muscle. (A-1) 470-nm light is focused on to bio-bots at a maximum intensity of 1.9 mW/mm2. (A-2) At the microscale, light stimulation induces contraction of individual myotubes. The coordinated contraction of several sarcomeres produces observable macroscale contraction. (B) Active tension force produced by muscle strips (day 12). (B-1) Active tension force tracked over time for a representative muscle strip. Inset of 4-Hz stimulation over 2 s shown for clarity, with a dashed blue line indicating the stimulus pulse train. (B-2) Active tension force compared between optical and electrical stimulation of muscle strips (P < 0.05, n = 3, one-way ANOVA, post hoc Tukey test). (C) Active tension force produced by muscle rings (day 12). (C-1) Active tension force tracked over time for a representative muscle ring. Inset of 4-Hz stimulation over 2 s shown for clarity, with a dashed blue line indicating the stimulus pulse train. (C-2) Active tension force compared between optical and electrical stimulation of muscle rings (P < 0.05, n = 3, one-way ANOVA, post hoc Tukey test). All data are presented as mean ± SD.
Fig. 4.
Fig. 4.
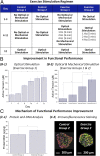
Functional performance optimization via exercise training. (A) Exercise stimulation regimen for four experimental groups during growth (days 1–3) and differentiation (days 4–11) (Fig. S2). Force output in response to optical stimulation is compared on day 12. (B) Improvement of muscle functional performance in response to optical conditioning. (B-1) Active tension produced by exercise group 1 assessed from days 7 to 12 (P < 0.05, n = 3, one-way ANOVA, post hoc Tukey test). (B-2) Active tension comparison between all four experimental groups (Movie S2) (P < 0.05, n = 3, one-way ANOVA, post hoc Tukey test). (C) Assessment of mechanisms underlying functional performance improvement. (C-1) Ratio of protein content to DNA content measured for control group 2 and exercise group 2 (P < 0.05, n = 4, one-way ANOVA, post hoc Tukey test). (C-2) Immunofluorescence stained cross-sections of exercise group 2 and control group 2, showing visibly greater expression of myosin marker in exercised muscle rings. All data are presented as mean ± SD.
Fig. 5.
Fig. 5.
Optically stimulated 1D locomotion. (A) Directional locomotion of optogenetic muscle ring powered bio-bots shown as a schematic (A-1) and time lapse images from a movie (A-2) (Movie S3). (B) Assessment of bio-bot speed from control group 2 and exercise group 2 in response to optical and electrical stimulation at 1 Hz (P < 0.05, n = 3, one-way ANOVA, post hoc Tukey test). (C) Speed-frequency response of bio-bots at 1 and 4 Hz. Inset shows displacement over a 3-s time period for clarity. All data are presented as mean ± SD.
Fig. 6.
Fig. 6.
Optically stimulated 2D locomotion and steering. (A) Whole device stimulation of a geometrically symmetric two-leg bio-bot shows zero net locomotion predicted via FEA (A-1; Movie S4) and confirmed via electrical stimulation (A-2; Movie S5). Side view image of two-leg device shown for clarity. (B) Single leg stimulation of a geometrically symmetric structure drives locomotion in the direction of the stimulated leg predicted via FEA (B-1; Movie S6) and confirmed via optical stimulation for the same device presented in A-2 (B-2; Movie S7). (C) Half of a single leg in a geometrically symmetric structure is stimulated to drive rotational locomotion, as predicted via FEA (C-1; Movie S8) and confirmed via optical stimulation for the same device presented in A-2 and B-2 (C-2; Movie S9). Statistical analyses of multiple two-legged bio-bots is presented in Fig. S5.
Fig. S5.
Fig. S5.
(A) Directional locomotion in response to single-leg stimulation of two-legged bio-bots. (A-1) X-Y tracking of top-view movies of bio-bots over 15 s at 2-Hz optical stimulation. Average locomotive speed for exercise group 2 bio-bots is 312 ± 63 µm/s. Devices also demonstrated small rotations under full-ring stimulation, with an average speed of 0.24 ± 0.1°/s. (A-2) Comparison of directional locomotive speed in response to optical stimulation at 2 Hz for exercise group 2 bio-bots (labeled E) (n = 6) and control group 2 bio-bots (labeled C) (n = 3). Exercised bio-bots demonstrate significantly higher locomotive speeds than control bio-bots (P < 0.05, one-way ANOVA, post hoc Tukey test). (B) Rotational locomotion in response to half-leg stimulation of two-legged bio-bots. (B-1) X-Y tracking of top-view movies of the same bio-bots presented in A-1 over 15 s at 2-Hz optical stimulation. Average rotational speed for exercise group 2 bio-bots is 2.1 ± 0.5°/s. Devices also small translocations under full-ring stimulation, with an average speed of 33 ± 10 µm/s. (B-2) Comparison of rotational locomotive speed in response to optical stimulation at 2 Hz for exercise group 2 bio-bots (labeled E) (n = 6) and control group 2 bio-bots (labeled C) (n = 3). Exercised bio-bots demonstrate significantly higher locomotive speeds than control bio-bots (P < 0.05, one-way ANOVA, post hoc Tukey test).

References

    1. Griffith LG, Naughton G. Tissue engineering—Current challenges and expanding opportunities. Science. 2002;295(5557):1009–1014. - PubMed
    1. Harrison RH, St-Pierre J-P, Stevens MM. Tissue engineering and regenerative medicine: A year in review. Tissue Eng Part B Rev. 2014;20(1):1–16. - PubMed
    1. Kamm RD, Bashir R. Creating living cellular machines. Ann Biomed Eng. 2014;42(2):445–459. - PMC - PubMed
    1. Egan P, Moore J, Schunn C, Cagan J, LeDuc P. Emergent systems energy laws for predicting myosin ensemble processivity. PLOS Comput Biol. 2015;11(4):e1004177. - PMC - PubMed
    1. Chan V, Asada HH, Bashir R. Utilization and control of bioactuators across multiple length scales. Lab Chip. 2014;14(4):653–670. - PubMed

Publication types