. 2016 Mar 29;113(13):E1826-34.
doi: 10.1073/pnas.1519286113. Epub 2016 Mar 14.

Identification of tissue-specific cell death using methylation patterns of circulating DNA

Affiliations

Identification of tissue-specific cell death using methylation patterns of circulating DNA

Roni Lehmann-Werman et al. Proc Natl Acad Sci U S A. .

Abstract

Minimally invasive detection of cell death could prove an invaluable resource in many physiologic and pathologic situations. Cell-free circulating DNA (cfDNA) released from dying cells is emerging as a diagnostic tool for monitoring cancer dynamics and graft failure. However, existing methods rely on differences in DNA sequences in source tissues, so that cell death cannot be identified in tissues with a normal genome. We developed a method of detecting tissue-specific cell death in humans based on tissue-specific methylation patterns in cfDNA. We interrogated tissue-specific methylome databases to identify cell type-specific DNA methylation signatures and developed a method to detect these signatures in mixed DNA samples. We isolated cfDNA from plasma or serum of donors, treated the cfDNA with bisulfite, PCR-amplified the cfDNA, and sequenced it to quantify cfDNA carrying the methylation markers of the cell type of interest. Pancreatic β-cell DNA was identified in the circulation of patients with recently diagnosed type-1 diabetes and islet-graft recipients; oligodendrocyte DNA was identified in patients with relapsing multiple sclerosis; neuronal/glial DNA was identified in patients after traumatic brain injury or cardiac arrest; and exocrine pancreas DNA was identified in patients with pancreatic cancer or pancreatitis. This proof-of-concept study demonstrates that the tissue origins of cfDNA and thus the rate of death of specific cell types can be determined in humans. The approach can be adapted to identify cfDNA derived from any cell type in the body, offering a minimally invasive window for diagnosing and monitoring a broad spectrum of human pathologies as well as providing a better understanding of normal tissue dynamics.

Keywords: circulating DNA; diagnosis; methylation.


Conflict of interest statement

Conflict of interest statement: C.D. and M.G. are the inventors of antibodies directed against human pancreatic cells, HPx1/HIC0-3B3 and HPd3/DHIC5-4D9. Oregon Health & Science University (OHSU) has commercially licensed this technology. This potential conflict of interest has been reviewed and managed by OHSU.

Figures

Fig. S1.
Fig. S1.
Flowchart of the method of detecting circulating DNA derived from a specific tissue. (A) Procedure for identifying tissue-specific methylation markers. (B) Procedure for determining levels of tissue-specific cfDNA.
Fig. 1.
Fig. 1.
β-Cell–derived DNA in the circulation of T1D patients. (A) Structure of the INS promoter fragment used as a marker. Lollipops represent CpG sites; arrows mark positions of PCR primers. (B) Methylation status of individual CpG sites in the INS promoter in multiple tissues. The graph shows the percentage of unmethylated molecules in DNA from each tissue. The set of columns on the far right describes the percentage of molecules in which all six CpG sites are unmethylated, demonstrating the increase in signal-to-noise ratio afforded by interrogating all six CpGs simultaneously. (C) Spike in experiment. Human β-cell DNA was mixed with human lymphocyte DNA in the indicated proportions (0.1% to 10%), and the percentage of fully unmethylated INS promoters (in which all six CpG sites were converted by bisulfite to T) was determined. (D) β-Cell–derived DNA in the plasma of healthy controls. The fraction of fully unmethylated INS promoter DNA molecules (reflective of the fraction of β-cell–derived cfDNA) (Table S1) was multiplied by the absolute level of cfDNA measured in each individual. This value (in nanograms per milliliter) was multiplied by 330 to obtain the number of copies of β-cell–derived INS/mL plasma. (E) β-Cell–derived DNA in the plasma of recently diagnosed T1D patients. Mann–Whitney test for controls vs. patients, P < 0.0001. (F) β-Cell–derived DNA in the plasma of long-time T1D patients sampled at the indicated time points after intrahepatic islet transplantation. (G) Correlation between the number of transplanted islets (IE, islet equivalents; each islet contains ∼1,000 β cells) per kilogram and β-cell copies/mL 1–2 h after transplantation. n = 9 patients. (H) Correlation between plasma c-peptide levels and unmethylated INS promoter cfDNA 1–2 h after islet transplantation. n = 8 patients.
Fig. S2.
Fig. S2.
Methylation of the INS promoter in the plasma of healthy volunteers and patients with recently diagnosed T1D. (A) Methylation status of individual CpG sites at the INS promoter. (B) Methylation status of an expanded window of four to six CpGs expressed as the percent of unmethylated DNA in the patients in A.
Fig. 2.
Fig. 2.
Identification of oligodendrocyte-derived cfDNA in MS. (A) Methylation status of MBP3 and WM1 in DNA from multiple tissues and from sorted human neurons and oligodendrocytes (see also Figs. S3 and S4). (B) Spike-in experiments. Brain DNA was mixed with lymphocyte DNA, and lack of methylation of oligodendrocyte markers was used to estimate the fraction of oligodendrocyte DNA in the mixtures. Note that the measured frequency is lower than the input frequency, likely because input (brain DNA in this case) is a mixture of DNA from glial and other cell types. (C) Oligodendrocyte-derived DNA in the serum or plasma of healthy individuals, derived from the fraction of oligodendrocyte DNA (Table S1) and the total amount of cfDNA. (D) Oligodendrocyte-derived DNA in the serum of remitting and relapsing MS/NMO patients. The graph shows the cumulative values of unmethylated MBP3 and WM1 in each sample. Controls vs. stable disease, P = 0.6; controls vs. relapsing disease, P < 0.0001; stable vs. relapsing disease, P < 0.0001; controls vs. all patients, P = 0.021.
Fig. S3.
Fig. S3.
Methylation of the 3′ UTR of MBP3. (A) Structure of the MBP3 3′ UTR fragment used as marker. Lollipops represent CpGs. The empty lollipop represents the CpG detected in the Illumina 450k array. Arrows mark positions of PCR primers. (B) Methylation status of the individual CpG site at the MBP3 locus captured in the Illumina 450k array. Data are from publicly available 450k arrays (see Selection of Methylation Biomarkers). (C) Methylation status of individual CpG sites and an expanded window of multiple CpGs from the MBP3 locus, in multiple tissues, as determined by deep sequencing. (D) Methylation of individual CpG sites from the MBP3 locus in the serum of healthy controls and relapsing MS/NMO patients. (E) Fraction of unmethylated MBP3 locus fragments in the serum of healthy volunteers and in the MS/NMO patients in D. Total unmethylated MBP3 locus DNA expressed in nanograms per milliliter of serum is shown in Fig. 2C.
Fig. S3.
Fig. S3.
Methylation of the 3′ UTR of MBP3. (A) Structure of the MBP3 3′ UTR fragment used as marker. Lollipops represent CpGs. The empty lollipop represents the CpG detected in the Illumina 450k array. Arrows mark positions of PCR primers. (B) Methylation status of the individual CpG site at the MBP3 locus captured in the Illumina 450k array. Data are from publicly available 450k arrays (see Selection of Methylation Biomarkers). (C) Methylation status of individual CpG sites and an expanded window of multiple CpGs from the MBP3 locus, in multiple tissues, as determined by deep sequencing. (D) Methylation of individual CpG sites from the MBP3 locus in the serum of healthy controls and relapsing MS/NMO patients. (E) Fraction of unmethylated MBP3 locus fragments in the serum of healthy volunteers and in the MS/NMO patients in D. Total unmethylated MBP3 locus DNA expressed in nanograms per milliliter of serum is shown in Fig. 2C.
Fig. S4.
Fig. S4.
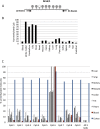
Methylation of CG10809560 and adjacent CpG sites (the WM1 locus). (A) Structure of the WM1 locus fragment used as marker. Lollipops represent CpGs. The empty lollipop represents the CpG detected in the Illumina 450k array. Arrows mark positions of PCR primers. (B) Methylation status of WM1 in multiple tissues as recorded in publicly available Illumina 450k arrays. (C) Methylation status of individual CpG sites and expanded window of multiple CpGs from the WM1 locus, in multiple tissues, as determined by deep sequencing. (D) Methylation of individual CpG sites from the WM1 locus in the serum of healthy controls and relapsing MS/NMO patients. (E) Fraction of unmethylated WM1 DNA fragments in the serum of healthy volunteers and in the MS/NMO patients in D.
Fig. S4.
Fig. S4.
Methylation of CG10809560 and adjacent CpG sites (the WM1 locus). (A) Structure of the WM1 locus fragment used as marker. Lollipops represent CpGs. The empty lollipop represents the CpG detected in the Illumina 450k array. Arrows mark positions of PCR primers. (B) Methylation status of WM1 in multiple tissues as recorded in publicly available Illumina 450k arrays. (C) Methylation status of individual CpG sites and expanded window of multiple CpGs from the WM1 locus, in multiple tissues, as determined by deep sequencing. (D) Methylation of individual CpG sites from the WM1 locus in the serum of healthy controls and relapsing MS/NMO patients. (E) Fraction of unmethylated WM1 DNA fragments in the serum of healthy volunteers and in the MS/NMO patients in D.
Fig. 3.
Fig. 3.
Identification of brain-derived cfDNA after brain damage. (A) Methylation status of CpG sites at the CG09787504 locus (Brain1) in multiple tissues, as determined by deep sequencing. Bars represent the percentage of molecules in which all nine CpGs of the locus are unmethylated. (B) Spike-in experiment. Cortex DNA was mixed with lymphocyte DNA, and lack of methylation of Brain1 was used to estimate the fraction of brain DNA in the mixtures. (C) Brain-derived DNA in the serum or plasma of 47 healthy volunteers, derived from the fraction of fully unmethylated Brain1 molecules (Table S1) and the amount of cfDNA in each individual. (D) Brain-derived DNA in the serum of 10 patients after cardiac arrest. Each patient was sampled immediately after resuscitation (“acute”) and at subsequent time points. Healthy controls vs. patients (all time points), P < 0.0001. (E) Brain-derived DNA in the serum of 15 patients after TBI, sampled at different days after admission to a neurotrauma unit. Healthy controls vs. patients (all time points), P < 0.005.
Fig. S5.
Fig. S5.
Methylation of brain marker CG09787504 (Brain1) and adjacent CpG sites. (A) Structure of Brain1 locus fragment used as marker. Lollipops represent CpGs. The empty lollipop represents the CpG detected in the Illumina 450k array. Arrows mark positions of PCR primers. (B) Methylation status of Brain1 in multiple tissues as recorded in publicly available Illumina 450k arrays. (C) Methylation status of individual CpG sites and expanded window of multiple CpGs from the Brain1 locus in multiple tissues, as determined by deep sequencing. (D) Methylation of individual CpG sites from the Brain1 locus in the serum of healthy controls and patients after cardiac arrest. (E) Fraction of unmethylated Brain1 DNA fragments in the serum of healthy volunteers and the patients in D.
Fig. S5.
Fig. S5.
Methylation of brain marker CG09787504 (Brain1) and adjacent CpG sites. (A) Structure of Brain1 locus fragment used as marker. Lollipops represent CpGs. The empty lollipop represents the CpG detected in the Illumina 450k array. Arrows mark positions of PCR primers. (B) Methylation status of Brain1 in multiple tissues as recorded in publicly available Illumina 450k arrays. (C) Methylation status of individual CpG sites and expanded window of multiple CpGs from the Brain1 locus in multiple tissues, as determined by deep sequencing. (D) Methylation of individual CpG sites from the Brain1 locus in the serum of healthy controls and patients after cardiac arrest. (E) Fraction of unmethylated Brain1 DNA fragments in the serum of healthy volunteers and the patients in D.
Fig. 4.
Fig. 4.
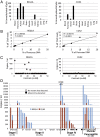
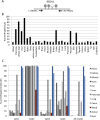
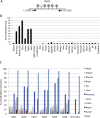
Identification of exocrine pancreas-derived cfDNA in patients with pancreatic cancer or pancreatitis. (A) Methylation status of CpG clusters in the CUX2 and REG1A loci in multiple tissues. CUX2 appears to be unmethylated selectively in ducts, whereas REG1A is unmethylated in both ducts and acinar cells and also in ∼30% of colon cells. (B) Spike-in experiments. Pancreas DNA was mixed with lymphocyte DNA, and unmethylated REG1A and CUX2 were used to estimate the fraction of exocrine pancreas DNA in the mixtures. (C) Levels of unmethylated CUX2 and REG1A DNA fragments in plasma or serum of healthy individuals, derived from the fraction of exocrine pancreas cfDNA (Table S1) and the concentration of cfDNA. (D) Levels of unmethylated exocrine pancreas markers in the circulation of patients with pancreatic cancer or chronic pancreatitis. The graph shows the intensity of the signal from each marker for each patient, after reducing the background (the highest signal seen among healthy controls: 520 and 2.9 copies/mL for REG1A and CUX2 respectively; see C). Controls vs. all cancer patients, P < 0.0001; controls vs. localized cancer, P < 0.0001; controls vs. metastatic disease, P < 0.0001; localized vs. metastatic cancer, P = 0.047; controls vs. pancreatitis, P < 0.0001. Circles under the graph mark cfDNA samples that were tested for KRAS mutations. Filled circles indicate a mutation in codon 12 or 13 of KRAS was detected; empty circles indicate a KRAS mutation was not detected.
Fig. S6.
Fig. S6.
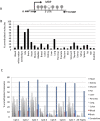
Methylation of the CpG cluster near the REG1A gene. (A) Structure of the REG1A fragment used as marker. Lollipops represent CpGs. The empty lollipop represents the CpG detected in the Illumina 450k array. Arrows mark positions of PCR primers. (B) Methylation status of the individual CpG site in the REG1A locus that is captured in the Illumina 450k array. Data are from publicly available 450k arrays (see Selection of Methylation Biomarkers). (C) Methylation status of individual CpG sites and expanded window of multiple CpGs from the REG1A locus in multiple tissues, as determined by deep sequencing. (D) Methylation of individual CpG sites from the REG1A locus in the serum of healthy controls and patients with pancreatic cancer. (E) Fraction of unmethylated REG1A fragments in the serum of healthy volunteers and patients in D.
Fig. S6.
Fig. S6.
Methylation of the CpG cluster near the REG1A gene. (A) Structure of the REG1A fragment used as marker. Lollipops represent CpGs. The empty lollipop represents the CpG detected in the Illumina 450k array. Arrows mark positions of PCR primers. (B) Methylation status of the individual CpG site in the REG1A locus that is captured in the Illumina 450k array. Data are from publicly available 450k arrays (see Selection of Methylation Biomarkers). (C) Methylation status of individual CpG sites and expanded window of multiple CpGs from the REG1A locus in multiple tissues, as determined by deep sequencing. (D) Methylation of individual CpG sites from the REG1A locus in the serum of healthy controls and patients with pancreatic cancer. (E) Fraction of unmethylated REG1A fragments in the serum of healthy volunteers and patients in D.
Fig. S7.
Fig. S7.
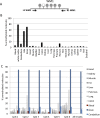
Methylation of the CpG cluster near the CUX2 gene. (A) Structure of the CUX2 fragment used as marker. Lollipops represent CpGs. The empty lollipop represents the CpG detected in the Illumina 450k array. Arrows mark positions of PCR primers. (B) Methylation status of the individual CpG site at the CUX2 locus that is captured in the Illumina 450k array. Data are from publicly available 450k arrays (see Selection of Methylation Biomarkers). (C) Methylation status of individual CpG sites and the expanded window of multiple CpGs from the CUX2 locus in multiple tissues, as determined by deep sequencing. (D) Methylation of individual CpG sites from the CUX2 locus in the serum of healthy controls and patients with pancreatic cancer. (E) Fraction of unmethylated CUX2 fragments in the serum of healthy volunteers and patients in D.
Fig. S7.
Fig. S7.
Methylation of the CpG cluster near the CUX2 gene. (A) Structure of the CUX2 fragment used as marker. Lollipops represent CpGs. The empty lollipop represents the CpG detected in the Illumina 450k array. Arrows mark positions of PCR primers. (B) Methylation status of the individual CpG site at the CUX2 locus that is captured in the Illumina 450k array. Data are from publicly available 450k arrays (see Selection of Methylation Biomarkers). (C) Methylation status of individual CpG sites and the expanded window of multiple CpGs from the CUX2 locus in multiple tissues, as determined by deep sequencing. (D) Methylation of individual CpG sites from the CUX2 locus in the serum of healthy controls and patients with pancreatic cancer. (E) Fraction of unmethylated CUX2 fragments in the serum of healthy volunteers and patients in D.
Fig. S8.
Fig. S8.
Frequency of unmethylated INS promoter molecules in the plasma of healthy individuals, determined by analyzing all possible combinations of CpGs within the amplified segment. The fraction of unmethylated molecules is shown for the INS promoter of 22 nondiabetic plasma samples, with all possible combinations of unmethylated CpGs. Fractions of unmethylated molecules are defined as (molecules with all analyzed CpGs unmethylated)/(all sequenced reads). The mean and SEM are shown for each CpG combination. The samples are colored according to the number of CpGs analyzed: one CpG, green; two CpGs, cyan; three CpGs, orange; four CpGs, purple; five CpGs, red; six CpGs, brown.
Fig. S9.
Fig. S9.
Concentration of cfDNA in healthy individuals and patients. Each dot represents one patient. We measured the concentration after isolation of cfDNA and bisulfite treatment (before use as template for PCR). CP, patients with chronic pancreatitis; MS, patients with multiple sclerosis; Panc, patients with pancreatic cancer; T1D, recently diagnosed type 1 diabetes; TBI, patients with traumatic brain injury; transplants, islet-graft recipients.

References

    1. Schwarzenbach H, Hoon DS, Pantel K. Cell-free nucleic acids as biomarkers in cancer patients. Nat Rev Cancer. 2011;11(6):426–437. - PubMed
    1. Lo YM, et al. Rapid clearance of fetal DNA from maternal plasma. Am J Hum Genet. 1999;64(1):218–224. - PMC - PubMed
    1. Bianchi DW, et al. CARE Study Group DNA sequencing versus standard prenatal aneuploidy screening. N Engl J Med. 2014;370(9):799–808. - PubMed
    1. Lo YM, et al. Presence of fetal DNA in maternal plasma and serum. Lancet. 1997;350(9076):485–487. - PubMed
    1. Fan HC, et al. Non-invasive prenatal measurement of the fetal genome. Nature. 2012;487(7407):320–324. - PMC - PubMed

Publication types

MeSH terms