. 2016 Mar 29;113(13):E1927-35.
doi: 10.1073/pnas.1520971113. Epub 2016 Mar 14.

Phasic, suprathreshold excitation and sustained inhibition underlie neuronal selectivity for short-duration sounds

Affiliations

Phasic, suprathreshold excitation and sustained inhibition underlie neuronal selectivity for short-duration sounds

Rishi K Alluri et al. Proc Natl Acad Sci U S A. .

Abstract

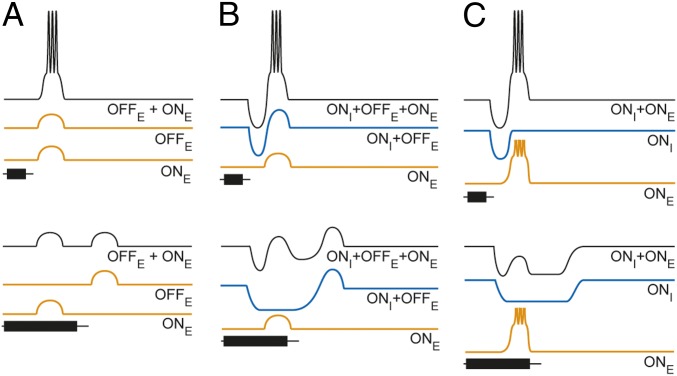
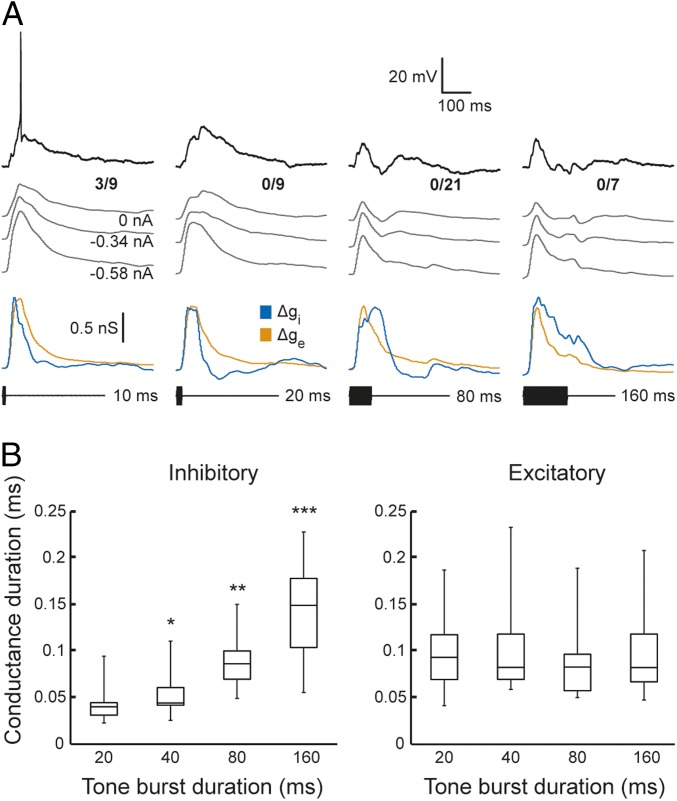
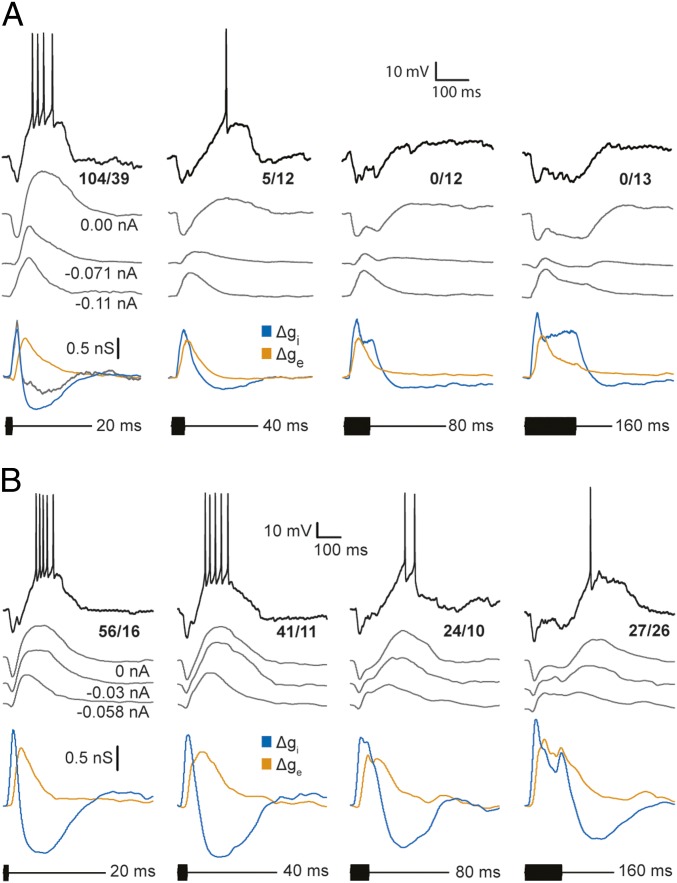
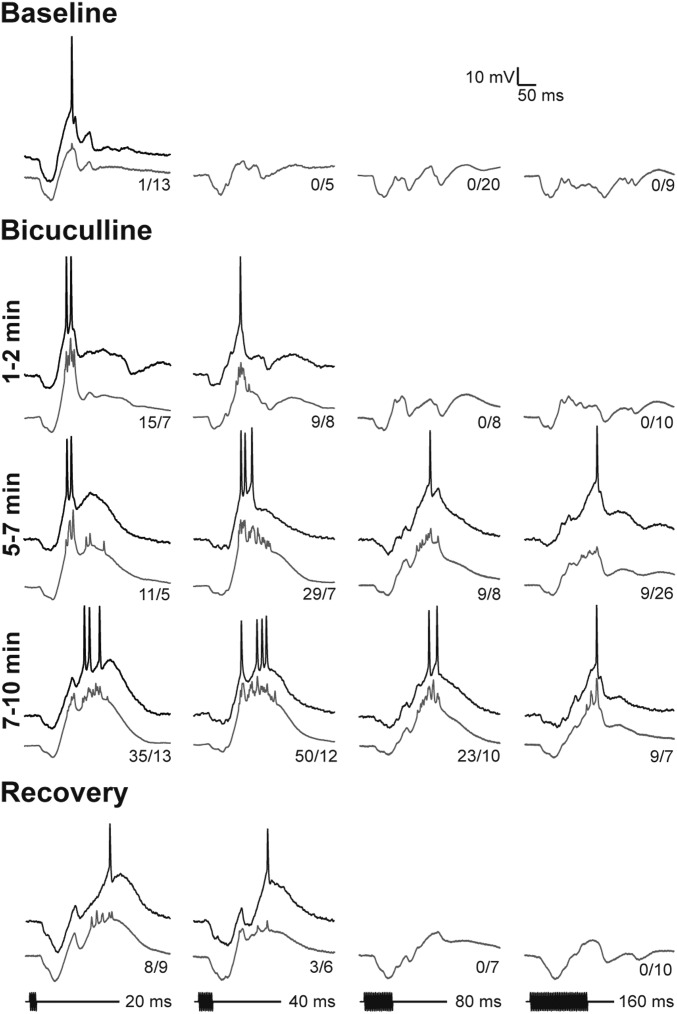
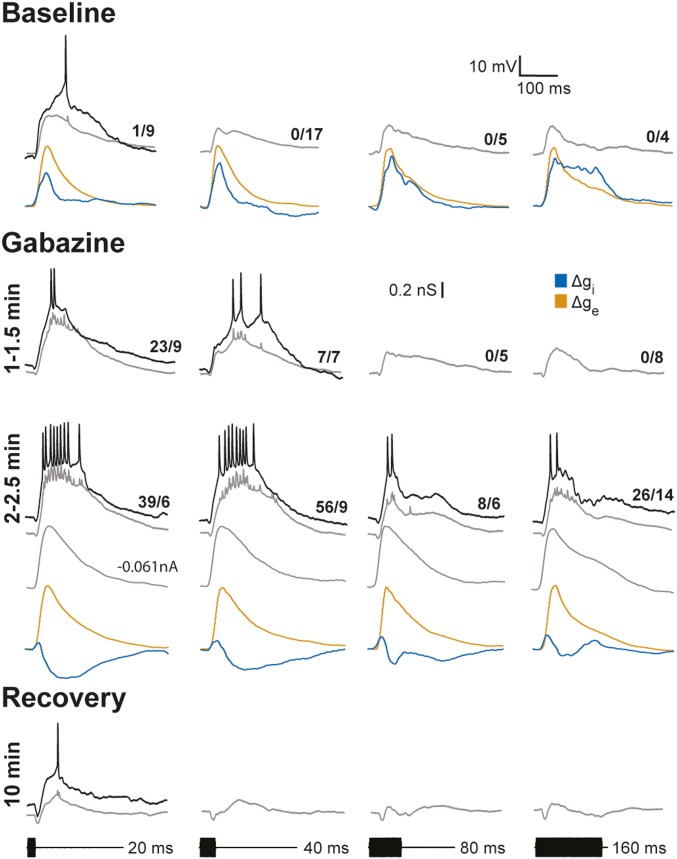
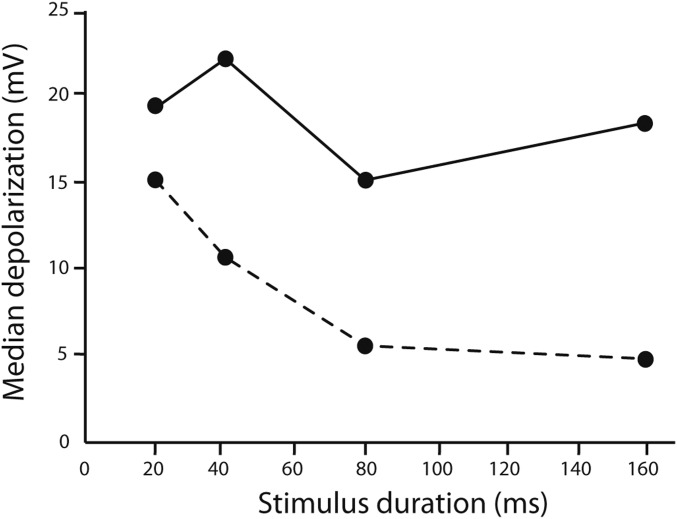
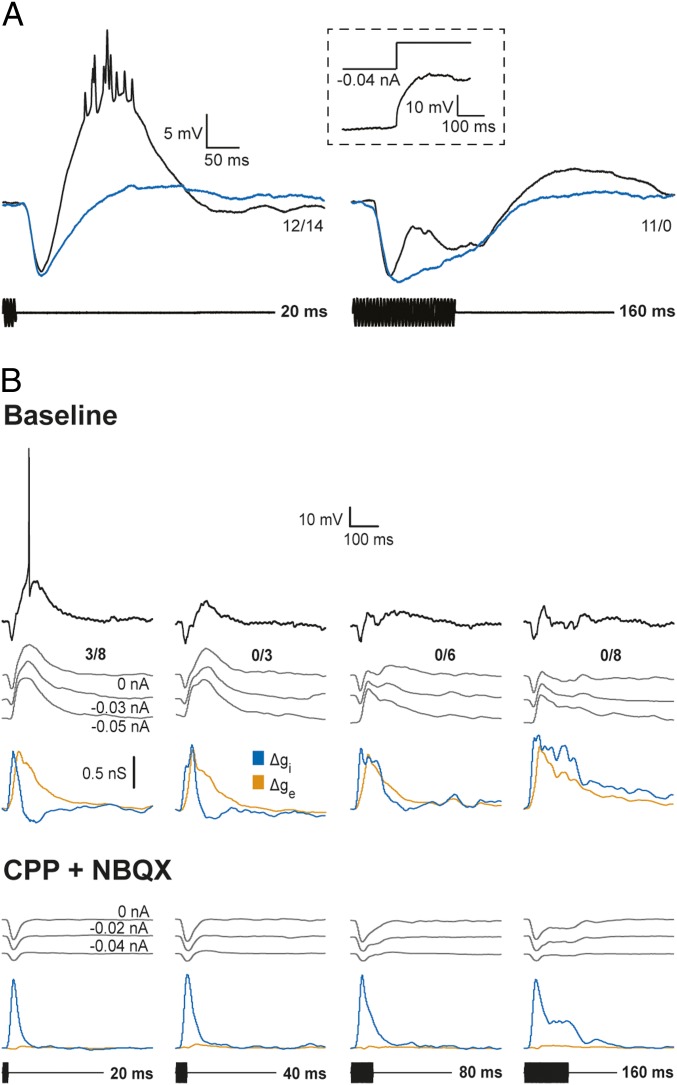
Sound duration is important in acoustic communication, including speech recognition in humans. Although duration-selective auditory neurons have been found, the underlying mechanisms are unclear. To investigate these mechanisms we combined in vivo whole-cell patch recordings from midbrain neurons, extraction of excitatory and inhibitory conductances, and focal pharmacological manipulations. We show that selectivity for short-duration stimuli results from integration of short-latency, sustained inhibition with delayed, phasic excitation; active membrane properties appeared to amplify responses to effective stimuli. Blocking GABAA receptors attenuated stimulus-related inhibition, revealed suprathreshold excitation at all stimulus durations, and decreased short-pass selectivity without changing resting potentials. Blocking AMPA and NMDA receptors to attenuate excitation confirmed that inhibition tracks stimulus duration and revealed no evidence of postinhibitory rebound depolarization inherent to coincidence models of duration selectivity. These results strongly support an anticoincidence mechanism of short-pass selectivity, wherein inhibition and suprathreshold excitation show greatest temporal overlap for long duration stimuli.

Keywords: GABA; gabazine; inferior colliculus; synaptic conductance; whole-cell.


Conflict of interest statement

The authors declare no conflict of interest.

Figures

Fig. 1.
Fig. 1.
Coincidence (A and B) and anticoincidence (C) models for duration selectivity (short-pass instantiation). (B) Adapted with permission from The American Physiological Society (refs. 14, 17); data from refs. , ; and (C) data from ref. . Excitation (orange) is triggered by either stimulus onset (ONE) or stimulus offset (OFFE). Inhibition (blue) is triggered by stimulus onset (ONI), with a shorter latency than that of ONE. In B, the blue trace represents onset inhibition (ONI) followed by postinhibitory rebound depolarization (OFFE).
Fig. 2.
Fig. 2.
Many midbrain neurons show selectivity for short-duration sounds. Normalized response (spikes/stimulus repetition) vs. tone burst duration for seven neurons that represented the observed range of short-pass duration selectivity.
Fig. 3.
Fig. 3.
The time course of inhibition, but not excitation, tracks stimulus duration. (A) Responses and conductance reconstructions for a short-pass duration-selective neuron that spiked only to 10-ms tone bursts. Representative membrane voltage responses for single presentations of tone bursts that had durations of 10, 20, 80, and 160 ms (black). Gray traces show averaged responses (spikes removed using median filter), used for estimating excitatory (orange) and inhibitory (blue) conductance changes; the amount of current injected for each current clamp level is shown at the tail for each averaged trace. The number of spikes elicited over the number of repetitions is shown at the right end of each response (0 nA current clamp). Resting potential = −98.0 mV; stimulus amplitude = 67 dB SPL; carrier frequency = 930 Hz (BEF of the neuron). (B) Duration of inhibitory and excitatory conductance changes versus tone burst duration for the population of short-pass neurons recorded. Conductance duration was measured as the time between points at 50% of maximum response on the initial–rising and final–falling phases of excitatory and inhibitory conductance change traces, such as those shown in A. Whiskers and boxes show the total range of values and interquartile ranges, respectively. Response sample sizes for the various stimulus durations are 20 ms (n = 14), 40 ms (n = 7), 80 ms (n = 10), and 160 ms (n = 12). Levels of significance for comparisons of conductance durations, relative to that for 20 ms, are denoted above boxes: *P < 0.05, **P < 0.01, and ***P < 0.005.
Fig. 4.
Fig. 4.
Sharpness of duration tuning depends on the overlap of excitatory and inhibitory conductance changes in response to long-duration sounds. Whole-cell recordings and profiles of excitatory and inhibitory conductances for strongly selective (A) and weakly selective (B) short-pass neurons. Representative membrane potential responses to a single stimulus presentation (black) and averaged responses (gray traces) are shown; the number of spikes elicited over the number of stimulus repetitions is displayed for averaged responses (0 nA current clamp condition). Gray traces show averaged responses (spikes removed), recorded at the levels of current clamp indicated, used for reconstructing (estimating) the time courses of excitatory (orange) and inhibitory (blue) conductance changes. (A) The time course of inhibitory conductance for 20-ms tone bursts also was estimated using only the recordings at negative current clamp levels (gray trace). Resting potential = −65 mV; stimulus amplitude = 63 dB SPL; carrier frequency = 240 Hz (BEF of the neuron). (B) Resting potential = −74.5 mV; stimulus amplitude = 63 dB SPL; carrier frequency = 730 Hz (BEF of the neuron).
Fig. 5.
Fig. 5.
Attenuating GABAA inhibition with bicuculline unmasks excitation to long-duration sounds and decreases short-pass duration selectivity. The GABAA receptor antagonist bicuculline (BIC) was iontophoresed (+70 nA); recordings were made at several times after starting iontophoresis and then ∼5 min after stopping BIC (recovery). Single (black traces) and averaged (gray traces) responses are shown. The number of spikes elicited over the stimulus repetitions is shown at the tail of each averaged trace. Resting potential = −68 mV; stimulus amplitude = 71 dB SPL; carrier frequency = 200 Hz.
Fig. 6.
Fig. 6.
Gabazine attenuates GABAA inhibition and decreases short-pass duration selectivity without decreasing excitation. Whole-cell recordings and reconstructions of inhibitory and excitatory conductances before and after focal iontophoresis (+70 nA) of gabazine (3 mM), a selective antagonist of GABAA receptors, to attenuate inhibition. Recordings were made at several times after starting iontophoresis and then ∼10 min after stopping iontophoresis (recovery). Single (black traces) and averaged (gray traces) responses recorded at 0.0 nA are shown; responses recorded at −0.061 nA of current clamp are also shown for the 2–2.5 min gabazine condition. The number of spikes elicited over the stimulus repetitions is shown at the tail of each averaged trace. Resting potential = −66 mV; stimulus amplitude = 44 dB SPL; carrier frequency = 650 Hz.
Fig. 7.
Fig. 7.
Blocking inhibition increased stimulus-elicited depolarizations. Median amplitudes of depolarization responses of cells to tone bursts before (dashed line) and during (solid line) iontophoresis of GABAA receptor antagonists. Augmentation of depolarizations was greatest for responses to long-duration tone bursts.
Fig. 8.
Fig. 8.
Postinhibitory rebound was not observed. (A) Whole-cell recordings of responses to tone bursts of 190 Hz (black), the BEF of the neuron or 330 Hz (blue), which primarily elicited inhibition. (Inset) Response to release from −0.04-nA current injection. Resting potential = −82.2 mV; stimulus amplitude = 57 dB SPL. (B) Responses of a short-pass neuron before and after ∼8 min iontophoresis of NBQX (5 mM, +70 nA) and CPP (10 mM, +50 nA) to block AMPA- and NMDA-type glutamate receptors, respectively. Voltage recordings of responses to tone bursts (carrier frequency = 470 Hz) of various durations were made at the current clamp levels shown; estimates of changes in excitatory (orange) and inhibitory (blue) conductances are based on, and shown below, each set of these recordings. The number of spikes elicited over the number of repetitions is shown at the right end of each response (0-nA current clamp). Resting potential = −70.5 mV and −74 mV before and after blocking excitation, respectively; stimulus amplitude = 62 dB SPL.

References

    1. Aubie B, Sayegh R, Faure PA. Duration tuning across vertebrates. J Neurosci. 2012;32(18):6373–6390. - PMC - PubMed
    1. Sayegh R, Aubie B, Faure PA. Duration tuning in the auditory midbrain of echolocating and non-echolocating vertebrates. J Comp Physiol A Neuroethol Sens Neural Behav Physiol. 2011;197(5):571–583. - PubMed
    1. Leary CJ, Edwards CJ, Rose GJ. Midbrain auditory neurons integrate excitation and inhibition to generate duration selectivity: An in vivo whole-cell patch study in anurans. J Neurosci. 2008;28(21):5481–5493. - PMC - PubMed
    1. Narins PM, Capranica RR. Neural adaptations for processing the two-note call of the Puerto Rican treefrog, Eleutherodactylus coqui. Brain Behav Evol. 1980;17(1):48–66. - PubMed
    1. Potter HD. Mesencephalic auditory region of the bullfrog. J Neurophysiol. 1965;28(6):1132–1154. - PubMed

Publication types

MeSH terms

LinkOut - more resources