. 2016 Mar 15:6:23113.
doi: 10.1038/srep23113.

The importance of interacting climate modes on Australia's contribution to global carbon cycle extremes

Affiliations

The importance of interacting climate modes on Australia's contribution to global carbon cycle extremes

James Cleverly et al. Sci Rep. .

Abstract

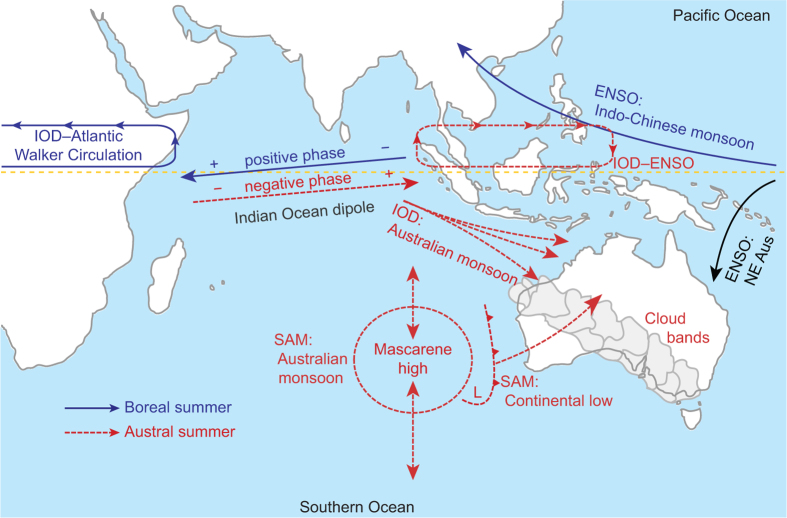
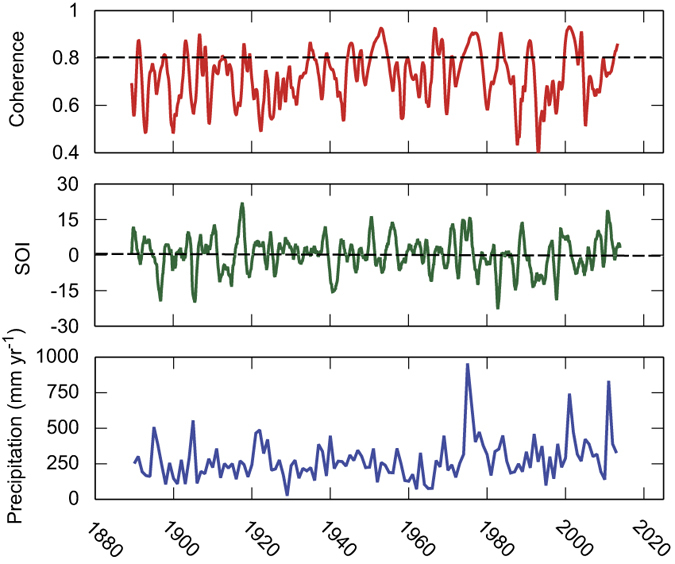
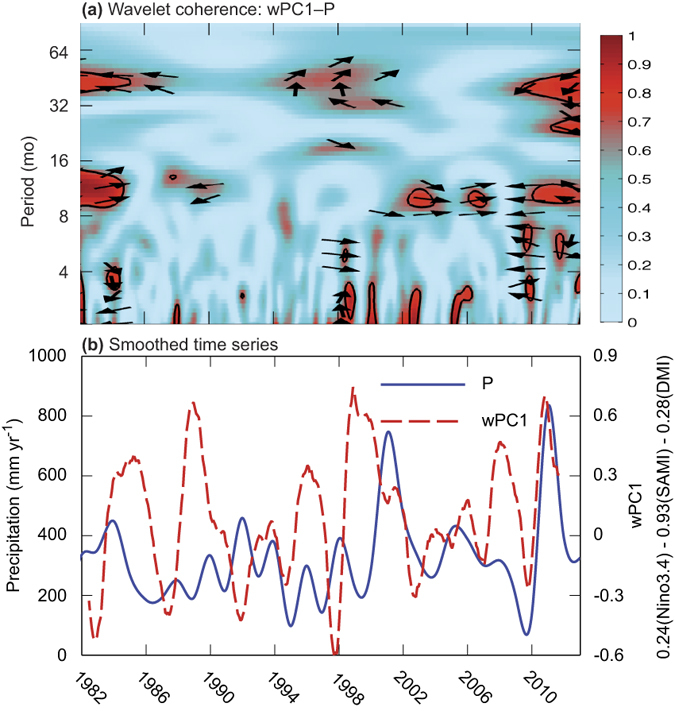
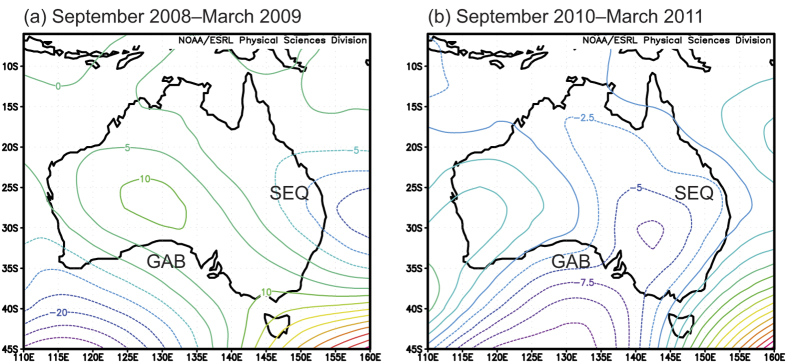
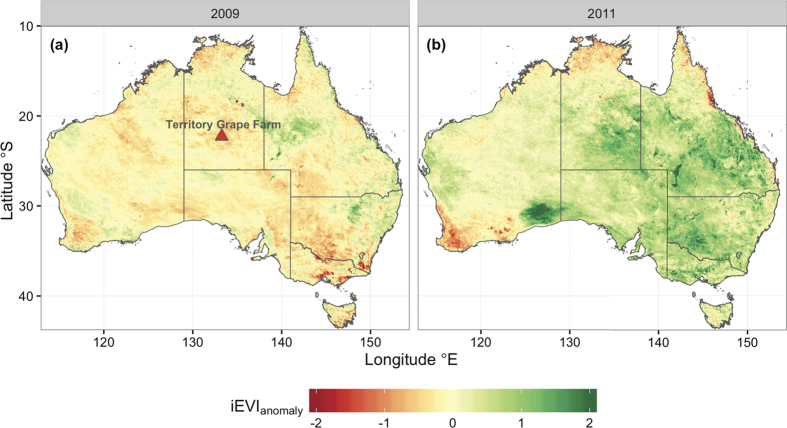
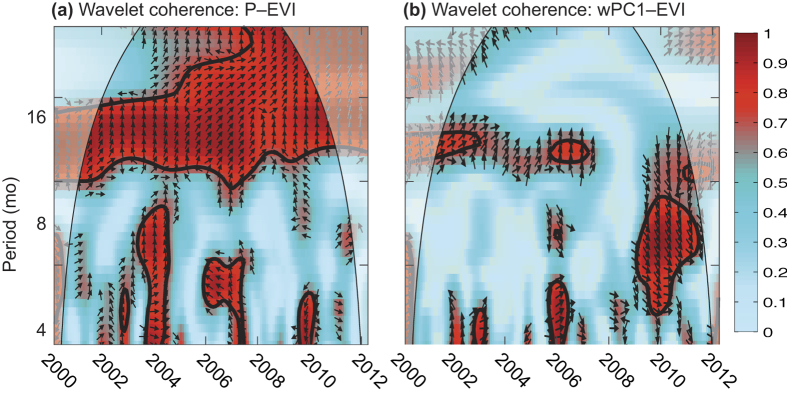
The global carbon cycle is highly sensitive to climate-driven fluctuations of precipitation, especially in the Southern Hemisphere. This was clearly manifested by a 20% increase of the global terrestrial C sink in 2011 during the strongest sustained La Niña since 1917. However, inconsistencies exist between El Niño/La Niña (ENSO) cycles and precipitation in the historical record; for example, significant ENSO-precipitation correlations were present in only 31% of the last 100 years, and often absent in wet years. To resolve these inconsistencies, we used an advanced temporal scaling method for identifying interactions amongst three key climate modes (El Niño, the Indian Ocean dipole, and the southern annular mode). When these climate modes synchronised (1999-2012), drought and extreme precipitation were observed across Australia. The interaction amongst these climate modes, more than the effect of any single mode, was associated with large fluctuations in precipitation and productivity. The long-term exposure of vegetation to this arid environment has favoured a resilient flora capable of large fluctuations in photosynthetic productivity and explains why Australia was a major contributor not only to the 2011 global C sink anomaly but also to global reductions in photosynthetic C uptake during the previous decade of drought.


Figures

Figure 1
Figure 1. Coupled ocean–climate system in the Indian Ocean region during boreal (solid blue lines) and austral (dashed red lines) summer.
Connections between climate modes and weather are indicated with a colon (e.g., ENSO: Indo-Chinese monsoon), and connections amongst climate modes are indicated with a dash (e.g., IOD–ENSO Walker circulation). Arrows near the equator in the Indian Ocean represent development of the convection centre in response to build-up (eastward) and breakdown (westward) of the IOD. See text for further details on the illustrated climate linkages. Map was drawn using Adobe Illustrator CS3 (version 13.0.2, http://www.adobe.com).
Figure 2
Figure 2. Temporal development of the coherence (squared correlation) between the southern oscillation index (SOI, 12-month moving average) and local precipitation in tropical central Australia (Territory Grape Farm, TGF;Fig. 5).
Coherence values above the dashed horizontal line are significantly different from zero (p < 0.05).
Figure 3
Figure 3. Relationship between local precipitation P (TGF,Fig. 5) and state of the coupled climate system (wPC1).
(a) Normalised wavelet coherence between P and wPC1. Frequency-time coordinates of significant coherence are outlined. Arrows indicate phase (leftward: 180° out-of-phase; rightward: 0° in-phase) and degree of lead or lag (upward or downward) between wPC1 and P. The cone of influence was outside the domain of the plot. (b) Monthly P (solid blue line) and wPC1 (dashed red line), smoothed with a 12-month running average and scaled to annual values.
Figure 4
Figure 4
Seasonal weather patterns during (a) a very dry period (September 2008–March 2009) and (b) the land sink anomaly in Australia (September 2010–March 2011). Contours represent monthly average 500 hPa geopotential height above (solid lines) and below (dashed lines) the zonal average, in which negative values are indicative of low pressure and enhanced vorticity. The locations of southeast Queensland (SEQ) and the Great Australian Bight (GAB) are shown for reference. Maps were obtained from the NCEP/NCAR reanalysis project (monthly mean geopotential heights, http://www.esrl.noaa.gov/psd/cgi-bin/db_search/SearchMenus.pl).
Figure 5
Figure 5
Biogeographic patterns in photosynthetic productivity over Australia during (a) a dry year (2008–2009) and (b) a wet year (2010–2011). Anomalies of annually integrated enhanced vegetation index (iEVIanomaly) were used as a surrogate for productivity. Large, positive values of iEVIanomaly represent areas with a large C sink. The location of the Territory Grape Farm meteorological station (for precipitation in Figs 2 and 3) is indicated. Map was drawn using R version 3.1.2 (http://www.R-project.org/).
Figure 6
Figure 6
Normalised wavelet coherence between EVI and (a) P or (b) wPC1. The cone of influence is shown by the curved lines and shaded values. Tick marks on the x-axis are marked on the first day of the specified year.

References

    1. Boening C., Willis J. K., Landerer F. W., Nerem R. S. & Fasullo J. The 2011 La Niña: So strong, the oceans fell. Geophys. Res. Lett. 39, 10.1029/2012gl053055 (2012). - DOI
    1. Fasullo J. T., Boening C., Landerer F. W. & Nerem R. S. Australia’s unique influence on global sea level in 2010–2011. Geophys. Res. Lett. 40, 4368–4373, 10.1002/grl.50834 (2013). - DOI
    1. Poulter B. et al. Contribution of semi-arid ecosystems to interannual variability of the global carbon cycle. Nature 509, 600–603, 10.1038/nature13376 (2014). - DOI - PubMed
    1. Bastos A., Running S. W., Gouveia C. & Trigo R. M. The global NPP dependence on ENSO: La Nina and the extraordinary year of 2011. J. Geophys. Res.-Biogeosci. 118, 1247–1255, 10.1002/jgrg.20100 (2013). - DOI
    1. Gatti L. V. et al. Drought sensitivity of Amazonian carbon balance revealed by atmospheric measurements. Nature 506, 76-+, 10.1038/nature12957 (2014). - DOI - PubMed

LinkOut - more resources