. 2016:2016:5415901.
doi: 10.1155/2016/5415901. Epub 2016 Feb 10.

Temporal Analyses of the Response of Intervertebral Disc Cells and Mesenchymal Stem Cells to Nutrient Deprivation

Affiliations

Temporal Analyses of the Response of Intervertebral Disc Cells and Mesenchymal Stem Cells to Nutrient Deprivation

Sarah A Turner et al. Stem Cells Int. 2016.

Abstract

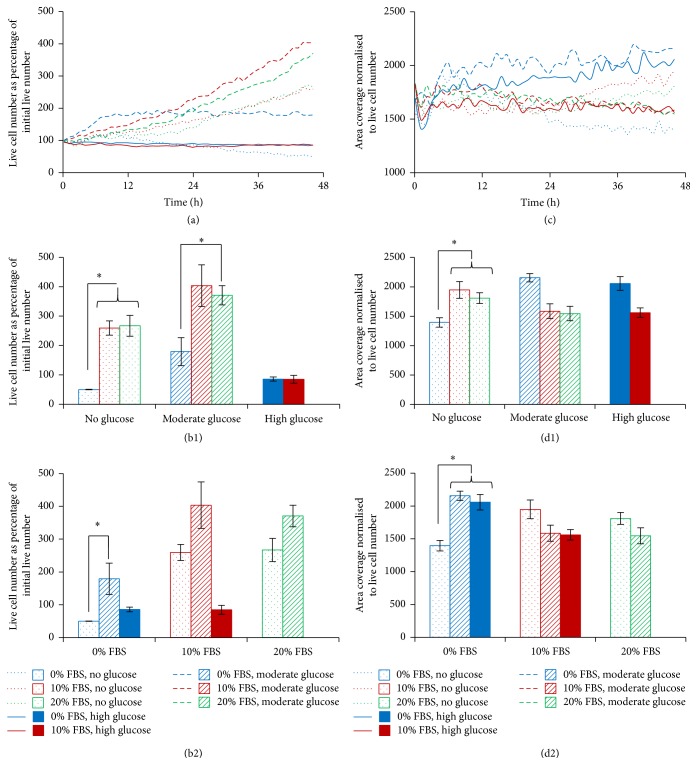
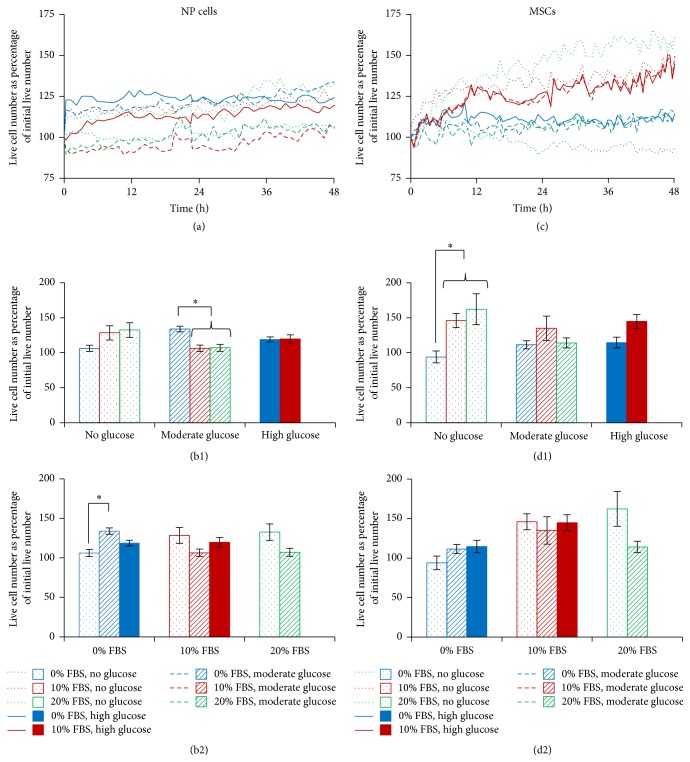
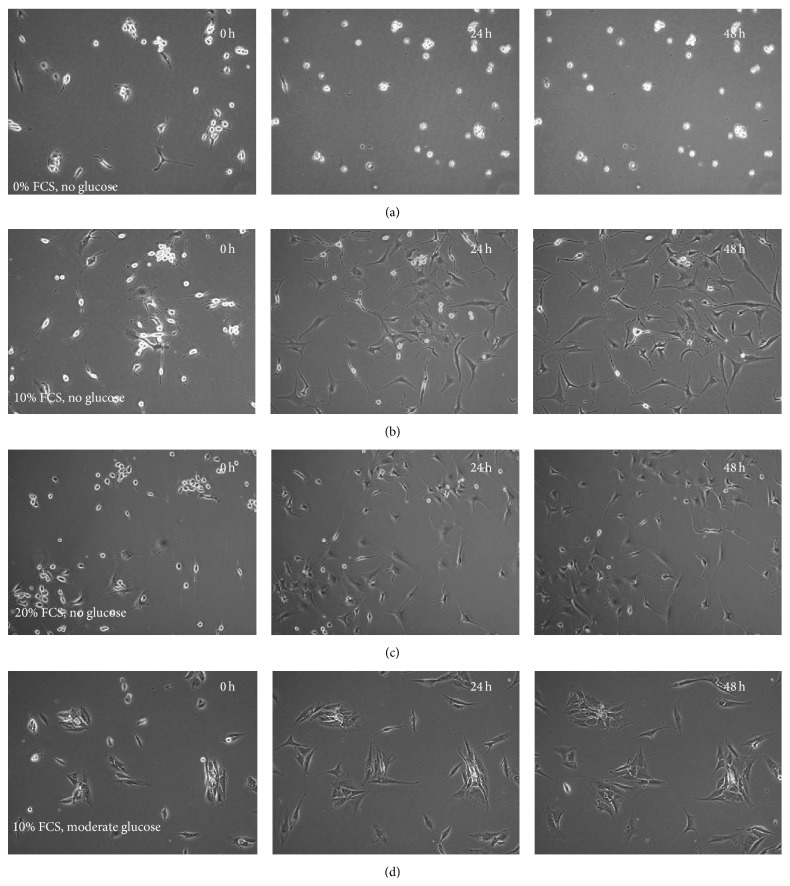
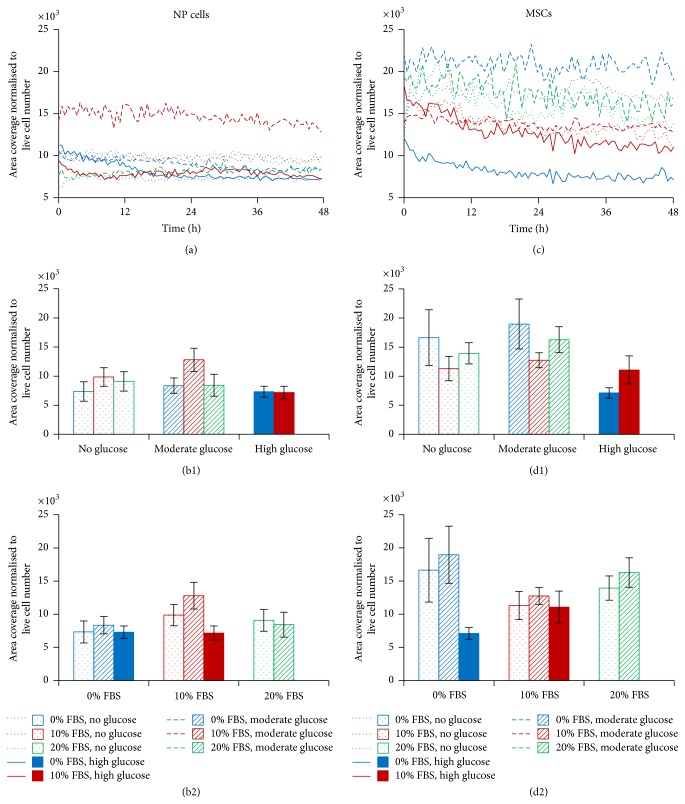
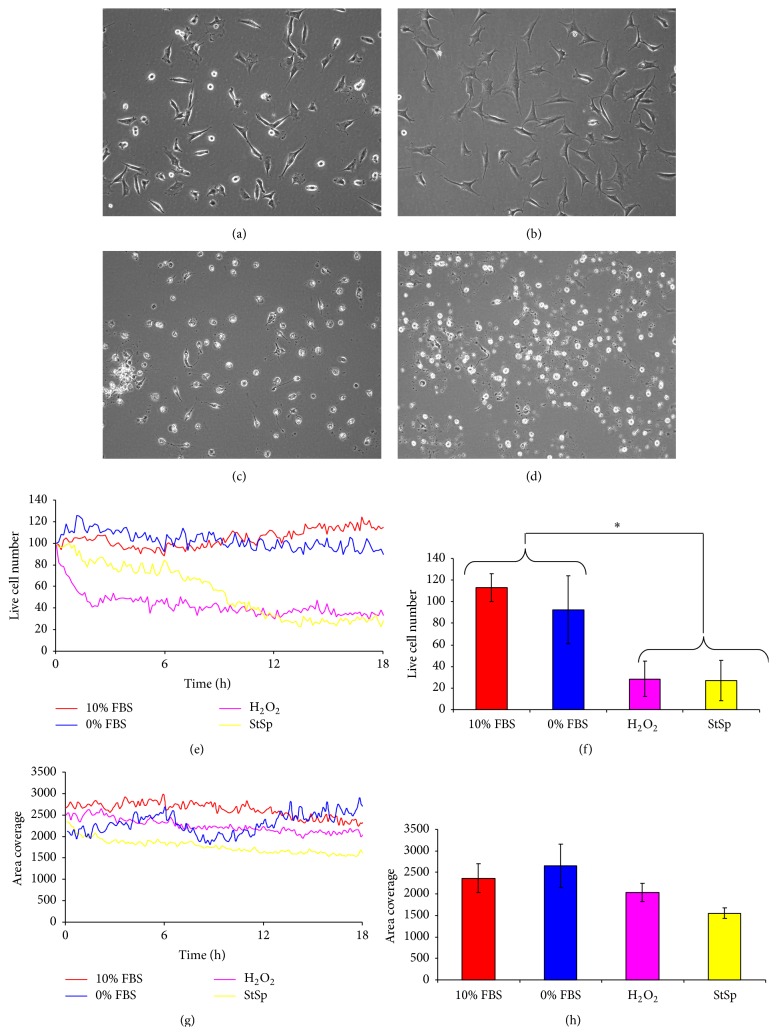
Much emphasis has been placed recently on the repair of degenerate discs using implanted cells, such as disc cells or bone marrow derived mesenchymal stem cells (MSCs). This study examines the temporal response of bovine and human nucleus pulposus (NP) cells and MSCs cultured in monolayer following exposure to altered levels of glucose (0, 3.15, and 4.5 g/L) and foetal bovine serum (0, 10, and 20%) using an automated time-lapse imaging system. NP cells were also exposed to the cell death inducers, hydrogen peroxide and staurosporine, in comparison to serum starvation. We have demonstrated that human NP cells show an initial "shock" response to reduced nutrition (glucose). However, as time progresses, NP cells supplemented with serum recover with minimal evidence of cell death. Human NP cells show no evidence of proliferation in response to nutrient supplementation, whereas MSCs showed greater response to increased nutrition. When specifically inducing NP cell death with hydrogen peroxide and staurosporine, as expected, the cell number declined. These results support the concept that implanted NP cells or MSCs may be capable of survival in the nutrient-poor environment of the degenerate human disc, which has important clinical implications for the development of IVD cell therapies.


Figures

Figure 1
Figure 1
Sample library generated using the Cell-IQ® Analyser software. (a) Samples within the library are divided into three categories: live, phase-bright, and debris. Examples are added to the library to teach the software into which category a cell should fall. (b) Transition of human nucleus pulposus cells from a phase-bright category to a live, fibroblast category, over 48 hours.
Figure 2
Figure 2
Monitoring the response of bovine NP cell cultures to changes in FBS and glucose concentration over 48 hours. (a) Temporal analysis for live cell number, expressed as the percentage of the initial live cell number. (b) Live cell number, expressed as a percentage of the initial live cell number at the final time point (±SEM), comparing FBS levels within glucose subgroup (b1) and comparing glucose levels within FBS subgroup (b2). (c) Temporal analysis for area coverage normalised to live cell number. (d) Cell area, normalised to live cell number, at the final time point (±SEM), comparing FBS levels within glucose subgroup (d1) and comparing glucose levels within FBS subgroup (d2). represents a statistically significant difference of p < 0.05.
Figure 3
Figure 3
Temporal analysis of number of human NP cells and MSCs in response to altered FBS and glucose concentration, over 48 hours. Trends over 48 hours for human NP cells (a) and human MSCs (c) and at the end time point (±SEM) for human NP cells (b) and human MSCs (d), comparing FBS levels within glucose subgroups ((b1) and (d1)) and comparing glucose levels within FBS subgroups ((b2) and (d2)).
Figure 4
Figure 4
Changes in human NP cellular morphology with time. (a) Cells treated with 0% FBS and no glucose appeared “phase-bright” and semiadhered. This morphology showed no change over time, whereas cells treated with 10% FBS and no glucose (b) and 20% FBS with no glucose (c) showed recovery from a rounded phase-bright morphology to flattened live fibroblast morphology during the 48 hours; (d) cells treated with 10% FBS and moderate glucose were flattened and fibroblast-like and showed no discernible changes in morphology over time.
Figure 5
Figure 5
Temporal analysis of human NP cell and MSC area coverage in response to FBS and glucose concentration over 48 hours. Trends over 48 hours for human NP cells (a) and human MSCs (c). Mean area coverage, normalised to live cell number at the final time point (±SEM) for (b) human NP cells and (d) human MSCs, comparing FBS levels within glucose subgroups ((b1) and (d1)) and comparing glucose levels within FBS subgroups ((b2) and (d2)).
Figure 6
Figure 6
The response of bovine NP cells to induction of cell death inducers over 18 hours. Representative phase contrast images following 18-hour exposure to 10% (a) or 0% (b) FBS with moderate glucose, (c) hydrogen peroxide, and (d) staurosporine. (e) Temporal analysis for live cell number, expressed as percentage of the initial live cell number. (f) Live cell number, expressed as a percentage of the initial live cell number at the final time point (±SEM). (g) Temporal analysis for area coverage normalised to live cell number. (h) Area coverage, normalised to live cell number, at the final time point (±SEM).

References

    1. Adams M. A., Roughley P. J. What is intervertebral disc degeneration, and what causes it? Spine. 2006;31(18):2151–2161. doi: 10.1097/01.brs.0000231761.73859.2c. - DOI - PubMed
    1. Rodriguez A. G., Slichter C. K., Acosta F. L., et al. Human disc nucleus properties and vertebral endplate permeability. Spine. 2011;36(7):512–520. doi: 10.1097/BRS.0b013e3181f72b94. - DOI - PMC - PubMed
    1. Neidlinger-Wilke C., Liedert A., Wuertz K., et al. Mechanical stimulation alters pleiotrophin and aggrecan expression by human intervertebral disc cells and influences their capacity to stimulate endothelial migration. Spine. 2009;34(7):663–669. doi: 10.1097/brs.0b013e318194e20c. - DOI - PubMed
    1. Ohshima H., Urban J. P. G., Bergel D. H. Effect of static load on matrix synthesis rates in the intervertebral disc measured in vitro by a new perfusion technique. Journal of Orthopaedic Research. 1995;13(1):22–29. doi: 10.1002/jor.1100130106. - DOI - PubMed
    1. Bibby S. R. S., Urban J. P. G. Effect of nutrient deprivation on the viability of intervertebral disc cells. European Spine Journal. 2004;13(8):695–701. doi: 10.1007/s00586-003-0616-x. - DOI - PMC - PubMed

LinkOut - more resources