. 2015 Dec 25;5(3):184-197.
doi: 10.1016/j.molmet.2015.12.002. eCollection 2016 Mar.

High-fat diet reprograms the epigenome of rat spermatozoa and transgenerationally affects metabolism of the offspring

Affiliations

High-fat diet reprograms the epigenome of rat spermatozoa and transgenerationally affects metabolism of the offspring

Thais de Castro Barbosa et al. Mol Metab. .

Abstract

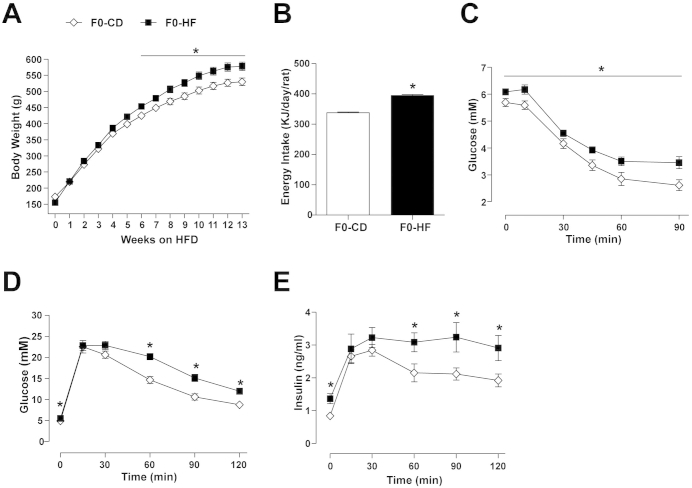
Objectives: Chronic and high consumption of fat constitutes an environmental stress that leads to metabolic diseases. We hypothesized that high-fat diet (HFD) transgenerationally remodels the epigenome of spermatozoa and metabolism of the offspring.

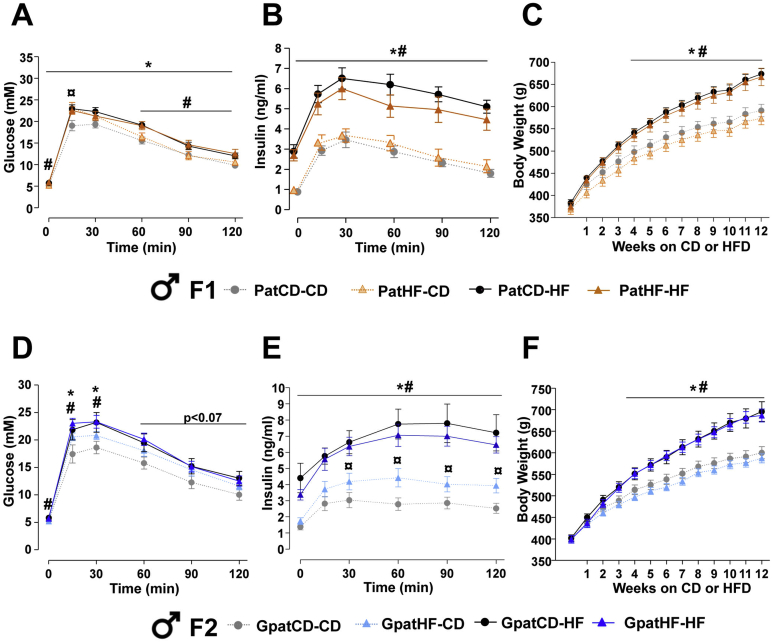
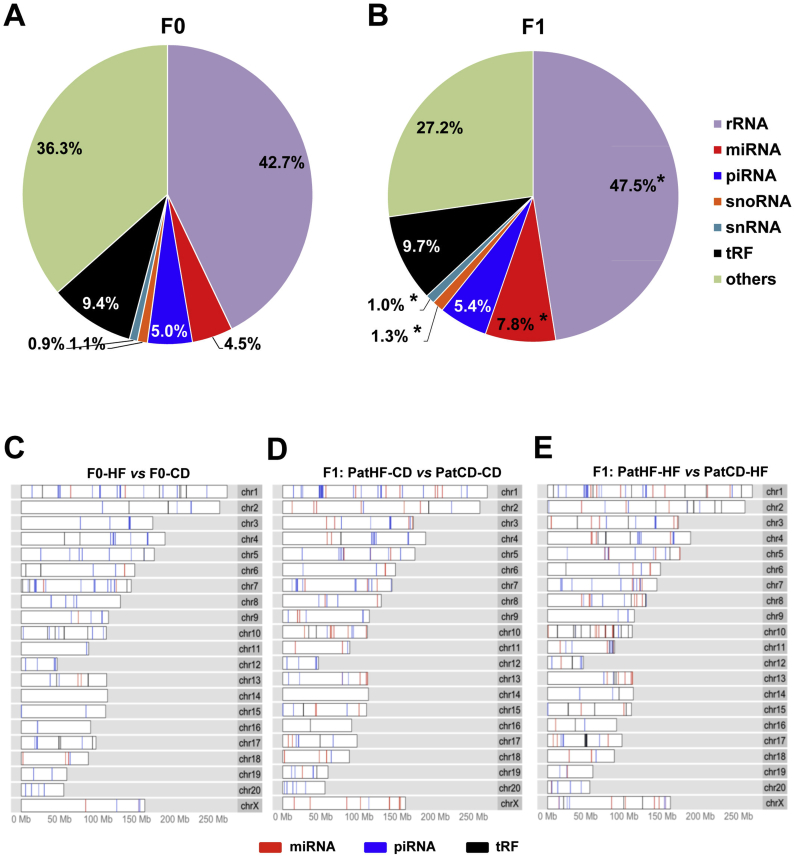
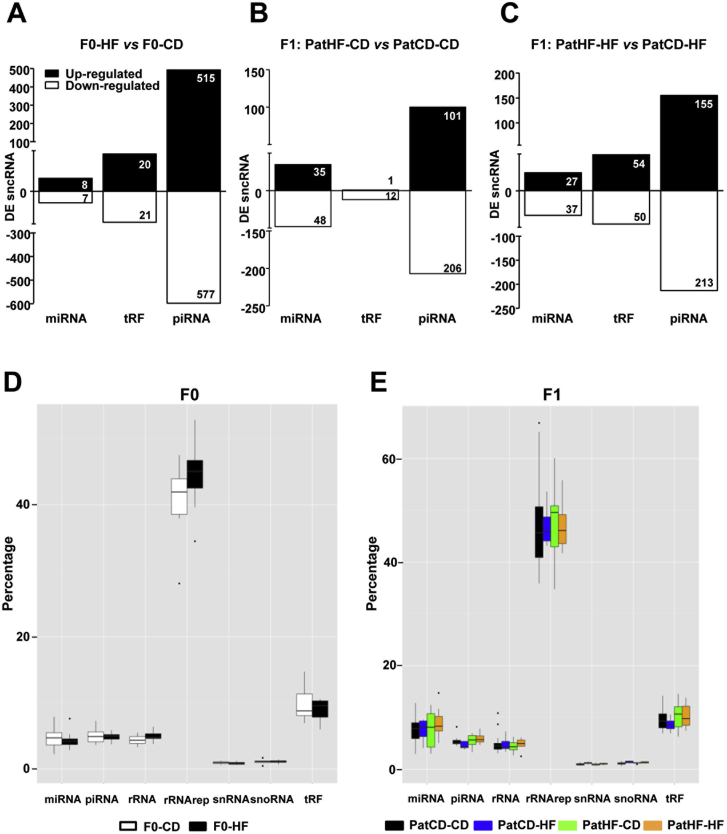
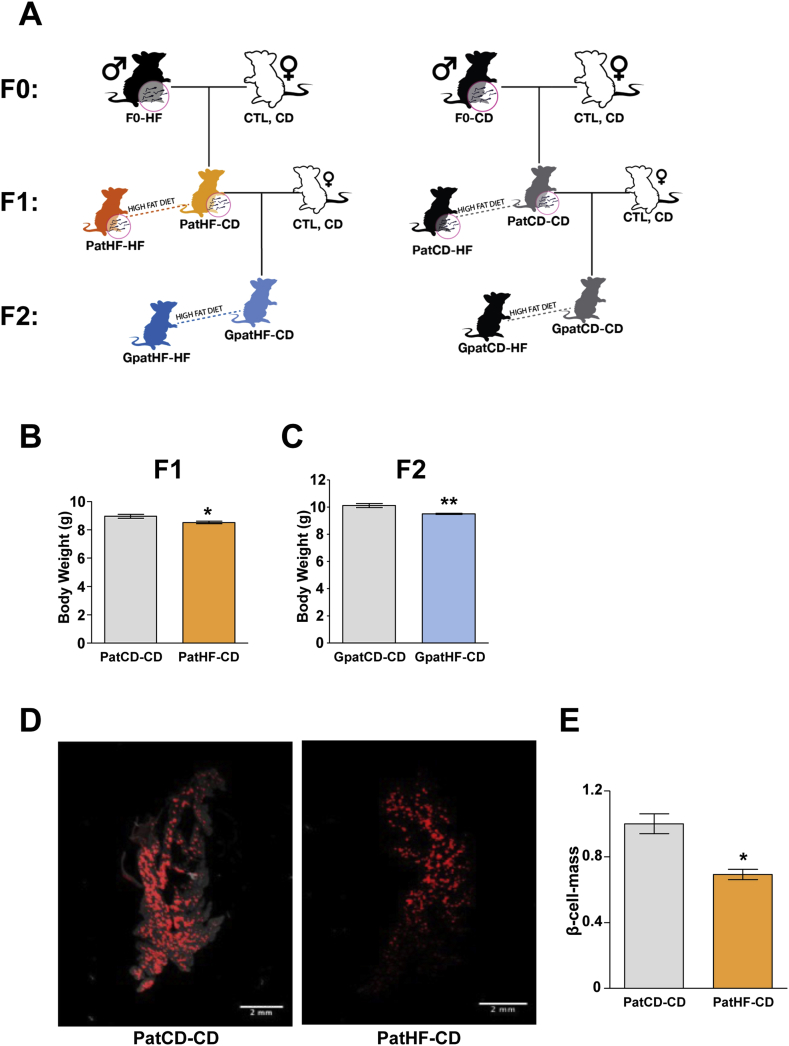
Methods: F0-male rats fed either HFD or chow diet for 12 weeks were mated with chow-fed dams to generate F1 and F2 offspring. Motile spermatozoa were isolated from F0 and F1 breeders to determine DNA methylation and small non-coding RNA (sncRNA) expression pattern by deep sequencing.

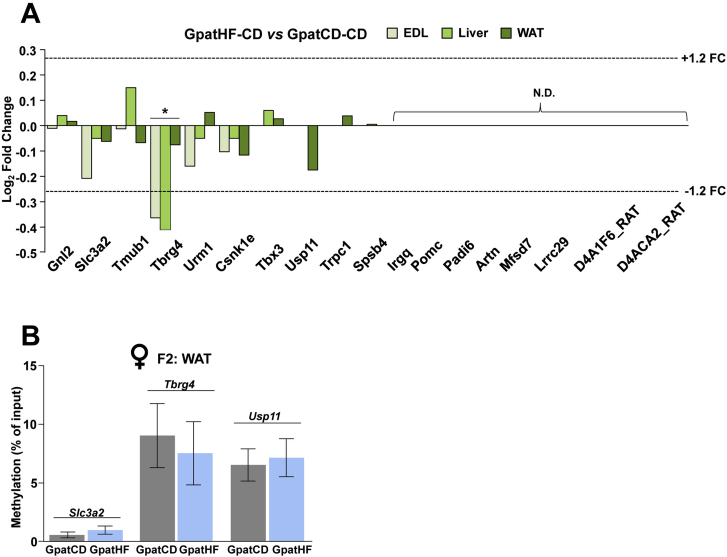
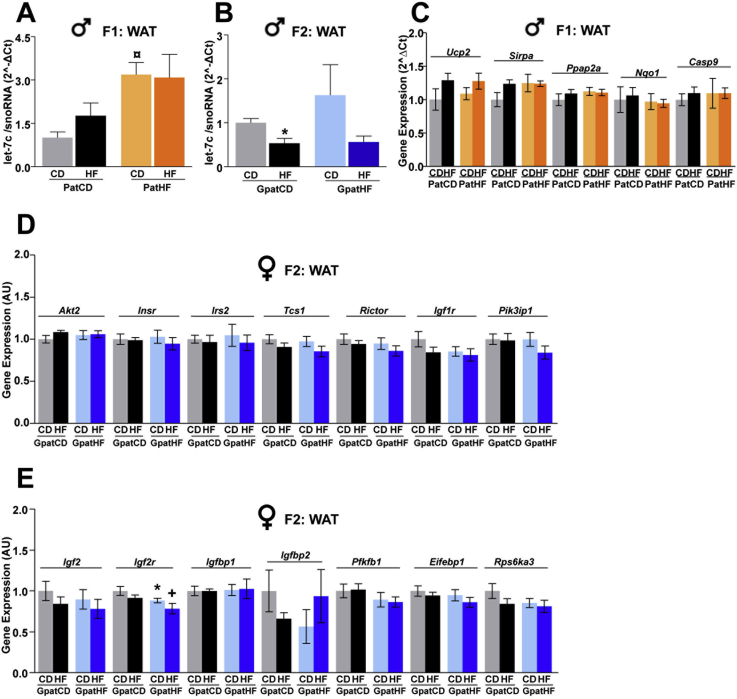
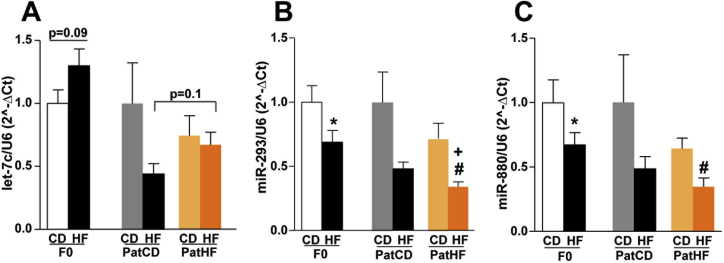
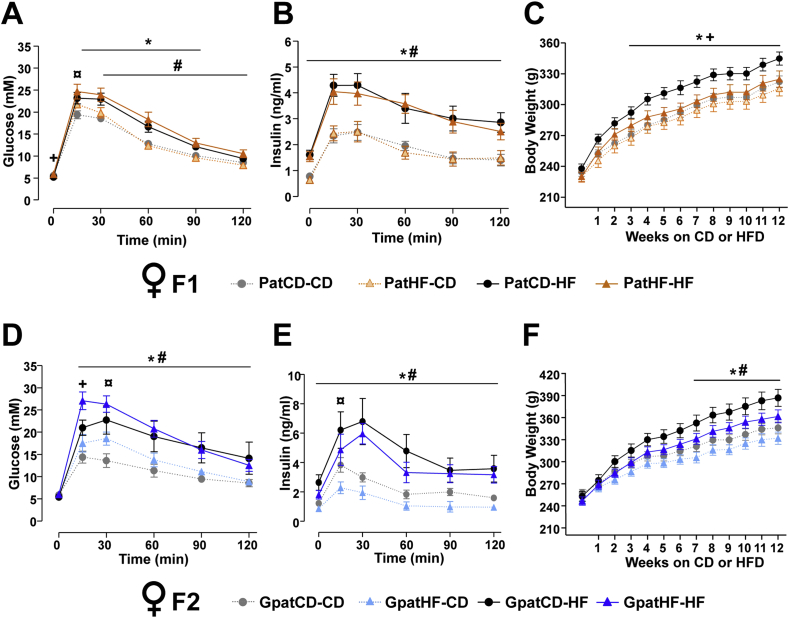
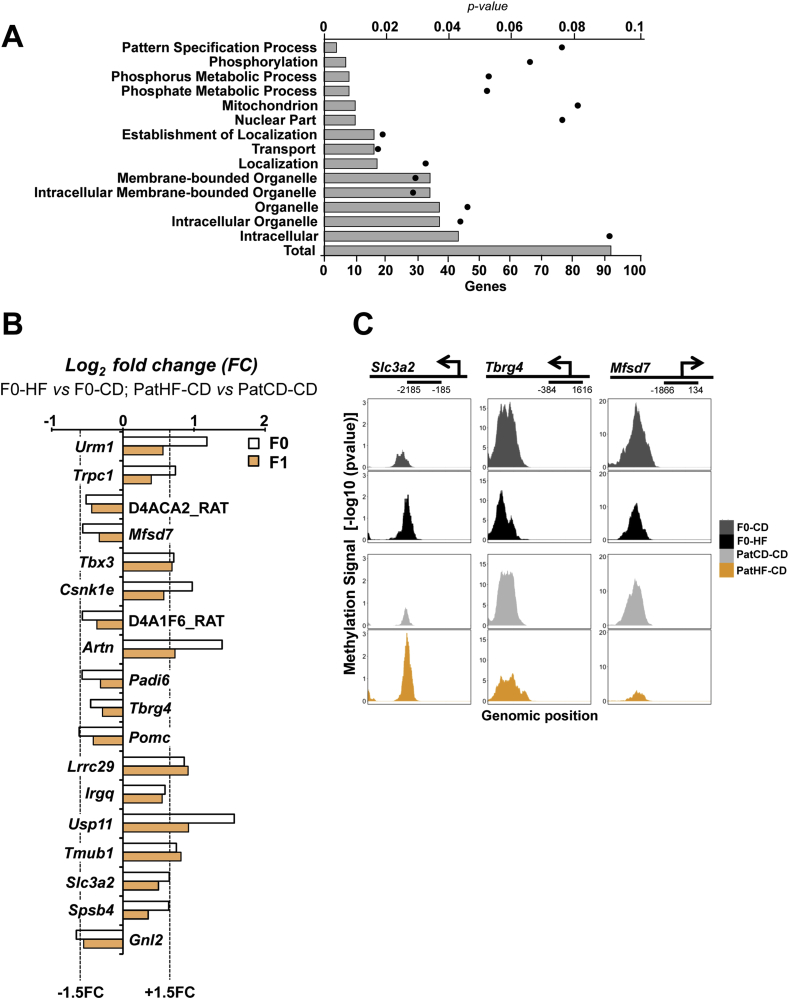
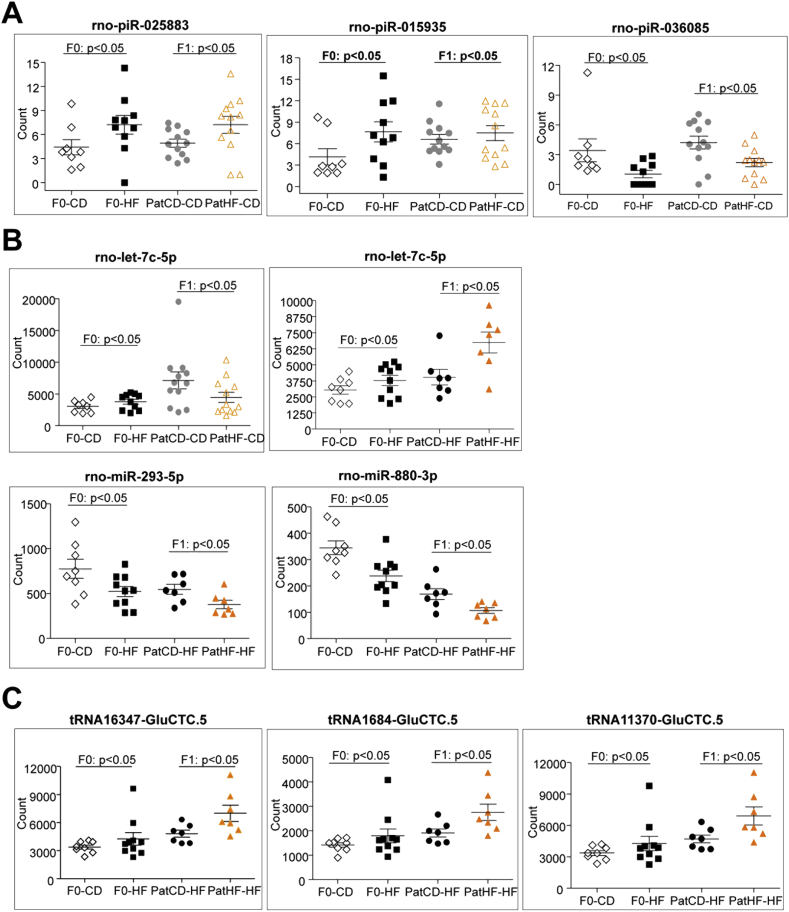
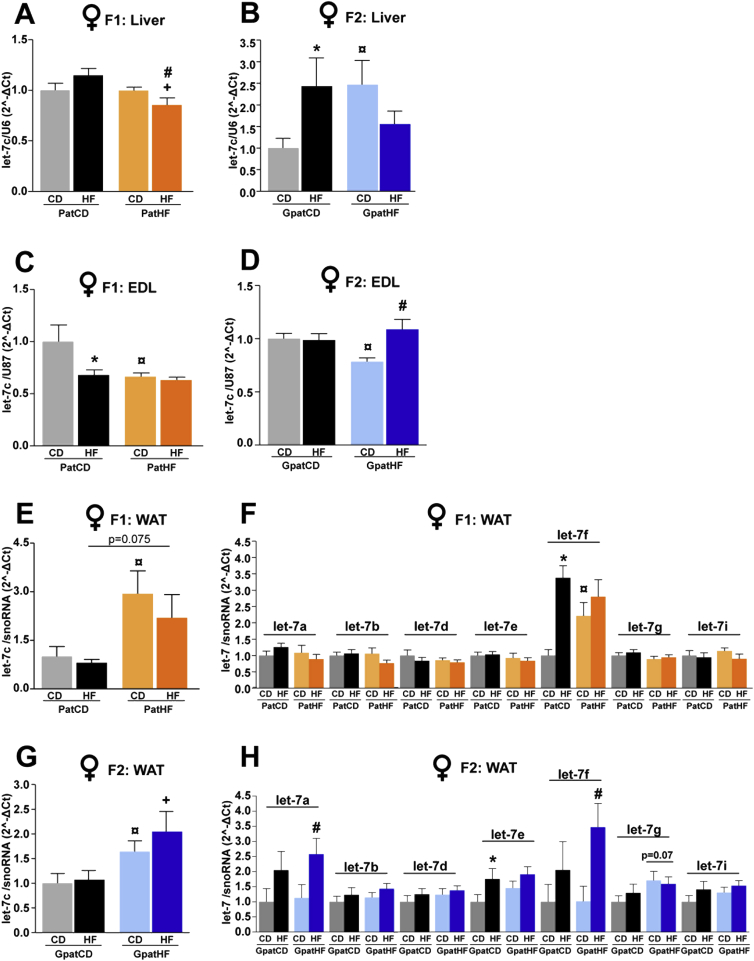
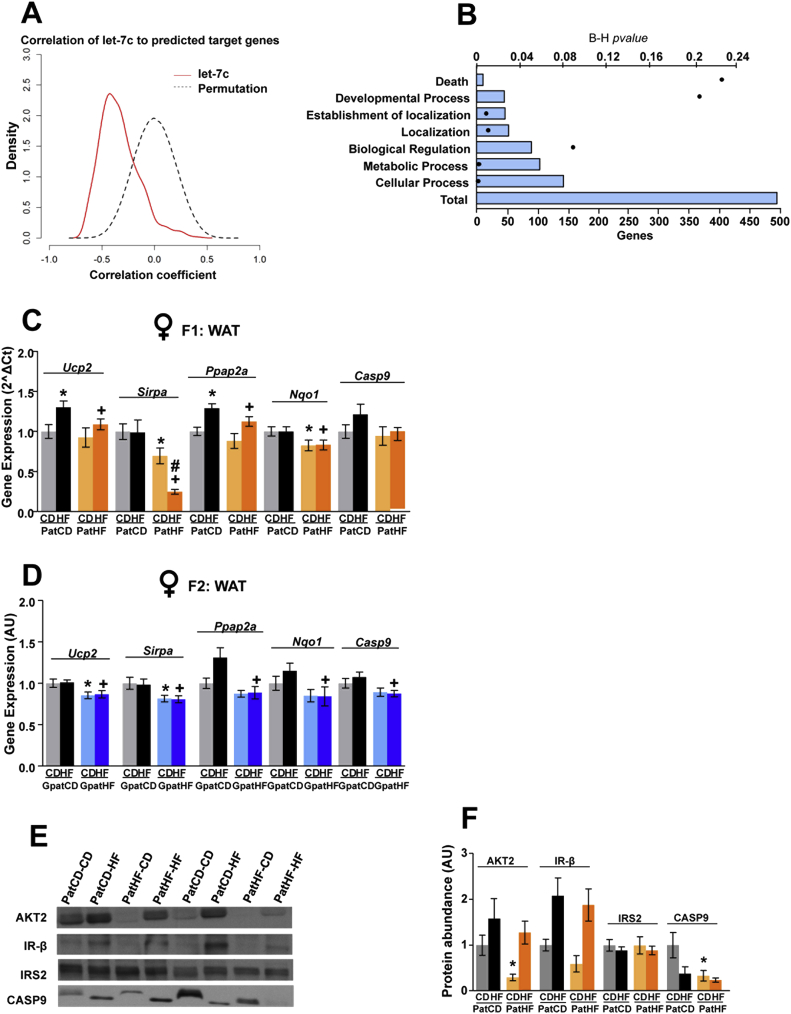
Results: Newborn offspring of HFD-fed fathers had reduced body weight and pancreatic beta-cell mass. Adult female, but not male, offspring of HFD-fed fathers were glucose intolerant and resistant to HFD-induced weight gain. This phenotype was perpetuated in the F2 progeny, indicating transgenerational epigenetic inheritance. The epigenome of spermatozoa from HFD-fed F0 and their F1 male offspring showed common DNA methylation and small non-coding RNA expression signatures. Altered expression of sperm miRNA let-7c was passed down to metabolic tissues of the offspring, inducing a transcriptomic shift of the let-7c predicted targets.

Conclusion: Our results provide insight into mechanisms by which HFD transgenerationally reprograms the epigenome of sperm cells, thereby affecting metabolic tissues of offspring throughout two generations.

Keywords: DNA methylation; Epigenetics; Obesity; Spermatozoa; microRNA.


Figures

Supplementary Figure S1
Metabolic phenotype of F0-male rats after 12 weeks on HFD. (A) Body weight curve (n = 19 (CD) and 20 (HFD)). (B) Energy Intake (n = 20/19). (C) Blood glucose levels during an intraperitoneal insulin tolerance test (ipITT) (n = 9/10). Blood (D) glucose and (E) insulin during the glucose tolerance test (ipGTT), n = 8). Results are represented as mean ± SEM. Student's t-test: *p ≤ 0.05, F0-HF vs F0-CD. N-numbers are indicated for CD and HF, respectively.
Supplementary Figure S2
Glucose tolerance is impaired, while HFD-induced weight gain is not, in male F1 and F2 offspring. (AC) Metabolic phenotyping of F1 male offspring after 12 weeks of high fat feeding; blood (A) glucose and (B) insulin during an intraperitoneal glucose tolerance test (ipGTT) (n = 11–14 animals and litters) and (C) body weight curve (n = 18–22 animals from 15 to 16 litters; used more than 1 sibling per litter). (DF) Metabolic phenotyping of F2 male offspring after 12 weeks of high fat diet feeding. Blood (D) glucose and (E) insulin during an ipGTT (n = 10–11 litters; 1 sibling per litter) and (F) body weight curve (n = 18–24 animals from 10 to 13 litters; used more than 1 sibling per litter). Results are represented as mean ± SEM. Two-way ANOVA followed by Bonferroni post-hoc test: *p ≤ 0.05: PatCD-HF vs PatCD-CD or GpatCD-HF vs GpatCD-CD; ¤p ≤ 0.05: PatHF-CD vs PatCD-CD or GpatHF-CD vs GpatCD-CD; #p ≤ 0.05: PatHF-HF vs PatHF-CD or GpatHF-HF vs GpatHF-CD; +p ≤ 0.05: PatHF-HF vs PatCD-HF or GpatHF-HF vs GpatCD-HF; p < 0.07: GpatHF-HF vs GpatHF-CD or GpatCD-HF vs GpatCD-CD. PatCD-CD: Paternal-Chow on Chow; PatHF-CD: Paternal-HFD on Chow; PatCD-HF: Paternal-Chow on HFD; PatHF-HF: Paternal-HFD on HFD; GpatCD-CD: Grandpaternal-Chow on Chow; GpatHF-CD: Grandpaternal-HFD on Chow; GpatCD-HF: Grandpaternal-Chow on HFD; GpatHF-HF: Grandpaternal-HFD on HFD.
Supplementary Figure S3
Transcriptomic analysis and DNA methylation in metabolic tissues of offspring shows modest association to sperm DNA methylation. (A) Gene expression representation in Extensor Digitorum Longus (EDL) muscle, liver and white adipose tissue (WAT) of the F2-female offspring. Represented targets are the nearest genes of the 18 sperm DMRs common to F0 and F1 offspring. Data are represented as log2 of the fold change of GpatHF-CD vs GpatCD-CD F2-females. (B) Target-specific DNA methylation in WAT of F2 females. DNA methylation is represented as percentage of methylated DNA relative to input (total) DNA of each target measured by quantitative PCR after MBD-capture (n = 7–9). Student's t-test: *p < 0.05: GpatHF-CD vs GpatCD-CD. GpatCD-CD: Grandpaternal-Chow on Chow; GPatHF-CD: Grandpaternal-HFD on Chow. N.D.: Not Detected. FC: Fold Change.
Supplementary Figure S4
SncRNA expression pattern in sperm from F0 and F1 rats. Distribution of different small non-coding RNAs (sncRNAs) categories in sperm of (A) F0 (n = 8–10) and (B) F1 (n = 7 per group) rats. (CE) Chromosomal distribution (sperm karyogram) of differentially expressed sncRNA: (C) F0-HF vs F0-CD; (D) F1 (PatHF-CD vs PatCD-CD) and (E) F1 (PatHF-HF vs PatCD-HF). F0-CD: F0 on chow diet; F0-HF: F0 on HFD; PatCD-CD: Paternal-Chow on Chow; PatHF-CD: Paternal-HFD on Chow; PatCD-HF: Paternal-Chow on HFD; PatHF-HF: Paternal-HFD on HFD. Student's t-test: *p ≤ 0.05 (F1 vs F0). F0-CD: F0 on chow diet; F0-HF: F0 on HFD; PatCD-CD: Paternal-Chow on Chow; PatHF-CD: Paternal-HFD on Chow; PatCD-HF: Paternal-Chow on HFD; PatHF-HF: Paternal-HFD on HFD.
Supplementary Figure S5
Gametic small non-coding RNA expression is altered by HFD and paternal diet. (AC) Number of differentially expressed sncRNAs (miRNAs, tRFs and piRNAs) in the sperm of (A) F0-HF vs F0-CD (n = 8–10), (B) F1 offspring of F0-HF (PatHF-CD) vs F1 of F0-CD (PatCD-CD) fed a chow diet or (C) a high fat diet (PatHF-HF vs PatCD-HF) (n = 7 per group; 1 sibling per litter). Sperm sncRNA expression pattern in percentage per group in (D) F0 and (E) F1. F0-CD: F0 on chow diet; F0-HF: F0 on HFD; PatCD-CD: Paternal-Chow on Chow; PatHF-CD: Paternal-HFD on Chow; PatCD-HF: Paternal-Chow on HFD; PatHF-HF: Paternal-HFD on HFD. DE: Differentially Expressed. rRNA (rRNA annotation from Ensemble) and rRNArep (rRNA annotation from repeatmask2).
Supplementary Figure S6
Expression of let-7c in WAT of male offspring and mRNA expression of predicted targets. Expression of let-7c in WAT of male offspring (A) F1 and (B) F2. The snoRNA was used as internal control. (C) Quantitative PCR validation of let-7c predicted target genes in WAT of F1 males (n = 6 per group; 1 sibling per litter). Geometric mean of the housekeeping genes RPLP0 and β-actin was used for normalization. Transcriptomic analysis in WAT of F2-female offspring (D) Known let-7 target genes in the insulin/Igf signaling pathway and (E) Insulin/Igf signaling predicted target genes of let-7c in rats (n = 6–7). Values are represented as mean ± SEM. *p ≤ 0.05: PatCD-HF vs PatCD-CD; ¤p ≤ 0.05: PatHF-CD vs PatCD-CD; +p ≤ 0.05: PatHF-HF vs PatCD-HF.
Supplementary Figure S7
Validation of miRNA expression in sperm of F0 and F1 offspring. miRNA expression measured by quantitative PCR using TaqMan specific probes for (A) let-7c; (B) miR-293 and (C) miR-880. U6 was used as internal control. Values are represented as mean ± SEM. Student's t-test or two-way ANOVA followed by Bonferroni post-hoc test: *p ≤ 0.05: F0-HF vs F0-CD; +p ≤ 0.05: PatHF-HF vs PatCD-HF; #p ≤ 0.05: PatHF-HF vs PatHF-CD. F0 (n = 13–16); F1 (n = 7–12).
Figure 1
Figure 1
Body weight and β-cell mass is altered in newborn offspring of HFD-fed founders. (A) Schematic diagram of study design: F0 male Sprague–Dawley rats fed a chow (F0-CD) or high-fat diet (F0-HF) for 12 weeks were mated with control females fed a chow diet (CTL, CD) to generate the F1 offspring. Twelve week-old chow-fed F1 male rats from F0-CD or F0-HF were mated with females from an independent line (also maintained on chow diet) to generate the F2 offspring. At 10 weeks of age, a sub-group of F1 and F2 female and male offspring was subjected to chow or high fat diet (HFD) for 12 weeks. Metabolic status of the offspring was assessed. (B) Body weight of 3-day-old F1-offspring (n = 190 and 181 from 16 litters of PatCD-CD and 14 litters of PatHF-CD, respectively). (C) Body weight of 3-day-old F2-offspring (n = 52 and 71 from 5 litters of GpatCD-CD and 6 litters of GpatHF-CD, respectively). Decreased pancreatic β-cell mass in female F1-offspring from HFD-fed fathers: (D) Representative images of Optical Projection Tomography (OPT) analysis of insulin-secreting cells in whole pancreas from 5-day-old female rats (E) quantification of OPT measures (n = 4 and 5 from 4 litters of PatCD-CD and 2 litters of PatHF-CD, respectively). Results are represented as mean ± SEM. Student's t-test: *p ≤ 0.05: PatHF-CD vs PatCD-CD; **p ≤ 0.05, GpatHF-CD vs GpatCD-CD. PatCD-CD: Paternal-Chow on Chow; PatHF-CD: Paternal-HFD on Chow; GpatCD-CD: Grandpaternal-Chow on Chow; GpatHF-CD: Grandpaternal-HFD on Chow.
Figure 2
Figure 2
Impaired glucose tolerance and reduced body weight gain in response to HFD persists into two generations. (AC) Metabolic profiling of F1 female offspring after 12 weeks of high fat feeding; blood (A) glucose and (B) insulin during an intraperitoneal glucose tolerance test (ipGTT) (n = 9–11 animals; 1 sibling per litter) and (C) body weight curve (n = 14–22 animals from 14 to 17 litters; used more than 1 sibling per litter). (DF) Metabolic profiling of F2 female offspring after 12 weeks of high fat feeding: Blood (D) glucose and (E) insulin during an ipGTT (n = 5–6 litters; 1 sibling per litter) and (F) body weight curve (n = 10–13 animals from 5 to 6 litters; used more than one sibling per litter). Results are represented as mean ± SEM. Two-way ANOVA followed by Bonferroni post-hoc test: *p ≤ 0.05: PatCD-HF vs PatCD-CD or GpatCD-HF vs GpatCD-CD; ¤p ≤ 0.05: PatHF-CD vs PatCD-CD or GpatHF-CD vs GpatCD-CD; #p ≤ 0.05: PatHF-HF vs PatHF-CD or GpatHF-HF vs GpatHF-CD; +p ≤ 0.05: PatHF-HF vs PatCD-HF or GpatHF-HF vs GpatCD-HF. PatCD-CD: Paternal-Chow on Chow; PatHF-CD: Paternal-HFD on Chow; PatCD-HF: Paternal-Chow on HFD; PatHF-HF: Paternal-HFD on HFD; GpatCD-CD: Grandpaternal-Chow on Chow; GpatHF-CD: Grandpaternal-HFD on Chow; GpatCD-HF: Grandpaternal-Chow on HFD; GpatHF-HF: Grandpaternal-HFD on HFD.
Figure 3
Figure 3
High-fat diet alters the DNA methylation signature of spermatozoa. (A) Main biological functions obtained by DAVID ontology analysis of genes commonly differentially methylated in the sperm of F0 (HF vs CD) and F1 (PatHF-HF vs PatCD-HF). Bars represent the number of genes involved in each of the functional clusters that were differentially methylated and black dots indicate p-values. Total is the total number of genes near or overlapping with common differentially methylated regions. (B) Differentially methylated regions common in sperm of F0 and F1 indicates a direct gametic transgenerational reprogramming. Data are represented as log2 of the fold change in F0 (HF vs CD) or F1 (PatHF-CD vs PatCD-CD) founders. (C) Representative figure of genomic views of differentially methylated regions near transcription start sites (−/+1000 bp relative to the TSS) in sperm from F0-HF and PatHF-CD as compared to their respective controls. Data is represented as –log10(p value) of methylation signal and was generated using MACS2 bdgcmp with the ‘-m ppois’ parameter set (F0, n = 7 per group; F1-Chow, n = 8–11 litters; F1-HFD, 5–7 litters). F0-CD: F0 on chow diet; F0-HF: F0 on HFD; PatCD-CD: Paternal-Chow on Chow; PatHF-CD: Paternal-HFD on Chow; PatCD-HF: Paternal-Chow on HFD; PatHF-HF: Paternal-HFD on HFD.
Figure 4
Figure 4
Small non-coding RNA expression in sperm of F0 and F1 rats shows transgenerational programming. (A) sncRNA molecules differentially expressed in sperm of high fat diet fed F0 founders (F0-HF vs F0-CD) and their F1 offspring (PatHF-CD vs PatCD-CD). Effect of HFD and/or paternal-HFD on the expression of (B) miRNAs in sperm of F0 and F1 rats and (C) tRNA fragments (tRF). F0: n = 8–10 and F1: n = 7–12. Y-axis represents normalized counts per total number of reads of each specific sncRNA category (counts per million). Values are represented as mean ± SEM. F0-CD: F0 on chow diet; F0-HF: F0 on HFD; PatCD-CD: Paternal-Chow on Chow; PatHF-CD: Paternal-HFD on Chow; PatCD-HF: Paternal-Chow on HFD; PatHF-HF: Paternal-HFD on HFD.
Figure 5
Figure 5
Let-7c expression is altered in metabolic tissues of offspring. Let-7c expression in liver of (A) F1 (n = 11–12 from 11 to 12 litters), and (B) F2 (n = 6–7 litters; 1 sibling per litter); Extensor Digitorum Longus (EDL) muscle of (C) F1 (n = 5 litters; 1 sibling per litter) and (D) F2 (n = 5 litters; 1 sibling per litter); white adipose tissue (WAT) of (E) F1 (n = 8–10 from 6 to 7 litters; used more than 1 sibling per litter) or (G) F2 (n = 8–13 from 6 to 7 litters; used more than 1 sibling per litter). Expression of all let-7 family members in WAT of (F) F1 and (H) F2 female offspring. U6, U87 or snoRNA were used as internal controls depending on the tissue. Two-way ANOVA followed by Bonferroni post-hoc test: *p ≤ 0.05: PatCD-HF vs PatCD-CD or GpatCD-HF vs GpatCD-CD; ¤p ≤ 0.05: PatHF-CD vs PatCD-CD or GpatHF-CD vs GpatCD-CD; #p ≤ 0.05: PatHF-HF vs PatHF-CD or GpatHF-HF vs GpatHF-CD; +p ≤ 0.05: PatHF-HF vs PatCD-HF or GpatHF-HF vs GpatCD-HF. Results are represented as mean ± SEM. PatCD-CD: Paternal-Chow on Chow; PatHF-CD: Paternal-HFD on Chow; PatCD-HF: Paternal-Chow on HFD; PatHF-HF: Paternal-HFD on HFD; GpatCD-CD: Grandpaternal-Chow on Chow; GpatHF-CD: Grandpaternal-HFD on Chow; GpatCD-HF: Grandpaternal-Chow on HFD; GpatHF-HF: Grandpaternal-HFD on HFD.
Figure 6
Figure 6
Let-7c expression in WAT of female offspring shows inverse relationship with predicted target genes. (A) Inverse relationship between expression of let-7c and its predicted target genes in white adipose tissue (WAT) of F2 female offspring. Dotted black curve represents the permutation analysis of let-7c expression correlation to target genes. Red curve represents the correlation coefficients of let-7c to predicted target gene. Expression of let-7c predicted target genes was obtained by Affymetrix transcriptomic analysis. (B) Gene ontology analysis of let-7c predicted target genes with an inverse relationship to let-7c expression in WAT of F2-females (performed with DAVID Bioinformatics Resources). Bars represent the number of genes involved in each of the functional clusters and black dots indicate the p values. Total is the total number of genes found to have a significant inverse relationship to let-7c expression. (C) Quantitative PCR validation of let-7c predicted target genes inversely correlated to let-7c expression in WAT of F1 females (n = 10–12 per group; 1 sibling per litter). Geometric mean of the housekeeping genes RPLP0 and β-actin was used for normalization. Values are represented as mean ± SEM (D) Representation of let-7c predicted target genes inversely correlated to let-7c expression in transcriptomic analysis of F2 offspring WAT (n = 6–7 per group; 1 sibling per litter). (E) Representative blots of protein abundance of AKT2, IR-β, IRS2 and Caspase 9 (CASP9) in WAT of F1-female. (F) Protein abundance of AKT2, IR-β, IRS2 and CASP9. Ponceau staining of the membranes was used for data normalization. Results are represented as mean ± SEM. Two-way ANOVA followed by Bonferroni post-hoc test: *p ≤ 0.05: PatCD-HF vs PatCD-CD; ¤p ≤ 0.05: GpatCD-HF vs GpatCD-CD; +p ≤ 0.05: PatHF-HF vs PatCD-HF or GpatHF-HF vs GpatCD-HF. PatCD-CD: Paternal-Chow on Chow; PatHF-CD: Paternal-HFD on Chow; GpatCD-CD: Grandpaternal-Chow on Chow; GpatHF-CD: Grandpaternal-HFD on Chow; GpatCD-HF: Grandpaternal-Chow on HFD; GpatHF-HF: Grandpaternal-HFD on HFD. B–H: Benjamini and Hochberg corrected p-values. AU: arbitrary units.

References

    1. Lake J.K., Power C., Cole T.J. Child to adult body mass index in the 1958 British birth cohort: associations with parental obesity. Archives of Disease in Childhood. 1997;77:376–381. - PubMed
    1. Carone B.R., Fauquier L., Habib N., Shea J.M., Hart C.E., Li R. Paternally induced transgenerational environmental reprogramming of metabolic gene expression in mammals. Cell. 2010;143:1084–1096. - PMC - PubMed
    1. Jimenez-Chillaron J.C., Isganaitis E., Charalambous M., Gesta S., Pentinat-Pelegrin T., Faucette R.R. Intergenerational transmission of glucose intolerance and obesity by in utero undernutrition in mice. Diabetes. 2009;58:460–468. - PMC - PubMed
    1. Pembrey M.E., Bygren L.O., Kaati G., Edvinsson S., Northstone K., Sjostrom M. Sex-specific, male-line transgenerational responses in humans. European Journal of Human Genetics. 2006;14:159–166. - PubMed
    1. Gapp K., Jawaid A., Sarkies P., Bohacek J., Pelczar P., Prados J. Implication of sperm RNAs in transgenerational inheritance of the effects of early trauma in mice. Nature Neuroscience. 2014;17:667–669. - PMC - PubMed