. 2016 Jan 11;5(3):233-244.
doi: 10.1016/j.molmet.2016.01.002. eCollection 2016 Mar.

Integration of ATAC-seq and RNA-seq identifies human alpha cell and beta cell signature genes

Affiliations

Integration of ATAC-seq and RNA-seq identifies human alpha cell and beta cell signature genes

Amanda M Ackermann et al. Mol Metab. .

Abstract

Objective: Although glucagon-secreting α-cells and insulin-secreting β-cells have opposing functions in regulating plasma glucose levels, the two cell types share a common developmental origin and exhibit overlapping transcriptomes and epigenomes. Notably, destruction of β-cells can stimulate repopulation via transdifferentiation of α-cells, at least in mice, suggesting plasticity between these cell fates. Furthermore, dysfunction of both α- and β-cells contributes to the pathophysiology of type 1 and type 2 diabetes, and β-cell de-differentiation has been proposed to contribute to type 2 diabetes. Our objective was to delineate the molecular properties that maintain islet cell type specification yet allow for cellular plasticity. We hypothesized that correlating cell type-specific transcriptomes with an atlas of open chromatin will identify novel genes and transcriptional regulatory elements such as enhancers involved in α- and β-cell specification and plasticity.

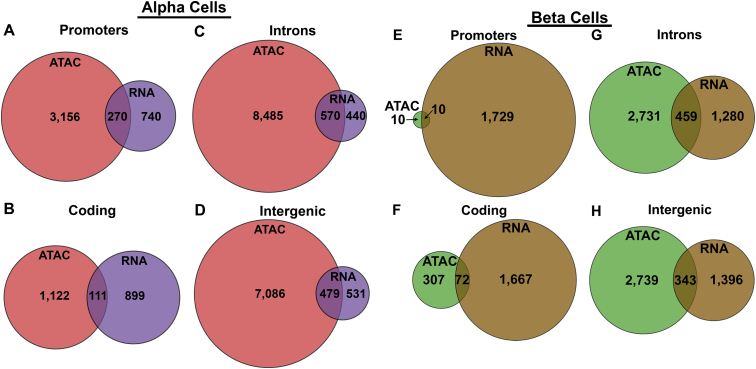
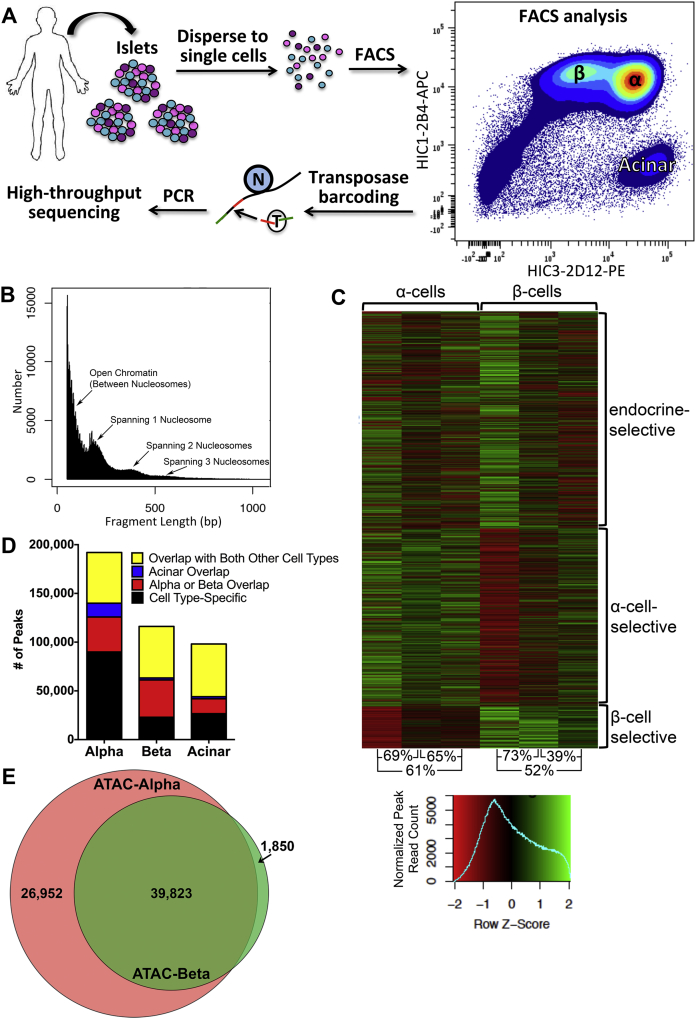
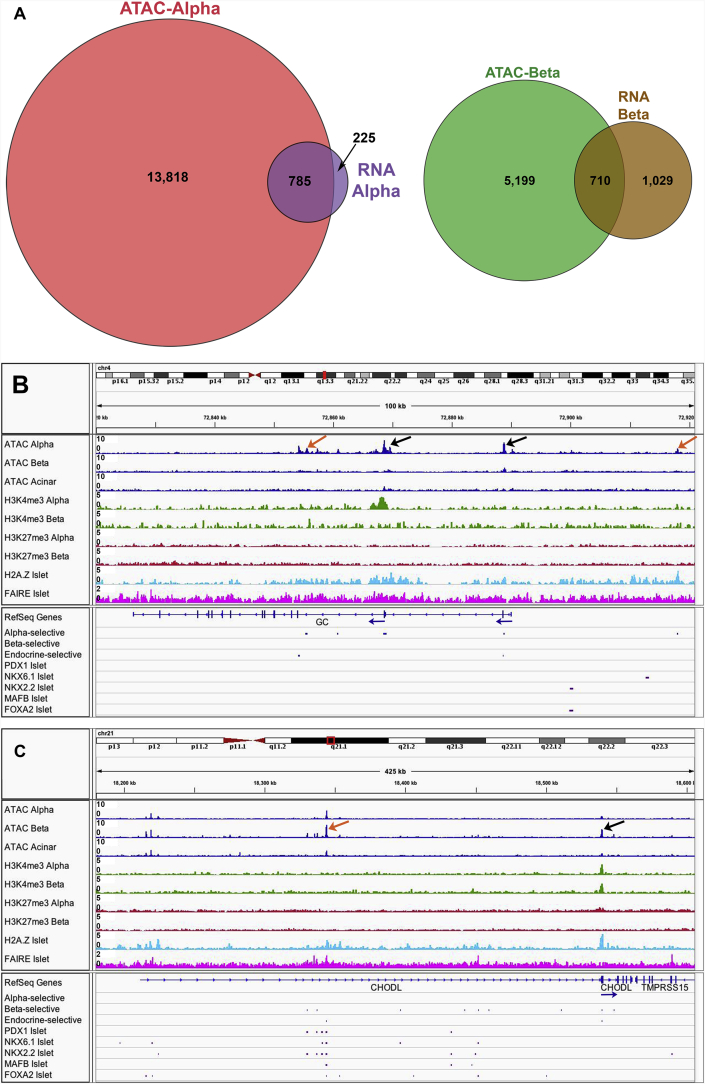
Methods: We sorted human α- and β-cells and performed the "Assay for Transposase-Accessible Chromatin with high throughput sequencing" (ATAC-seq) and mRNA-seq, followed by integrative analysis to identify cell type-selective gene regulatory regions.

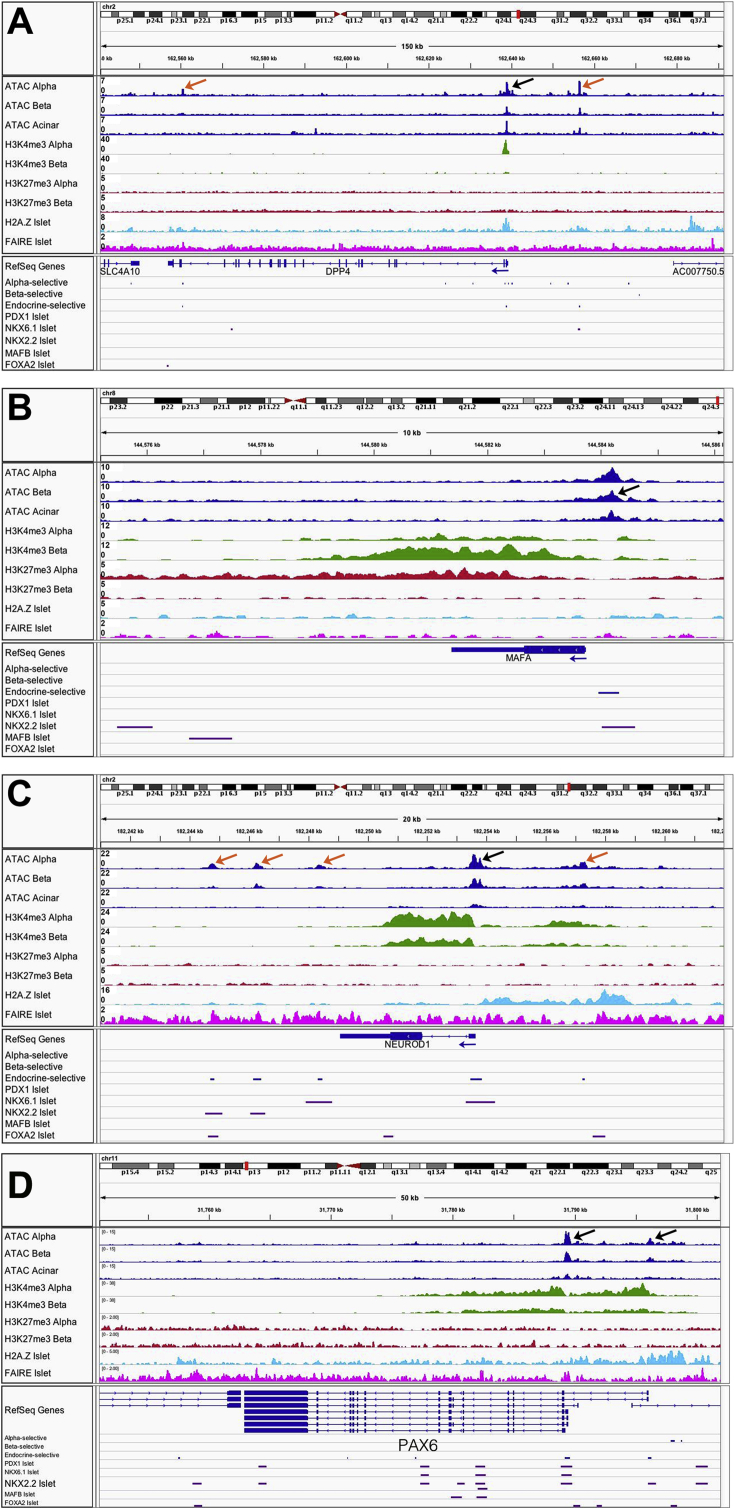
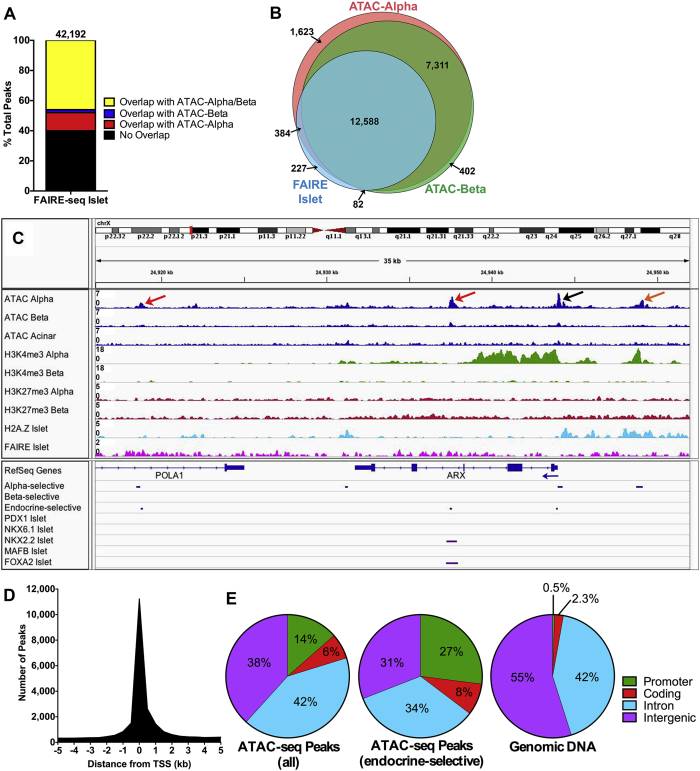
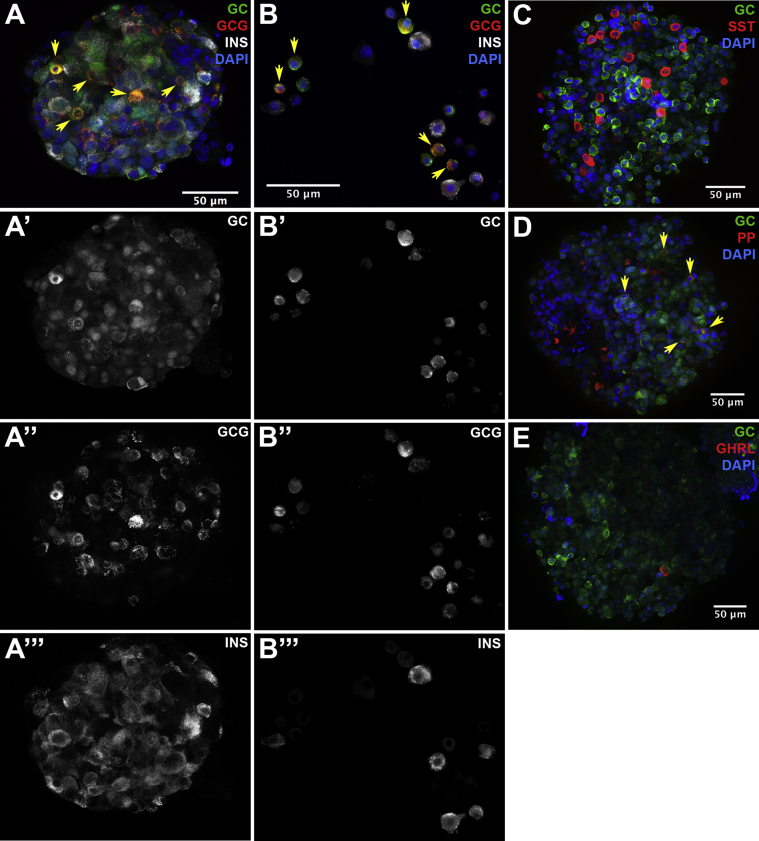
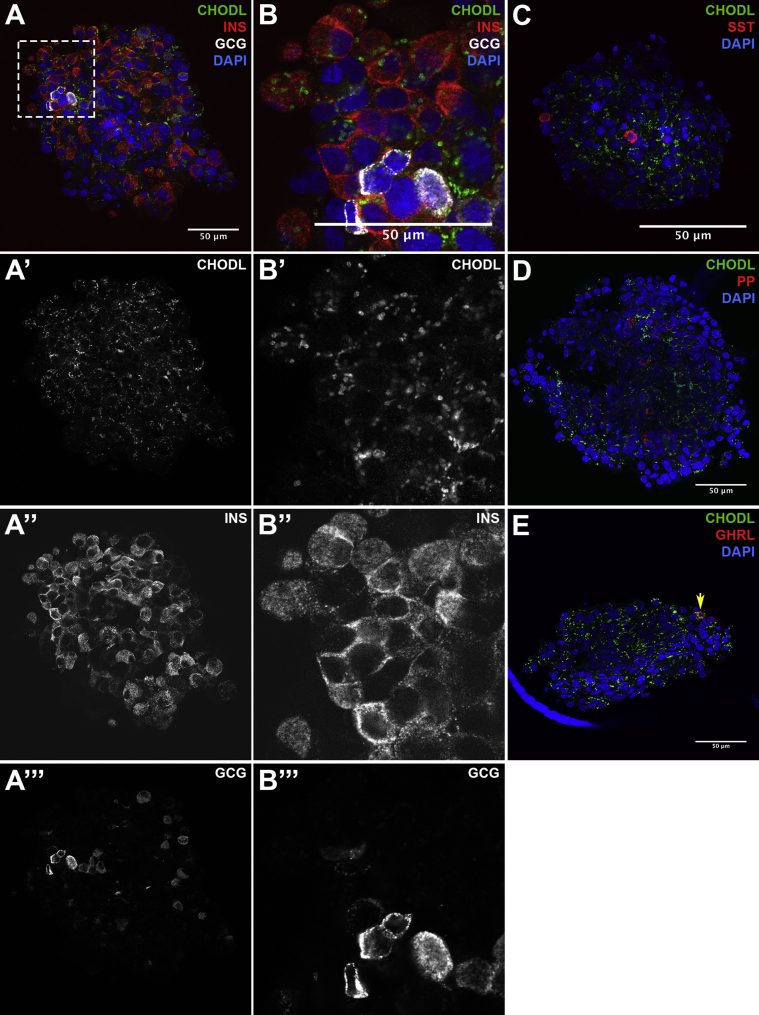
Results: We identified numerous transcripts with either α-cell- or β-cell-selective expression and discovered the cell type-selective open chromatin regions that correlate with these gene activation patterns. We confirmed cell type-selective expression on the protein level for two of the top hits from our screen. The "group specific protein" (GC; or vitamin D binding protein) was restricted to α-cells, while CHODL (chondrolectin) immunoreactivity was only present in β-cells. Furthermore, α-cell- and β-cell-selective ATAC-seq peaks were identified to overlap with known binding sites for islet transcription factors, as well as with single nucleotide polymorphisms (SNPs) previously identified as risk loci for type 2 diabetes.

Conclusions: We have determined the genetic landscape of human α- and β-cells based on chromatin accessibility and transcript levels, which allowed for detection of novel α- and β-cell signature genes not previously known to be expressed in islets. Using fine-mapping of open chromatin, we have identified thousands of potential cis-regulatory elements that operate in an endocrine cell type-specific fashion.

Keywords: ARX, aristaless related homeobox; ATAC-seq, Assay for Transposase-Accessible Chromatin with high throughput sequencing; Alpha cell; Beta cell; CHODL, chondrolectin; ChIP-seq, Chromatin Immunoprecipitation followed by high throughput sequencing; DAPI, 4′,6-diamidino-2-phenylindole; DPP4, dipeptidyl-peptidase 4; Diabetes; Epigenetics; FACS, fluorescence-activated cell sorting; FAIRE-seq, Formaldehyde-Assisted Isolation of Regulatory Elements followed by high throughput sequencing; GC, group-specific protein; GCG, glucagon; GHRL, ghrelin; IGF2, insulin like growth factor 2; INS, insulin; IRX2, iroquois homeobox 2; Islet; MAFA, v-maf avian musculoaponeurotic fibrosarcoma oncogene homolog A; NEUROD1, neuronal differentiation 1; Open chromatin; PP, pancreatic polypeptide; SNP, single nucleotide polymorphism; SST, somatostatin.


Figures

Supplemental Figure 1
Integration of ATAC-seq data with mRNA-seq data. Venn diagrams showing overlap of ATAC-seq peaks and gene expression based on annotation for (A-D) α-cell-selective genes and (E-H) β-cell-selective genes.
Supplemental Figure 2
Integration of ATAC-seq data with histone epigenetic ChIP-seq, and FAIRE-seq data for known α- and β-cell genes. Pooled sequencing tracks for the (A) DPP4, (B) MAFA, (C) NEUROD1 and PAX6 (D) loci from α-cell, β-cell, and acinar cell ATAC-seq data (blue); α-cell and β-cell H3K4me3 (green) and H3K4me27 (red) ChIP-seq data; whole islet H2A.Z ChIP-seq data (light blue); and whole islet FAIRE-seq data (pink). Cell type-selective peaks are identified in blue below RefSeq Genes, followed by islet transcription factor ChIP-seq peaks in purple. Known promoter regions are indicated with black arrows, and putative enhancer regions are indicated with orange arrows.
Figure 1
Figure 1
ATAC-seq results in sorted human α-, β-, and acinar cells. (A) Experimental design. Islets from deceased organ donors were dispersed and FACS sorted into α-, β-, and acinar cell fractions, and processed for ATAC-seq analysis. N: nucleosome; T: transposase. Red and green bars represent PCR/sequencing barcodes. (B) Fragment lengths within a representative ATAC-seq library. The small fragments represent sequence reads in open chromatin, while the peak at ∼150 bp results from sequence reads that span one nucleosome, and larger peaks represent progressively more compact chromatin. (C) Heatmap of ATAC-seq peak data showing clustering of endocrine-selective peaks (present in α- and β-, but not acinar cells), α-cell-selective peaks, and β-cell-selective peaks. Inter-sample correlation is noted at the bottom. (D) Number of peaks identified by ATAC-seq in each cell type that are specific to that cell type versus also found in either of the other two cell types investigated. (E) Venn diagram of overlap of α-cell-selective and β-cell-selective ATAC-seq peaks, after removal of peaks also found in acinar cells.
Figure 2
Figure 2
Integration of ATAC-seq data with other genomics datasets. (A) Bar graph of % of overlapping open chromatin regions identified by FAIRE-seq in whole islets versus by ATAC-seq in α- and β-cells (including peaks also found in acinar cells). Total number of FAIRE-seq peaks is noted at top. (B) Venn diagram of distinct genes with open chromatin regions in α- and β-cells identified by ATAC-seq (including peaks also found in acinar cells) versus in whole islets identified by FAIRE-seq. (C) Sequencing tracks for the ARX locus shows distinct α-cell-specific ATAC-seq peaks at the promoter (black arrow), at known intronic and distal enhancers (red arrows), and at a putative 5′ enhancer (orange arrow), none of which were identified by FAIRE-seq. (D) Histogram of distance from the nearest transcriptional start site (TSS) for all ATAC-seq peaks within 5 kb of the nearest TSS that were identified in α- and β-cells. Not shown are peaks 5–280 kb from the nearest TSS. (E) Proportions of the ATAC-seq peak regions identified in α- and β-cells that represent the various genome annotations, compared to the representation of a given sequence element in the human genome .
Figure 3
Figure 3
Integration of ATAC-seq data with mRNA-seq, histone marks, FAIRE-seq, and transcription factor binding data for novel α- and β-cell genes. (A) Venn diagrams indicating the proportion of genes that are differentially expressed in α- or β-cells (based on mRNA-seq) that have cell type-selective ATAC-seq peaks (identified only in α- or β-cells, including peaks also identified in acinar cells). (B) Pooled sequencing tracks for the GC locus from α-cell, β-cell, and acinar cell ATAC-seq data (blue); α-cell and β-cell H3K4me3 (green) and H3K4me27 (red) ChIP-seq data; whole islet H2A.Z ChIP-seq data (light blue); and whole islet FAIRE-seq data (pink). Cell type-selective peaks are identified in blue below the row labeled “RefSeq Genes”, followed by islet transcription factor ChIP-seq peaks in purple. Promoter regions are indicated with black arrows, and putative enhancer regions are labeled with orange arrows. (C) Pooled sequencing tracks for the CHODL gene. Annotation as in (B).
Figure 4
Figure 4
Immunofluorescent labeling for the novel α-cell-selective protein GC. Whole mount immunofluorescent labeling of human islets (A, C-E) and dispersed human islet cells (B) for GC and the islet hormones as indicated in the figure labels. Yellow arrowheads indicate cells expressing GC and islet hormones. GC: group-specific component; GCG: glucagon; INS: insulin; SST: somatostatin; PP: pancreatic polypeptide; GHRL: ghrelin; DAPI: 4′,6-diamidino-2-phenylindole.
Figure 5
Figure 5
Immunofluorescent labeling for the novel β-cell-selective protein CHODL. (AE) Whole mount immunofluorescent labeling of human islets for CHODL and the islet hormones as indicated in the figure labels. The boxed region in (A) is magnified in (B). CHODL: chondrolectin; GCG: glucagon; INS: insulin; SST: somatostatin; PP: pancreatic polypeptide; GHRL: ghrelin; DAPI: 4′,6-diamidino-2-phenylindole.

References

    1. Gradwohl G., Dierich A., LeMeur M., Guillemot F. Neurogenin3 is required for the development of the four endocrine cell lineages of the pancreas. Proceedings of National Academy of Sciences U S A. 2000;97(4):1607–1611. - PMC - PubMed
    1. Bramswig N.C., Everett L.J., Schug J., Dorrell C., Liu C., Luo Y. Epigenomic plasticity enables human pancreatic alpha to beta cell reprogramming. Journal of Clinical Investigation. 2013;123(3):1275–1284. - PMC - PubMed
    1. Rickels M.R., Fuller C., Dalton-Bakes C., Markmann E., Palanjian M., Cullison K. Restoration of glucose counterregulation by islet transplantation in long-standing type 1 diabetes. Diabetes. 2015;64(5):1713–1718. - PMC - PubMed
    1. Unger R.H., Cherrington A.D. Glucagonocentric restructuring of diabetes: a pathophysiologic and therapeutic makeover. Journal of Clinical Investigation. 2012;122(1):4–12. - PMC - PubMed
    1. Brissova M., Fowler M.J., Nicholson W.E., Chu A., Hirshberg B., Harlan D.M. Assessment of human pancreatic islet architecture and composition by laser scanning confocal microscopy. Journal of Histochemistry & Cytochemistry. 2005;53(9):1087–1097. - PubMed