. 2016 Jan 22;5(3):245-252.
doi: 10.1016/j.molmet.2016.01.005. eCollection 2016 Mar.

Sex difference in physical activity, energy expenditure and obesity driven by a subpopulation of hypothalamic POMC neurons

Affiliations

Sex difference in physical activity, energy expenditure and obesity driven by a subpopulation of hypothalamic POMC neurons

Luke K Burke et al. Mol Metab. .

Abstract

Objective: Obesity is one of the primary healthcare challenges of the 21st century. Signals relaying information regarding energy needs are integrated within the brain to influence body weight. Central among these integration nodes are the brain pro-opiomelanocortin (POMC) peptides, perturbations of which disrupt energy balance and promote severe obesity. However, POMC neurons are neurochemically diverse and the crucial source of POMC peptides that regulate energy homeostasis and body weight remains to be fully clarified.

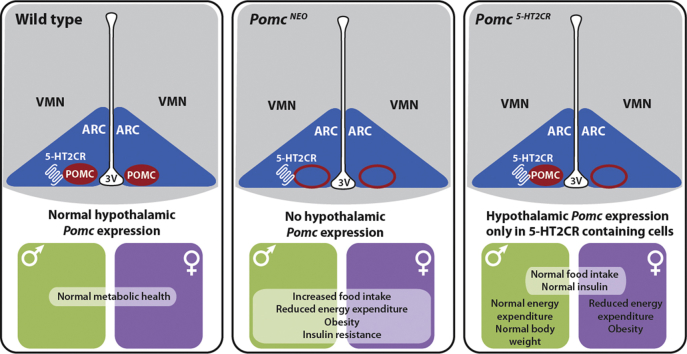
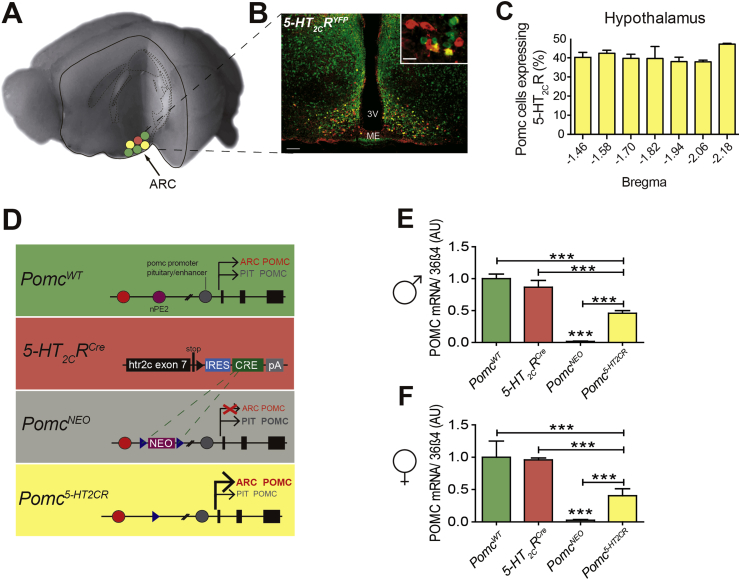
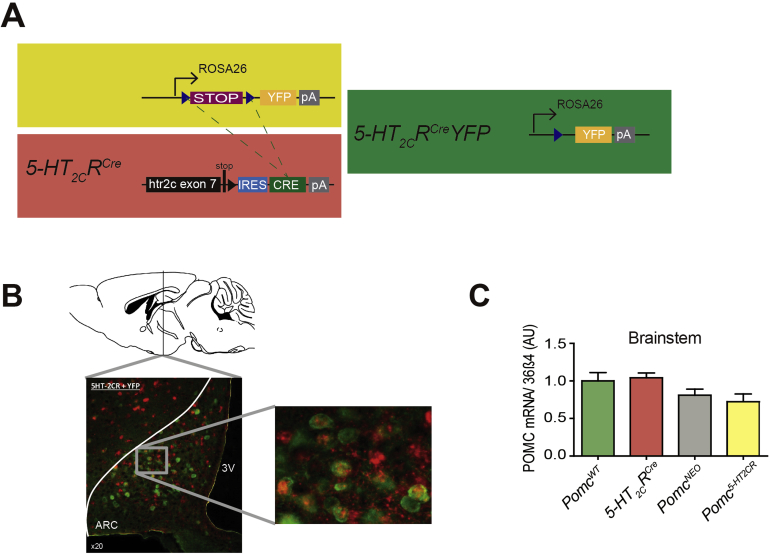
Methods: Given that a 5-hydroxytryptamine 2c receptor (5-HT2CR) agonist is a current obesity medication and 5-HT2CR agonist's effects on appetite are primarily mediated via POMC neurons, we hypothesized that a critical source of POMC regulating food intake and body weight is specifically synthesized in cells containing 5-HT2CRs. To exclusively manipulate Pomc synthesis only within 5-HT2CR containing cells, we generated a novel 5-HT 2C R (CRE) mouse line and intercrossed it with Cre recombinase-dependent and hypothalamic specific reactivatable Pomc (NEO) mice to restrict Pomc synthesis to the subset of hypothalamic cells containing 5-HT2CRs. This provided a means to clarify the specific contribution of a defined subgroup of POMC peptides in energy balance and body weight.

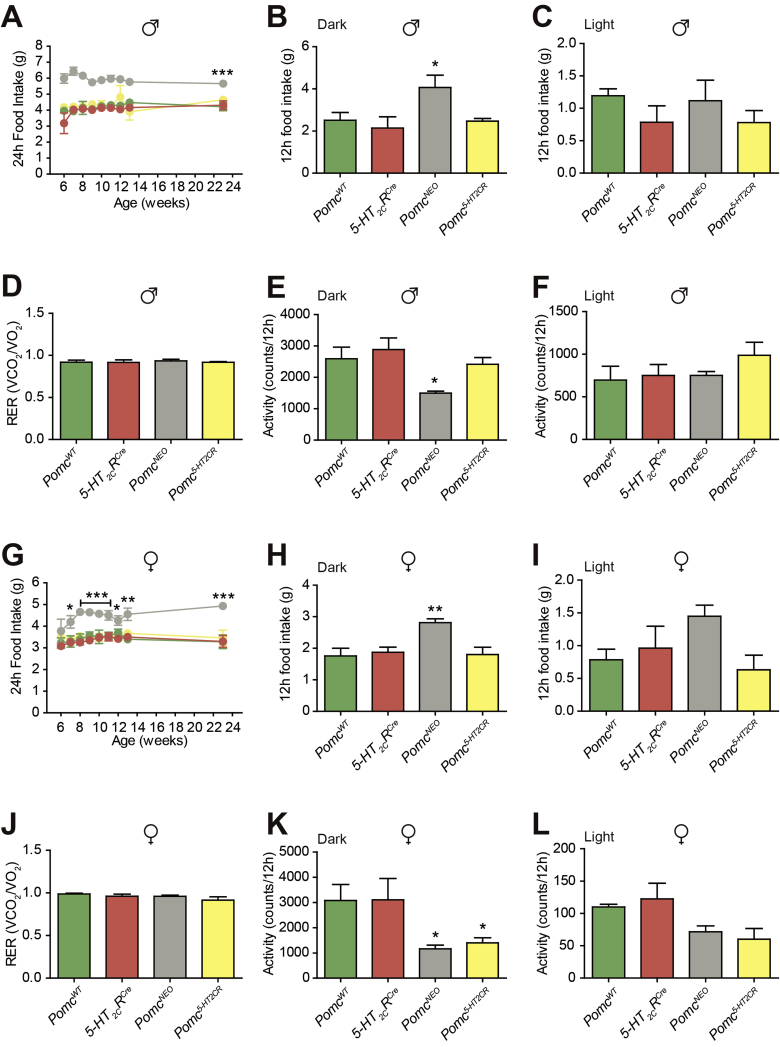
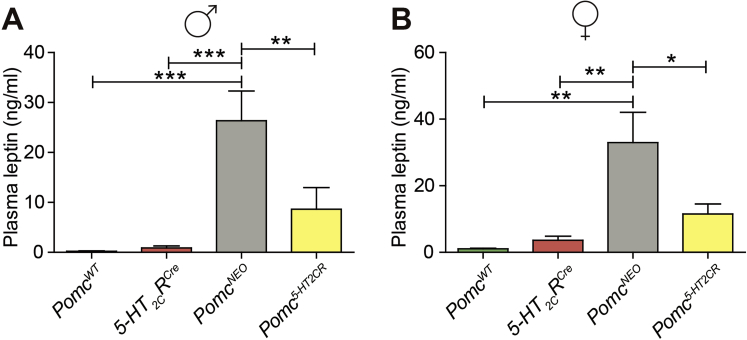
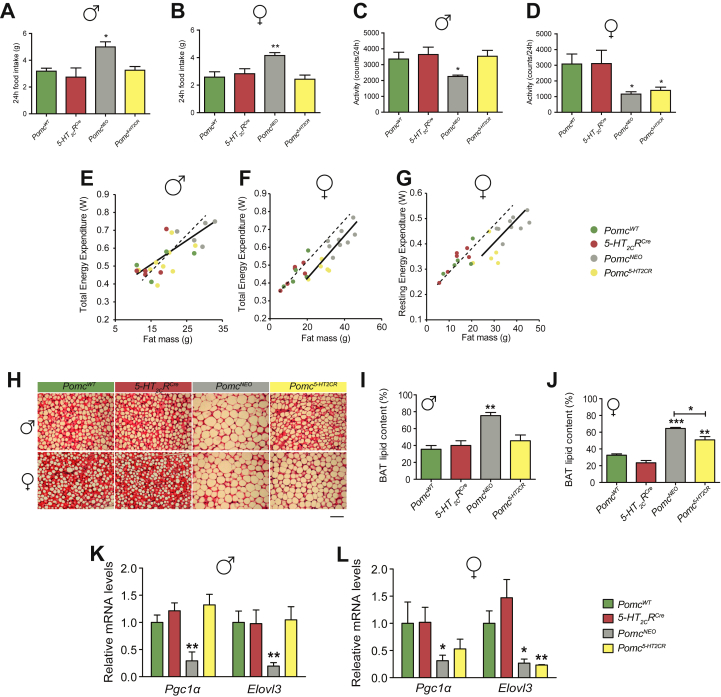
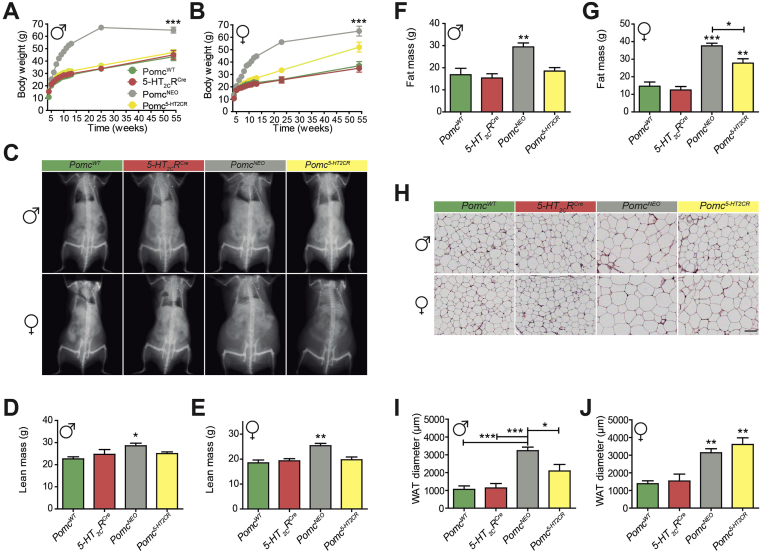
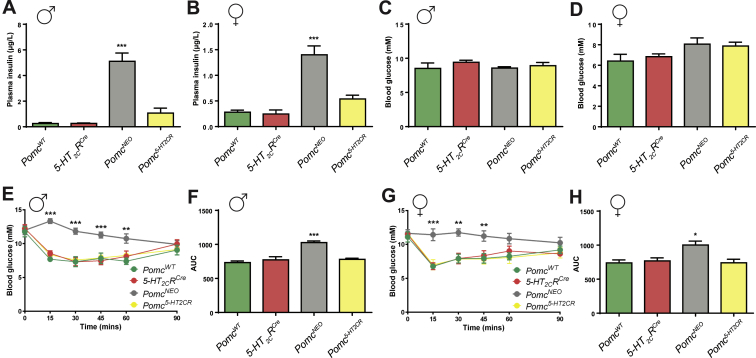
Results: Here we transform genetically programed obese and hyperinsulinemic male mice lacking hypothalamic Pomc with increased appetite, reduced physical activity and compromised brown adipose tissue (BAT) into lean, healthy mice via targeted restoration of Pomc function only within 5-HT2CR expressing cells. Remarkably, the same metabolic transformation does not occur in females, who despite corrected feeding behavior and normalized insulin levels remain physically inactive, have lower energy expenditure, compromised BAT and develop obesity.

Conclusions: These data provide support for the functional heterogeneity of hypothalamic POMC neurons, revealing that Pomc expression within 5-HT2CR expressing neurons is sufficient to regulate energy intake and insulin sensitivity in male and female mice. However, an unexpected sex difference in the function of this subset of POMC neurons was identified with regard to energy expenditure. We reveal that a large sex difference in physical activity, energy expenditure and the development of obesity is driven by this subpopulation, which constitutes approximately 40% of all POMC neurons in the hypothalamic arcuate nucleus. This may have broad implications for strategies utilized to combat obesity, which at present largely ignore the sex of the obese individual.

Keywords: 5-HT2c receptor; Brown adipose tissue; Energy expenditure; Hyperinsulinemia; Hypothalamus; Obesity; Pro-opiomelanocortin (Pomc); Sexual dimorphism.


Figures

None
Graphical abstract
None
2
None
3
Figure 1
Figure 1
Generation of mice with restored ARC Pomc function in 5-HT2CR expressing cells. (A,B) ARC POMC neurons (POMC-IR, red) co-express 5-HT2CRs (GFP-IR, green; co-labeled, yellow). Scale bar, 50 μm (inset) and 100 μm. (C) POMC-IR and 5-HT2CR (GFP-IR) co-expression by ARC bregma level. (D) Schematic of wild-type allele (PomcWT) containing both neuronal Pomc enhancers, nPE1 and nPE2 (green); 5-HT2CRCRE inserted after ht2rc exon 7 (red); a disrupted PomcNEO knockout allele carrying nPE2 deletion and a loxP-flanked-mediated disruption of nPE1 transcriptional activation function (gray); and a re-activated Pomc/5-HT2C allele (Pomc5−HT2CR) (yellow). (E)Pomc re-expression in 5-HT2CR neurons in male (F3,19 = 22.40, P < 0.0001) and (F) female mice (F3,15 = 18.40, P < 0.0001) normalized to 36β4 mRNA, relative to PomcWT, in arbitrary units (AU). *P < 0.05, **P < 0.01, ***P < 0.001 as indicated.
Figure 2
Figure 2
Subpopulation of Pomc differentially modulates physical activity and energy expenditure in male and female mice. 24 h food intake was significantly elevated in (A) male (F3,12 = 13.98, P < 0.001) and (B) female (F3,11 = 6.55, P < 0.001) ARC Pomc null (PomcNEO) mice, and this was normalized by restoration of Pomc in 5-HT2CR neurons in Pomc5−HT2CR mice. 24 h locomotor activity was significantly reduced in (C) male (F3,17 = 3.68, P < 0.05) and (D) female (F3,18 = 5.36, P < 0.05) PomcNEO mice, and this was normalized in male, but not female, Pomc5-HT2CR mice. General linear model in (E) male and (F) female mice illustrating reduced total daily energy expenditure in PomcNEO and Pomc5-HT2CR mice (solid line) compared to control siblings (dashed line) in females (group effect P < 0.01) but not in males (group effect P > 0.05). (G) General linear model revealing PomcNEO and Pomc5-HT2CR females (solid line) display reduced resting metabolic rate compared to control siblings (dashed line) (group effect P < 0.01). (H,I) Lipid accumulation in interscapular brown adipose tissue (BAT; F3,17 = 11.61, P < 0.001) and relative expression of mitochondrial genes important for BAT thermogenesis, (K)Pgc-1α (F3,18 = 8.638, P < 0.001) and Elovl3 (F3,18 = 4.147, P < 0.05), were fully normalized by restoration of Pomc in 5-HT2CR neurons (Pomc5-HT2CR) in male mice. By contrast, Pomc5-HT2CR female mice display an increase in (H,J) BAT lipid content (F3,10 = 40.00, P < 0.0001) and a downregulation in (L)Pgc-1α(F3,12 = 8.941, P < 0.01) and Elovl3 (F3,18 = 8.941, P < 0.01) compared to littermate controls. Data expressed as arbitrary units and expression of target genes corrected to the geometric average of four housekeeping genes:18s, 36β4, Gapdh and βactin. Scale bar, 2000 μm *P < 0.05, **P < 0.01, ***P < 0.001 compared to all other genotypes, except in D, J and L compared to PomcWT and 5-HT2CRCre mice.
Figure 3
Figure 3
Subpopulation of Pomc differentially modulates body weight and adiposity in male and female mice. (A,B) Body weight (male, F3,20 = 114.35, P < 0.001; female F3,19 = 60.80, P < 0.001), (C, F, G) fat mass (male F3,20 = 9.43, P < 0.001; female F3,22 = 42.04, P < 0.001), (H–J) gonadal white adipocyte diameter (male F3,14 = 13.98, P < 0.001; female F3,13 = 11.87, P < 0.001) were increased in ARC Pomc null (PomcNEO) mice and normalized by restoration of Pomc in 5-HT2CR neurons (Pomc5-HT2CR) in male but not female mice. However, female PomcNEO mice still exhibited significantly greater body weight and fat mass, but not adipocyte size, compared with Pomc5-HT2CR mice. (D, E) Both male and female PomcNEO mice exhibited significantly greater lean mass compared to Pomc5-HT2CR mice and controls. Scale bar, 2000 μm *P < 0.05, **P < 0.01, ***P < 0.001 compared to control PomcWT and 5-HT2CRCRE siblings, except where noted in D, E, G and I.
Figure 4
Figure 4
Subpopulation of Pomc modulates insulin sensitivity in male and female mice. (A,B) Plasma insulin (male, F3,21 = 63.20, P < 0.0001; female F3,23 = 20.33, P < 0.0001) was increased in ARC Pomc null (PomcNEO) mice and normalized by restoration of Pomc in 5-HT2CR neurons (Pomc5-HT2CR). (C,D) Fasting blood glucose was not statistically different among genotypes (male, F3,15 = 0.70, P > 0.05; female F3,18 = 2.30, P > 0.05). Both male (E,F) and female (G,H)PomcNEO mice exhibited impaired responses in an insulin tolerance test compared with control littermates, which were normalized by restoration of Pomc in 5-HT2CR neurons (Pomc5-HT2CR); (E,G) Insulin tolerance tests (male, F3,104 = 33.09, P < 0.0001; female F3,102 = 24.39, P < 0.0001) and (F,H) their respective areas under the curve (AUC) (male, F3,18 = 18.06, P < 0.0001; female F3,17 = 6.56, P < 0.01). *P < 0.05, **P < 0.01, ***P < 0.001 compared to all other genotypes.
None

References

    1. World Health Organisation . 2014. Global Health Observatory (GHO) obesity situation and trends.
    1. Williams K.W., Elmquist J.K. From neuroanatomy to behavior: central integration of peripheral signals regulating feeding behavior. Nature Neuroscience. 2012 Oct;15(10):1350–1355. - PMC - PubMed
    1. Ellacott K.L., Cone R.D. The role of the central melanocortin system in the regulation of food intake and energy homeostasis: lessons from mouse models. Philosophical Transactions of the Royal Society B: Biological Sciences. 2006 Jul;361(1471):1265–1274. - PMC - PubMed
    1. Yeo G.S., Heisler L.K. Unraveling the brain regulation of appetite: lessons from genetics. Nature Neuroscience. 2012 Oct;15(10):1343–1349. - PubMed
    1. Ramachandrappa S., Farooqi I.S. Genetic approaches to understanding human obesity. Journal of Clinical Investigation. 2011 Jun;121(6):2080–2086. - PMC - PubMed