. 2016 Mar 15;11(3):e0149871.
doi: 10.1371/journal.pone.0149871. eCollection 2016.

A Single 17D Yellow Fever Vaccination Provides Lifelong Immunity; Characterization of Yellow-Fever-Specific Neutralizing Antibody and T-Cell Responses after Vaccination

Affiliations

A Single 17D Yellow Fever Vaccination Provides Lifelong Immunity; Characterization of Yellow-Fever-Specific Neutralizing Antibody and T-Cell Responses after Vaccination

Rosanne W Wieten et al. PLoS One. .

Abstract

Introduction: Prompted by recent amendments of Yellow Fever (YF) vaccination guidelines from boost to single vaccination strategy and the paucity of clinical data to support this adjustment, we used the profile of the YF-specific CD8+ T-cell subset profiles after primary vaccination and neutralizing antibodies as a proxy for potentially longer lasting immunity.

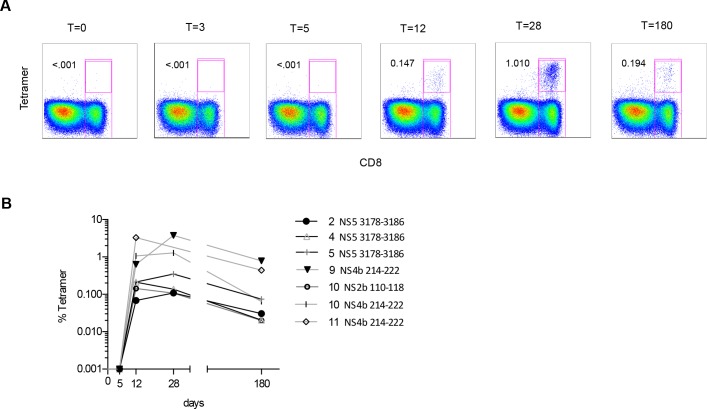
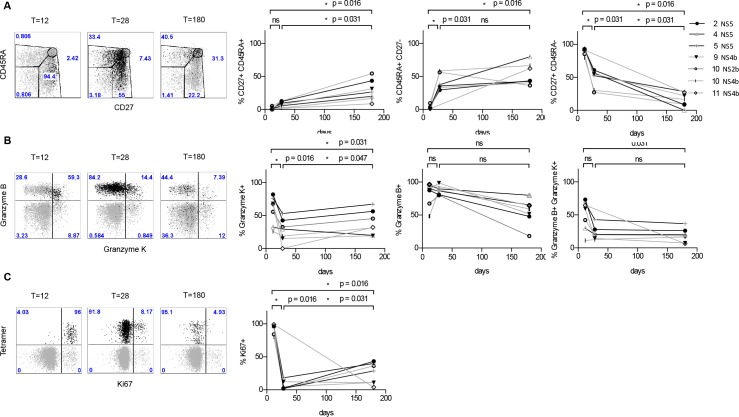
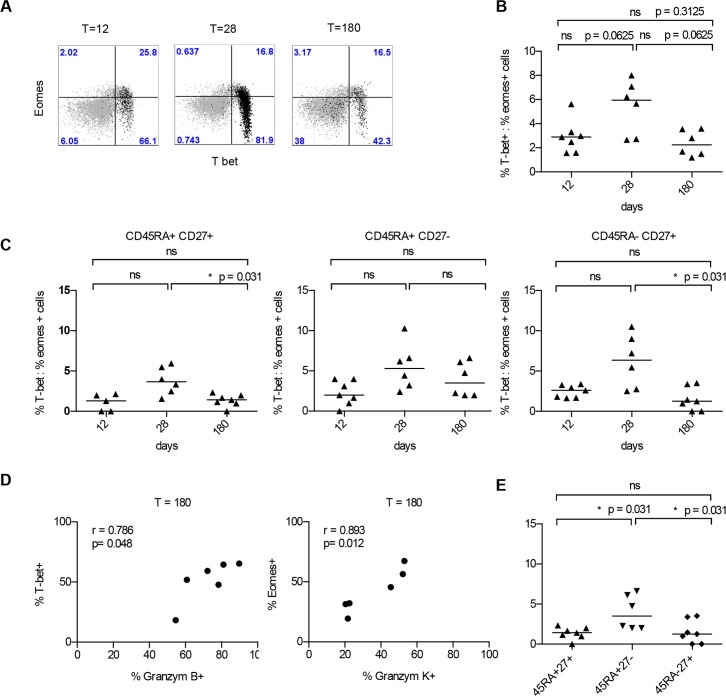
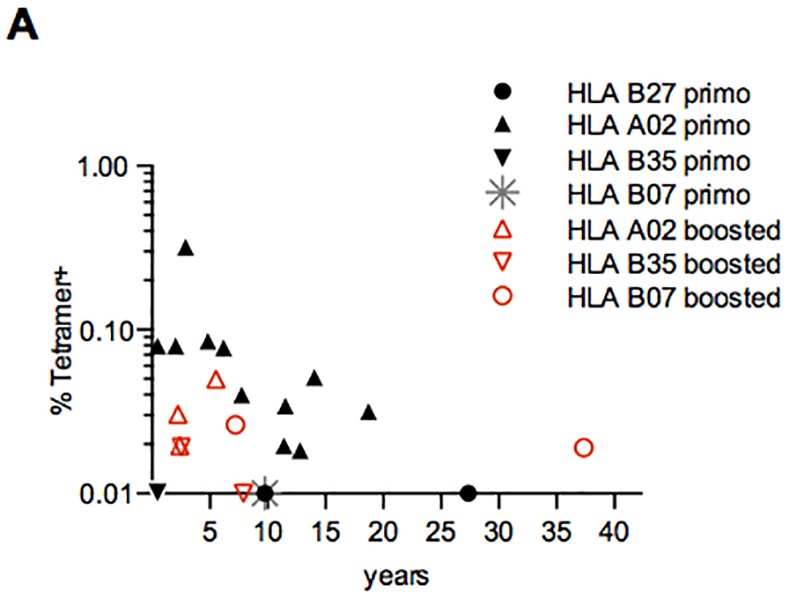
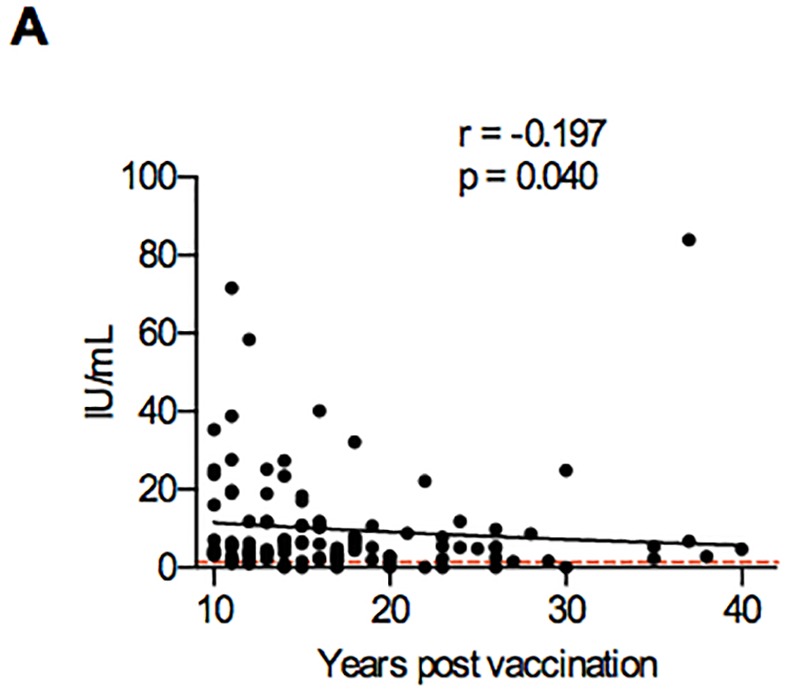
Methods and findings: PBMCs and serum were collected in six individuals on days 0, 3, 5, 12, 28 and 180, and in 99 individuals >10 years after YF-vaccination. Phenotypic characteristics of YF- tetramer+ CD8+ T-cells were determined using class I tetramers. Antibody responses were measured using a standardized plaque reduction neutralization test (PRNT). Also, characteristics of YF-tetramer positive CD8+ T-cells were compared between individuals who had received a primary- and a booster vaccination. YF-tetramer+ CD8+ T-cells were detectable on day 12 (median tetramer+ cells as percentage of CD8+ T-cells 0.2%, range 0.07-3.1%). On day 180, these cells were still present (median 0.06%, range 0.02-0.78%). The phenotype of YF-tetramer positive CD8+ T-cells shifted from acute phase effector cells on day 12, to late differentiated or effector memory phenotype (CD45RA-/+CD27-) on day 28. Two subsets of YF-tetramer positive T-cells (CD45RA+CD27- and CD45RA+CD27+) persisted until day 180. Within all phenotypic subsets, the T-bet: Eomes ratio tended to be high on day 28 after vaccination and shifted towards predominant Eomes expression on day 180 (median 6.0 (day 28) vs. 2.2 (day 180) p = 0.0625), suggestive of imprinting compatible with long-lived memory properties. YF-tetramer positive CD8+ T-cells were detectable up to 18 years post vaccination, YF-specific antibodies were detectable up to 40 years after single vaccination. Booster vaccination did not increase titers of YF-specific antibodies (mean 12.5 vs. 13.1, p = 0.583), nor induce frequencies or alter phenotypes of YF-tetramer+ CD8+ T-cells.

Conclusion: The presence of a functionally competent YF-specific memory T-cell pool 18 years and sufficient titers of neutralizing antibodies 35-40 years after first vaccination suggest that single vaccination may be sufficient to provide long-term immunity.


Conflict of interest statement

Competing Interests: The authors have declared that no competing interests exist.

Figures

Fig 1
Fig 1. Frequency of YF-tetramer positive CD8+ T-cells in 6 singly vaccinated individuals (one individual (# 10) had 2 tetramer compatible HLA types, therefore seven lines are depicted).
A. Dot plots of a representative donor B. Frequency of YF-tetramer+CD8+ T-cells expressed as percentage of YF-tetramer positive CD8+ T-cells directed against the NS2b, NS4b and NS5 epitopes in HLA-B35, HLA-A02 and HLA-B07 positive individuals at days 0, 3, 5, 12, 28 and 180 after vaccination.
Fig 2
Fig 2. Longitudinal analysis of the phenotype of YF-tetramer positive CD8+ T-cells on days 12, 28 and 180 in singly vaccinated individuals.
A Dot plots of a representative donor. Cells are gated on total CD8+ T-cells (in grey) and YF-tetramer positive cells (in black). B-D Summary of percentages of tetramer positive cells expressing CD45RA, CD27, granzyme K, granzyme B and Ki67 in 6 donors (1 donor had 2 matching HLA types). Comparisons were performed with a paired Wilcoxon Rank sum test. ns = not significant.
Fig 3
Fig 3. Longitudinal analysis of T-bet eomes expression in singly vaccinated individuals.
A Dot plots of a representative donor. Total CD8+ T-cells are depicted in grey and YF-tetramer positive CD8+ T-cells in black. B-C T-bet:Eomes ratios on days 12, 28 and 180 in CD8+ tetramer+ cells. D Correlation between Granzyme K and Eomes expression and Granzyme B and Tbet expression on days 12, 28 and 180 after vaccination. E. T-bet:Eomes ratios of YF-tetramer positive at T = 180 in different subsets. Comparisons were performed with a paired Wilcoxon Rank sum test. ns = not significant.
Fig 4
Fig 4. Percentages of YF-tetramer positive CD8+ T-cells over time in 13 healthy individuals that received a single vaccination of whom 11 were HLA A02, 2 HLA B27, 1 HLA B35 and 1 HLA B07 (2 donors had 2 HLA types compatible with tetramer reactivity).
Seven donors, 3 HLA A02, 2 HLA B07 and 2 HLA B35 had received a booster vaccination. On the x-axis the number of years since last vaccination until PBMC collection is shown. On the y-axis the percentage of YF-tetramer+ cells gated on total CD8+ T cells is shown. Black, closed symbols depict single vaccinated individuals; red, open symbols depict boosted individuals. In 4 donors tetramer+ CD8+ T cells could not be detected directly ex-vivo but only after in vitro expansion by culturing for 9 days in the presence of IL-2 and a YF-peptide pool. Analysis of the correlation between YF-tetramer+ CD8+ T cells of singly vaccinated HLA-A2+ donors and time since vaccination showed a significant negative correlation (r = -0.76, p = 0.0086, Spearman’s Rank Correlation Coefficient).
Fig 5
Fig 5. Correlation between YF-Antibody titers in 99 individuals that received a single vaccination and time since vaccination.
The y-axis shows the time since vaccination and the x-axis shows the YF-serum antibody titer. The correlation between serum titer and time since vaccination was calculated with Spearman’s Rank Correlation coefficient. As a reference, the red line depicts the YF antibody serum level threshold of protection (0.5 IU/mL).

References

    1. Monath TP, Cetron MS, Teuwen DE. Yellow fever vaccine In Plotkin SA, Orenstein WA, Offit PA, eds. Vaccines. 5th ed. Philadelphia: Saunders Elsevier; 2008. pp. 959–1056.
    1. Strategic Advisory Group of Experts, Background Paper on Yellow Fever Vaccine Geneva: WHO, 2013.
    1. Gotuzzo E, Yactayo S, Cordova E. Review article: Efficacy and duration of immunity after yellow fever vaccination: systematic review on the need for a booster every 10 years. Am J Trop Med Hyg. 2013;89: 434–444. 10.4269/ajtmh.13-0264 - DOI - PMC - PubMed
    1. Grobusch MP, Goorhuis A, Wieten RW, Verberk JDM, Jonker EFF, Genderen PJJ, et al. Yellow fever revaccination guidelines change- a decision too feverish? Clin Micr Inf. 2013;19: 885–886. - PubMed
    1. Patel D, Simons H. Yellow fever vaccination: Is one Dose always Enough? Travel Med Infect Dis, 2013;11: 266–273. 10.1016/j.tmaid.2013.08.007 - DOI - PubMed

MeSH terms

Substances