. 2016 Mar 14;29(3):339-353.
doi: 10.1016/j.ccell.2016.02.013.

PITPNC1 Recruits RAB1B to the Golgi Network to Drive Malignant Secretion

Affiliations

PITPNC1 Recruits RAB1B to the Golgi Network to Drive Malignant Secretion

Nils Halberg et al. Cancer Cell. .

Abstract

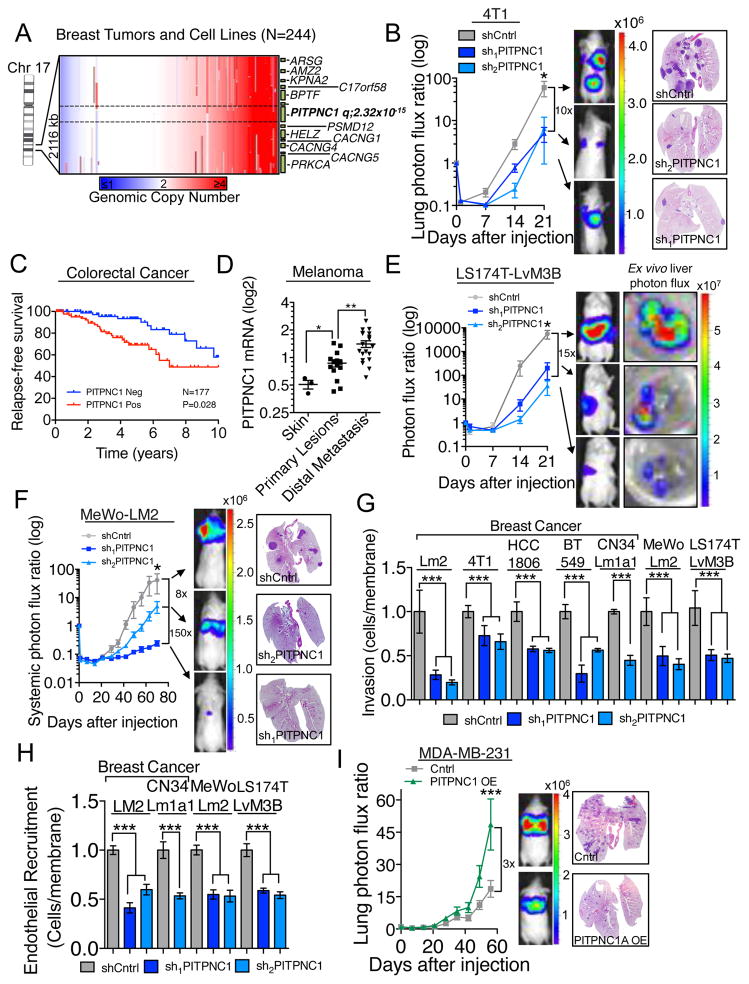
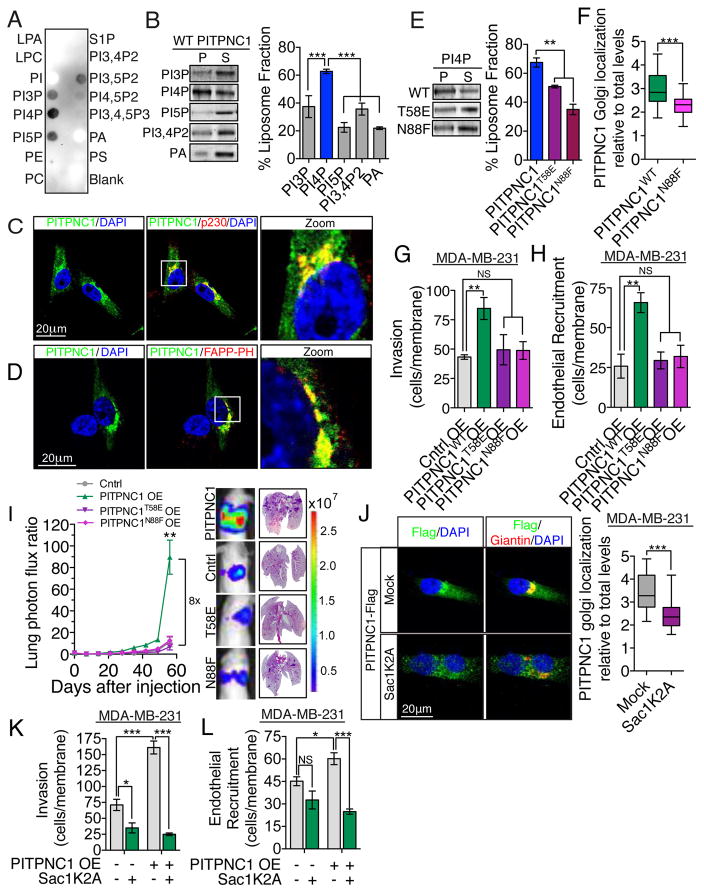
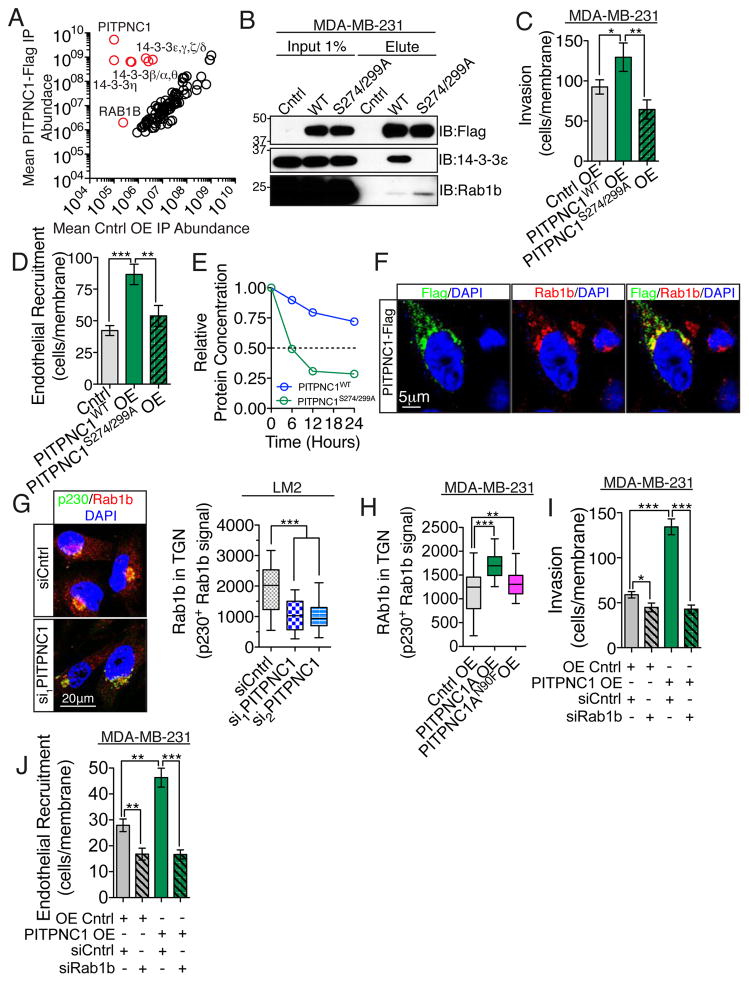
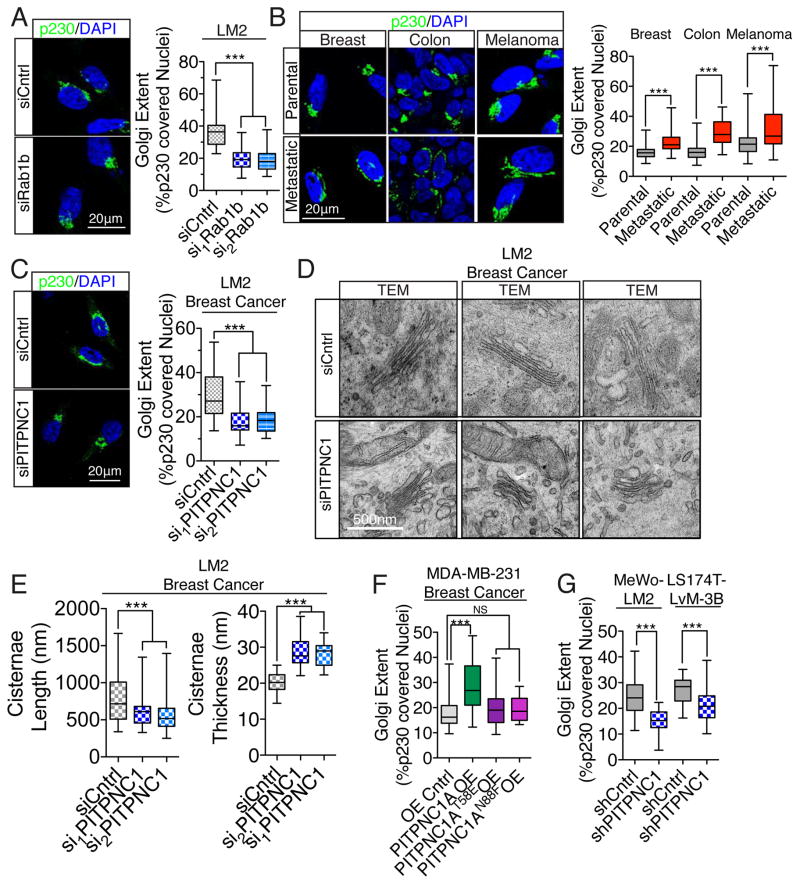
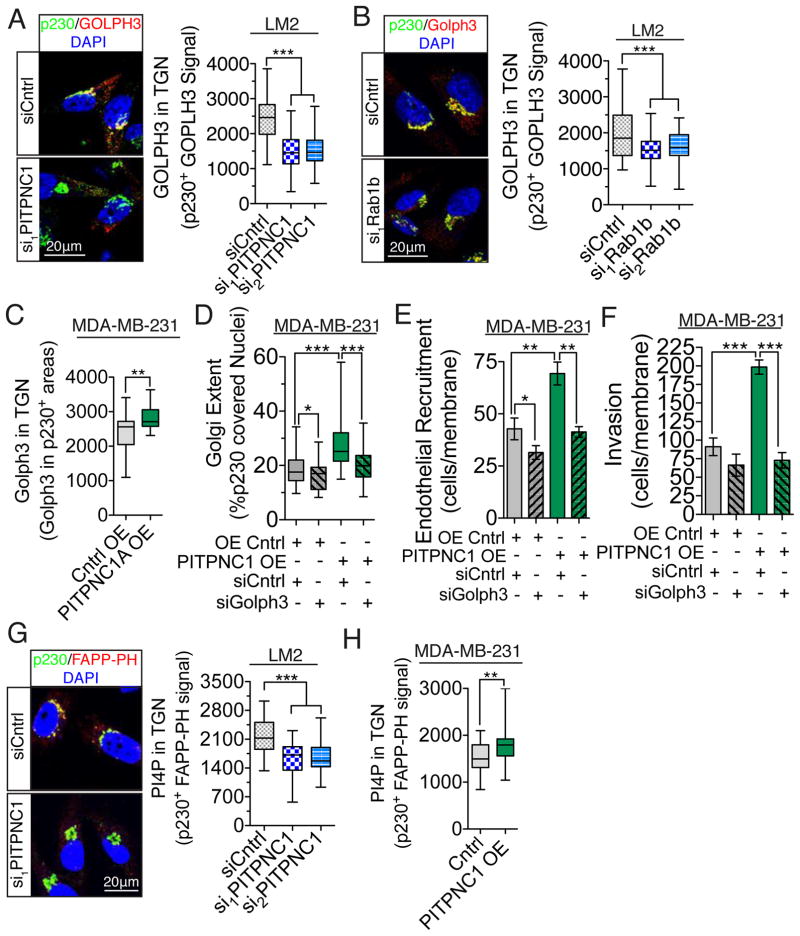
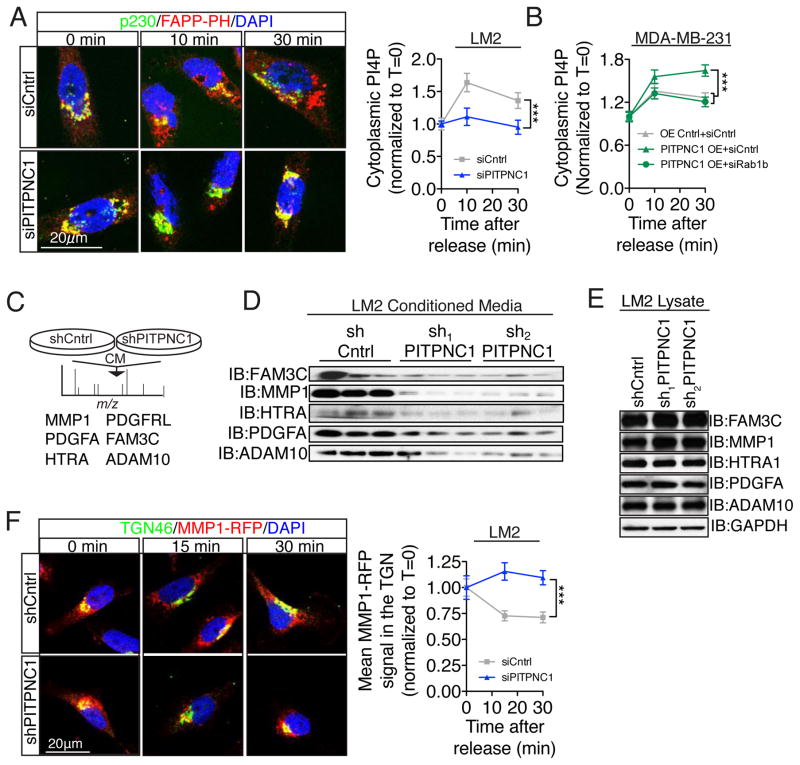
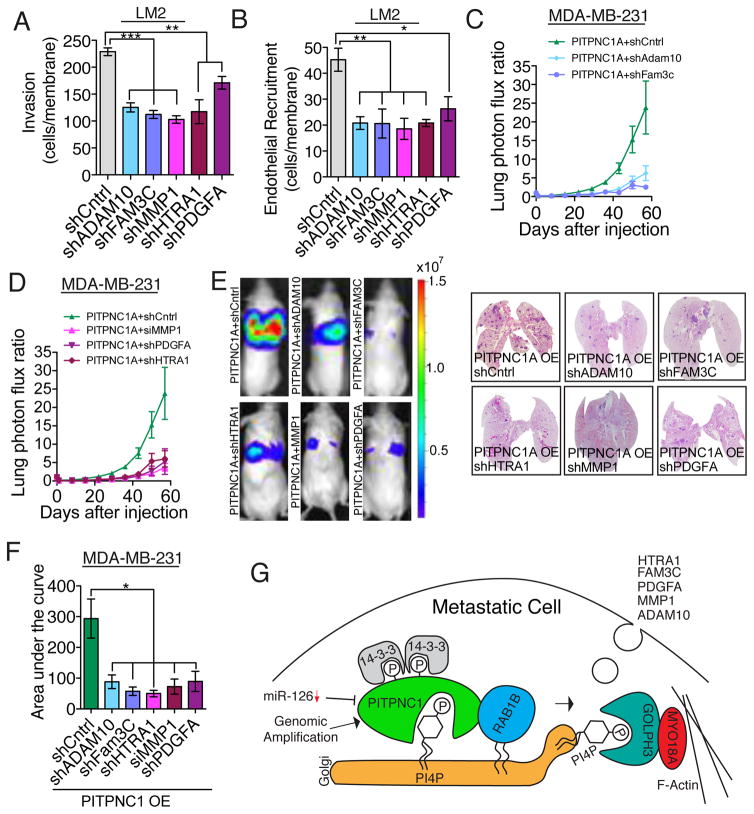
Enhanced secretion of tumorigenic effector proteins is a feature of malignant cells. The molecular mechanisms underlying this feature are poorly defined. We identify PITPNC1 as a gene amplified in a large fraction of human breast cancer and overexpressed in metastatic breast, melanoma, and colon cancers. Biochemical, molecular, and cell-biological studies reveal that PITPNC1 promotes malignant secretion by binding Golgi-resident PI4P and localizing RAB1B to the Golgi. RAB1B localization to the Golgi allows for the recruitment of GOLPH3, which facilitates Golgi extension and enhanced vesicular release. PITPNC1-mediated vesicular release drives metastasis by increasing the secretion of pro-invasive and pro-angiogenic mediators HTRA1, MMP1, FAM3C, PDGFA, and ADAM10. We establish PITPNC1 as a PI4P-binding protein that enhances vesicular secretion capacity in malignancy.


Figures

Figure 1
Figure 1. PITPNC1 promotes metastasis in multiple cancer types
(A) Genomic copy number analysis of 244 breast tumors and cell lines. Data from Tumorscape (Beroukhim et al., 2010). (B) Bioluminescence imaging plot of lung metastatic colonization by 50,000 4T1 breast cancer cells expressing a control or PITPNC1 targeting hairpins. n=5/group. Right, representative lung histology. (C) Kaplan-Meier curve representing metastasis-free survival cohort of colorectal patients (n=177) as a function of their primary tumor’s PITPNC1 expression levels (Data from GSE17536). Patients whose primary tumors’ PITPNC1 expressions levels were greater or lower than the median for the population were classified as PITPNC1 positive (red) or negative (blue), respectively. (D) PITPNC1 expression levels in normal skin, primary melanoma, and distal metastatic lesions of patients (n=37) (Haqq et al., 2005). (E) Bioluminescence imaging quantification of liver colonization by 80,000 LS174T-LvM3 colon cancer cells expressing short hairpins targeting PITPNC1 or a control hairpin. Right, luciferase signal from ex vivo livers at day 21. n=6/group. (F) Bioluminescence imaging plot of lung metastatic colonization by 40,000 MeWo control or PITPNC1 knockdown cells. n=5/group. Right, Lungs were extracted and stained by H&E. (G) Matrigel invasion by 50,000 LM2, 4T1, HCC-1806, BT549, CN34Lm1a1, MeWo-LM2 or LS174T-LvM3 cells expressing PITPNC1 or control targeting hairpins. Data normalized to control group values. n=4/group. (H) Trans-well recruitment of 80,000 human umbilical vein endothelial cells (HUVEC) by LM2, CN34LM1a1, MeWo-LM2 and LS174T-LvM3B cells. Data normalized to control group values. n=4/group. (I) Bioluminescence imaging plot and histology of lung metastatic colonization by 40,000 MDA-MB-231cells transduced with PITPNC1 over-expression or a control vector. n=6/group. Error bars represent S.E.M. See also Figure S1.
Figure 2
Figure 2. PITPNC1-mediated binding of PI4P drives metastasis
(A) Lipid overlay assay. Lipid-bound recombinant PITPNC1-GST was detected with anti-GST antibody. The experiment was repeated 3 times. (B) Vesicle pull-down assay of recombinant PITPNC1 using vesicles containing PE and PC in combination with PI3P, PI4P, PI5P, PI3,4P2 or PA respectively. n=3/group. (C) MDA-MB-231 cells expressing GFP-tagged PITPNC1 (green) co-stained with anti-p230 antibody (red) and 4′,6-diamidino-2-phenylindole (DAPI, blue) were analyzed by immunofluorescence microscopy. (D) MDA-MB-231 cells expressing GFP-tagged PITPNC1 (green) co-stained with DAPI (blue), and FAPP-PH for the detection of PI4P (red). (E) Vesicle pull-down assay of recombinant wild-type PITPNC1 and PITPNC1 containing the N58E or N88F lipid binding mutations. n=3/group. (F) MDA-MB-231 cells with stable expression of Flag-tagged wild-type or N88F mutant PITPNC1 co-stained with anti-Flag and anti-Giantin were analyzed by immunofluorescence microscopy. The intensity of Flag immunoreactivity in areas positive for Giantin was considered as the Golgi signal. The Golgi signal was normalized to total cellular levels to control for differences in expression levels between wild-type and N88F mutant PITPNC1. n=30/group. (G,H) MDA-MB-231 cells expressing PIPTNC1WT, PITPNC1T58E, PITPNC1N88F, or control vector were subjected to the matrigel invasion assay (G) and endothelial recruitment assay (H). n=4/group. (I) Bioluminescence imaging plot and lung histology of lung metastatic colonization by 40,000 MDA-MB-231 parental cells over-expressing PITPNC1, PITPNC1T58E, PITPNC1N88F or a control vector. n=6/group. H&E staining of representative lung sections. (J) MDA-MB-231 cells with stable expression of Flag-tagged wild-type PITPNC1 where transfected with mock or Sac1K2A and co-stained with anti-Flag and anti-Giantin. The intensity of Flag immunoreactivity in areas positive for Giantin was considered as the Golgi signal. The Golgi signal was normalized to total cellular levels. n=30/group. (K,L) MDA-MB-231 cells expressing PITPNC1 or control vector and cells expressing PITPNC1 and that was transfected with Sac1K2A were subjected to matrigel invasion assay (K) and the endothelial recruitment assay (L). n=4/group. For B,E,G,H, I, K,L error bars represent S.E.M. Box and whiskers plots represent the data in figure F and J with the upper and lower bars showing minimum and maximum data points See also Figure S2.
Figure 3
Figure 3. PITPNC1 forms a protein complex with 14-3-3 isoforms and RAB1B
(A) Lysates from MDA-MB-231 cells expressing Flag-tagged PITPNC1 or empty control vector were subjected to immunoprecipitation by anti-Flag beads. The eluate was trypsin digested in solution and the liquid chromatography-tandem mass spectrometry (LC-MS/MS) spectra were analyzed by label free quantification. Comparison of eluted proteins by the empty vector (horizontal axis) and PITPNC1-Flag (vertical axis) revealed PITPNC1, several 14-3-3 protein forms and RAB-1B to be significantly different (p<0.05) between the two samples. n=3/group. (B) Western blot analysis of input and immunoprecipitated Flag-tagged wild-type and S274/299A mutant forms of PITPNC1 from MDA-MB-213 cells using anti-Flag, anti-14-3-3ε and anti-RAB1B antibodies. (C,D) MDA-MB-231 cells expressing empty control vector, wild-type or S274/299A mutant PITPNC1 were subjected to invasion (C) and endothelial recruitment assays (D). n=4/group. (E) The half life of wild-type and S274/299 mutant PITPNC1 in MDA-MB-231 cells were determined by treating cells with 100ug/ml cyclohexamide over 24 hours and analyzing PITPNC1 abundance in cellular lysates by western blotting at the given time points. The experiment was repeated twice. (F) Immunofluorescence analysis of Flag-tagged PITPNC1 and endogenous RAB1B by staining with anti-Flag (green) and anti-RAB1B (red) in MDA-MB-231 breast cancer cells. (G) Golgi levels of endogenous RAB1B in LM2 breast cancer cells treated with control or two independent siRNAs targeting PITPNC1. Areas of the trans-Golgi compartment were defined by anti-p230 (green) immunoreactivity. Analysis of the anti-RAB1B signal intensity (red) in p230 positive areas defined the Golgi specific RAB1B signal. n=30/group. (H) MDA-MB-231 cells expressing an empty control vector, wild-type or N88F lipid binding mutant PITPNC1 were subjected to the same analysis as in (G). n=46/group. (I,J) Matrigel invasion (I) and endothelial recruitment assay (J) of MDA-MB-231 cells expressing empty control vector or PITPNC1. 48 hours prior to the experiments both the control and PITPNC1 overexpressing cells were transfected with control siRNA or siRNA targeting RAB1B. n=4/group. In figure C,D, I and J error bars represents S.E.M. Box and whiskers plots represent the data in figure G,H with the upper and lower bars showing minimum and maximum data points. See also Figure S3.
Figure 4
Figure 4. PITPNC1 promotes Golgi extension, a phenotype associated with metastasis
(A) LM2 cells transfected with either control or siRNAs targeting RAB1B for 24 hours were immuno-stained for p230 and DAPI. The Golgi extent was quantified as the fraction of the nucleus circumference that was covered by p230 positive Golgi signal. n= 40/group. (B) Highly metastatic derivates of the poorly metastatic MDA-MB-231 breast-, Ls714 colon-, and MeWo melanoma cancer cells developed previously (Minn et al., 2005; Pencheva et al., 2012) as well as their parental cell populations were analyzed for Golgi extent as in (A). n=40/group. (C) Golgi extent was analyzed by immunohistochemistry of LM2 breast cancer cells transfected with siRNAs targeting PITPNC1 or a control siRNA. n=50/group. (D) Golgi structure was analyzed in TEM images of LM2 cells transfected with siRNAs targeting PITPNC1 or a control siRNA. n=50/group. (E) Images from (D) were quantified for cisternae length and thickness. (F) Golgi extent was analyzed in MDA-MB-231 breast cells expressing empty control vector, wild-type, T58E or N88F mutant forms of PITPNC1. n=20/group. (G) Golgi extent analyzed in highly metastatic MeWo and Ls714 subpopulations expressing either a control or PITPNC1 targeting hairpin. n=25/group. Box and whiskers plots represent the data in figure A–G with the upper and lower bars showing minimum and maximum data points. See also Figure S4.
Figure 5
Figure 5. PITPNC1 facilitates recruitment of GOLPH3 to the Golgi
(A,B) LM2 cells transfected with either control siRNA or siRNAs targeting PITPNC1 (A) or RAB1B (B) were immunocytochemically stained for endogenous GOLPH3 and p230. GOLPH3 levels in the trans-Golgi were quantified as mean fluorescence intensity of GOLPH3 in p230-positive regions. n=40/group. (C) MDA-MB-231 cells expressing PITPNC1 or control vector were analyzed for trans-Golgi GOLPH3 levels as in (A). (D) Golgi extent analyzed in MDA-MB-231 cells transfected with GOLPH3 siRNA or control siRNA in the setting of PITPNC1 or control over-expression. n=30/group. (E,F) MDA-MB-231 cells were transfected with GOLPH3 siRNA or control siRNA in the setting of control or PITPNC1 over-expression and subjected to the invasion (G) and endothelial recruitment (H) assays. n=4/group. (G,H) LM2 cells transfected with siRNAs targeting PITPNC1 or a control siRNA (G) or MDA-MB-231 cells over-expressing PITPNC1 or control vector (H) were stained for PI4P using FAPP-PH domain (red), p230 (green) and DAPI (blue). PI4P levels in the trans-Golgi were quantified as mean fluorescence intensity of FAPP1-PH signal in p230-positive regions. n=50/group. Box and whiskers plots represent the data in figure A–D and G,H with the upper and lower bars showing minimum and maximum data points. In figure E and F, error bars represents S.E.M. See also Figure S5.
Figure 6
Figure 6. PITPNC1 facilitates malignant secretion
(A) Golgi exit assay analysis of LM2 cells transfected with control or PITPNC1-targeting siRNA. Following a 2 hour incubation at 23°C in the presence of 100μg/mL cyclohexamide, the cells were returned to 37°C and prepared for immunofluorescence for PI4P (FAPP-PH) and p230 analysis at time 0, 10, and 30 min. The abundance of PI4P containing vesicles released to the cytoplasm was determined by subtracting Golgi localized PI4P from the total cellular PI4P signal. All measurements of cytoplasmic PI4P were blinded. n=10/time-point/group. Significance test between groups was performed with Fisher’s method. (B) Golgi exit assay in MDA-MB-231 cells expressing either a control vector or PITPNC1 overexpressing cells that was transfected with control siRNA or RAB1B targeting siRNA. n=20/time point. Significance test between groups was performed with Fisher’s method. (C) Conditioned media was collected from SILAC-labeled LM2 control and PITPNC1 knockdown cells and subjected to liquid chromatography-mass spectrometry (LC-MS/MS) to identify proteins underrepresented in PITPNC1 knockdown media. (D) Western blot analysis for PDGFA, HTRA1, MMP1, ADAM10, and FAM3C in conditioned media from LM2 cells expressing short hairpins targeting PITPNC1 or a control hairpin. (E) Western blot analysis for PDGFA, HTRA1, MMP1, ADAM10, and FAM3C in cellular lysates from LM2 cells expressing short hairpins targeting PITPNC1 or a control hairpin. (F) Golgi exit assay of control and PITPNC1 knockdown LM2 cells tracking RFP-labeled MMP1. TGN localization was defined as TGN46-postive regions. n=25/timepoint/group. Significance test between groups was performed with Fisher’s method. Error bars represent S.E.M. See also Figure S6.
Figure 7
Figure 7. PITPNC1 promotes metastasis by facilitating secretion of pro-invasive and pro-angiogenic genes
(A,B) LM2 cells transduced with short hairpins targeting ADAM10, FAM3C, MMP1, HTRA1, PDGFA or a control, were subjected to the matrigel invasion assay (A) and endothelial recruitment assay (B). (C–E) Bioluminescence imaging plot of lung metastatic colonization by 40,000 MDA-MB-231 cells transduced with a control shRNA or shRNAs targeting ADAM10, FAM3C, HTRA, PDGFA or a siRNA targeting MMP1 in the setting of PITPNC1 over-expression. n=6/group. Right, representative lung bioluminescence images. (F) Area under the curve quantification of (C and D). (G) Model of PITPNC1-mediated metastatic secretion through recruitment of RAB1B to the trans-Golgi compartment of the cell. Error bars represent S.E.M. See also Figure S7.

References

    1. Anan K, Morisaki T, Katano M, Ikubo A, Kitsuki H, Uchiyama A, Kuroki S, Tanaka M, Torisu M. Vascular endothelial growth factor and platelet-derived growth factor are potential angiogenic and metastatic factors in human breast cancer. Surgery. 1996;119:333–339. - PubMed
    1. Balla T. Phosphoinositides: tiny lipids with giant impact on cell regulation. Physiol Rev. 2013;93:1019–1137. - PMC - PubMed
    1. Barr FA. Review series: Rab GTPases and membrane identity: causal or inconsequential? J Cell Biol. 2013;202:191–199. - PMC - PubMed
    1. Beroukhim R, Mermel CH, Porter D, Wei G, Raychaudhuri S, Donovan J, Barretina J, Boehm JS, Dobson J, Urashima M, et al. The landscape of somatic copy-number alteration across human cancers. Nature. 2010;463:899–905. - PMC - PubMed
    1. Bonazzi M, Spano S, Turacchio G, Cericola C, Valente C, Colanzi A, Kweon HS, Hsu VW, Polishchuck EV, Polishchuck RS, et al. CtBP3/BARS drives membrane fission in dynamin-independent transport pathways. Nat Cell Biol. 2005;7:570–580. - PubMed

Publication types