Quercetin-Rich Guava (Psidium guajava) Juice in Combination with Trehalose Reduces Autophagy, Apoptosis and Pyroptosis Formation in the Kidney and Pancreas of Type II Diabetic Rats
- PMID: 26978332
- PMCID: PMC6274302
- DOI: 10.3390/molecules21030334
Quercetin-Rich Guava (Psidium guajava) Juice in Combination with Trehalose Reduces Autophagy, Apoptosis and Pyroptosis Formation in the Kidney and Pancreas of Type II Diabetic Rats
Abstract
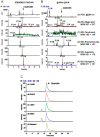
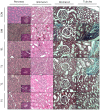
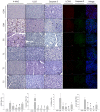
We explored whether the combination of anti-oxidant and anti-inflammatory guava (Psidium guajava) and trehalose treatment protects the kidney and pancreas against Type II diabetes (T2DM)-induced injury in rats. We measured the active component of guava juice by HPLC analysis. T2DM was induced in Wistar rats by intraperitoneal administration of nicotinamide and streptozotocin and combination with high fructose diets for 8 weeks. The rats fed with different dosages of guava juice in combination with or without trehalose for 4 weeks were evaluated the parameters including OGTT, plasma insulin, HbA1c, HOMA-IR (insulin resistance) and HOMA-β (β cell function and insulin secretion). We measured oxidative and inflammatory degrees by immunohistochemistry stain, fluorescent stain, and western blot and serum and kidney reactive oxygen species (ROS) by a chemiluminescence analyzer. High content of quercetin in the guava juice scavenged H2O2 and HOCl, whereas trehalose selectively reduced H2O2, not HOCl. T2DM affected the levels in OGTT, plasma insulin, HbA1c, HOMA-IR and HOMA-β, whereas these T2DM-altered parameters, except HbA1c, were significantly improved by guava and trehalose treatment. The levels of T2DM-enhanced renal ROS, 4-hydroxynonenal, caspase-3/apoptosis, LC3-B/autophagy and IL-1β/pyroptosis were significantly decreased by guava juice and trehalose. The combination with trehalose and guava juice protects the pancreas and kidney against T2DM-induced injury.
Keywords: Type II diabetes; apoptosis; autophagy; oxidative stress; pyroptosis; quercetin; trehalose.
Conflict of interest statement
There are no known conflicts of interest associated with this publication and there has been no significant financial support for this work that could have influenced its outcome.
Figures


Similar articles
-
Effect of guava (Psidium guajava Linn.) leaf soluble solids on glucose metabolism in type 2 diabetic rats.Phytother Res. 2008 Nov;22(11):1458-64. doi: 10.1002/ptr.2476. Phytother Res. 2008. PMID: 18819164
-
Protective Effects of Red Guava on Inflammation and Oxidative Stress in Streptozotocin-Induced Diabetic Mice.Molecules. 2015 Dec 12;20(12):22341-50. doi: 10.3390/molecules201219831. Molecules. 2015. PMID: 26703532 Free PMC article.
-
Renal protective effects of extracts from guava fruit (Psidium guajava L.) in diabetic mice.Plant Foods Hum Nutr. 2012 Sep;67(3):303-8. doi: 10.1007/s11130-012-0294-0. Plant Foods Hum Nutr. 2012. PMID: 22581156
-
Health Effects of Psidium guajava L. Leaves: An Overview of the Last Decade.Int J Mol Sci. 2017 Apr 24;18(4):897. doi: 10.3390/ijms18040897. Int J Mol Sci. 2017. PMID: 28441777 Free PMC article. Review.
-
Guava (Psidium guajava L.): a glorious plant with cancer preventive and therapeutic potential.Crit Rev Food Sci Nutr. 2023;63(2):192-223. doi: 10.1080/10408398.2021.1945531. Epub 2021 Jul 21. Crit Rev Food Sci Nutr. 2023. PMID: 34289769 Review.
Cited by
-
Targeting Pyroptosis: New Insights into the Treatment of Diabetic Microvascular Complications.Evid Based Complement Alternat Med. 2022 Sep 27;2022:5277673. doi: 10.1155/2022/5277673. eCollection 2022. Evid Based Complement Alternat Med. 2022. PMID: 36204129 Free PMC article. Review.
-
Review on the Anti-Hyperglycemic Potential of Psidium guajava and Seriphium plumosum L.Plants (Basel). 2024 Jun 11;13(12):1608. doi: 10.3390/plants13121608. Plants (Basel). 2024. PMID: 38931040 Free PMC article. Review.
-
The role of autophagy in the treatment of type II diabetes and its complications: a review.Front Endocrinol (Lausanne). 2023 Sep 21;14:1228045. doi: 10.3389/fendo.2023.1228045. eCollection 2023. Front Endocrinol (Lausanne). 2023. PMID: 37810881 Free PMC article. Review.
-
Caspase-1 regulate AngII-induced cardiomyocyte hypertrophy via upregulation of IL-1β.Biosci Rep. 2018 Feb 12;38(2):BSR20171438. doi: 10.1042/BSR20171438. Online ahead of print. Biosci Rep. 2018. PMID: 29440460 Free PMC article.
-
Natural products: potential treatments for cisplatin-induced nephrotoxicity.Acta Pharmacol Sin. 2021 Dec;42(12):1951-1969. doi: 10.1038/s41401-021-00620-9. Epub 2021 Mar 9. Acta Pharmacol Sin. 2021. PMID: 33750909 Free PMC article. Review.
References
-
- Sarah W., Gojka R., Anders G., Richard S., Hilary K. Global prevalence of diabetes. Diabetes Care. 2004;27:1047–1053. - PubMed
Publication types
MeSH terms
Substances
LinkOut - more resources
Full Text Sources
Other Literature Sources
Research Materials

