. 2016 Sep 1;22(17):4328-40.
doi: 10.1158/1078-0432.CCR-15-3026. Epub 2016 Mar 15.

Blocking Indolamine-2,3-Dioxygenase Rebound Immune Suppression Boosts Antitumor Effects of Radio-Immunotherapy in Murine Models and Spontaneous Canine Malignancies

Affiliations

Blocking Indolamine-2,3-Dioxygenase Rebound Immune Suppression Boosts Antitumor Effects of Radio-Immunotherapy in Murine Models and Spontaneous Canine Malignancies

Arta M Monjazeb et al. Clin Cancer Res. .

Abstract

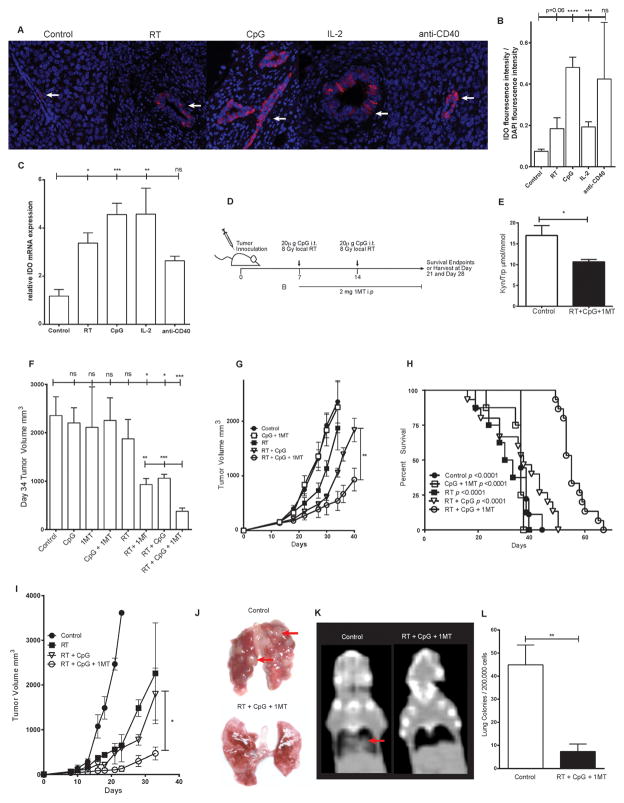
Purpose: Previous studies demonstrate that intratumoral CpG immunotherapy in combination with radiotherapy acts as an in-situ vaccine inducing antitumor immune responses capable of eradicating systemic disease. Unfortunately, most patients fail to respond. We hypothesized that immunotherapy can paradoxically upregulate immunosuppressive pathways, a phenomenon we term "rebound immune suppression," limiting clinical responses. We further hypothesized that the immunosuppressive enzyme indolamine-2,3-dioxygenase (IDO) is a mechanism of rebound immune suppression and that IDO blockade would improve immunotherapy efficacy.

Experimental design: We examined the efficacy and immunologic effects of a novel triple therapy consisting of local radiotherapy, intratumoral CpG, and systemic IDO blockade in murine models and a pilot canine clinical trial.

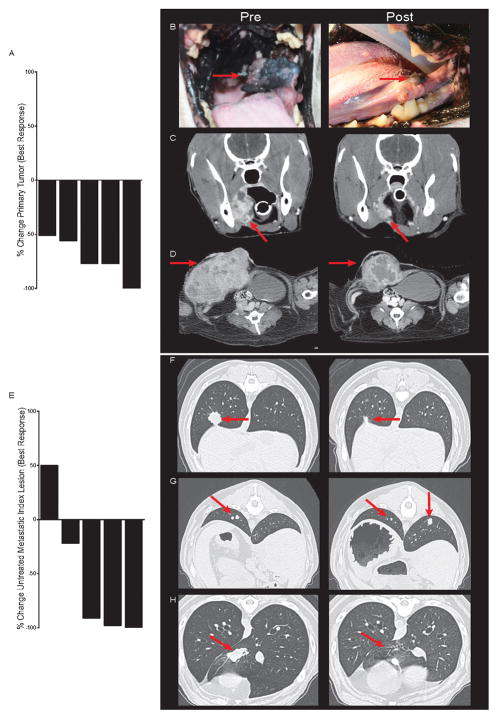
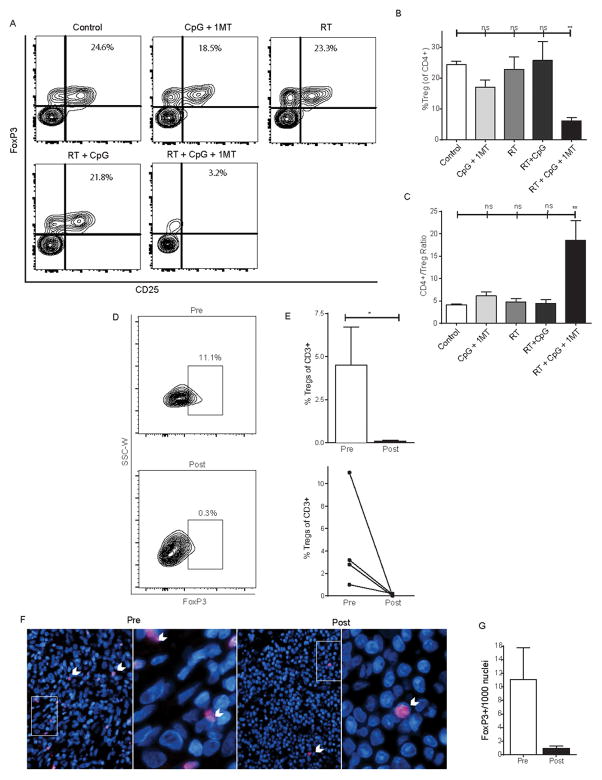
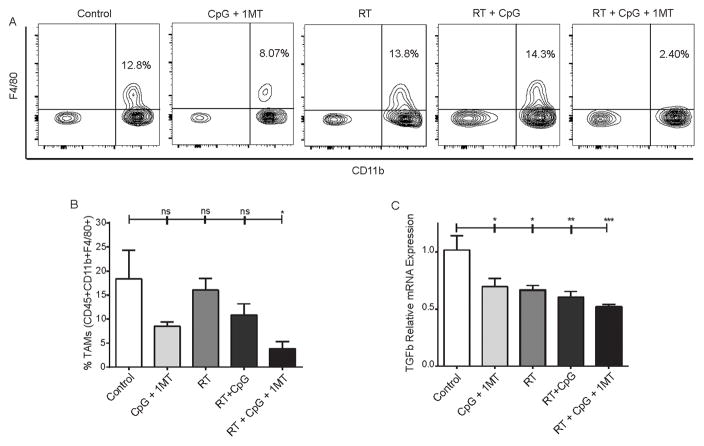
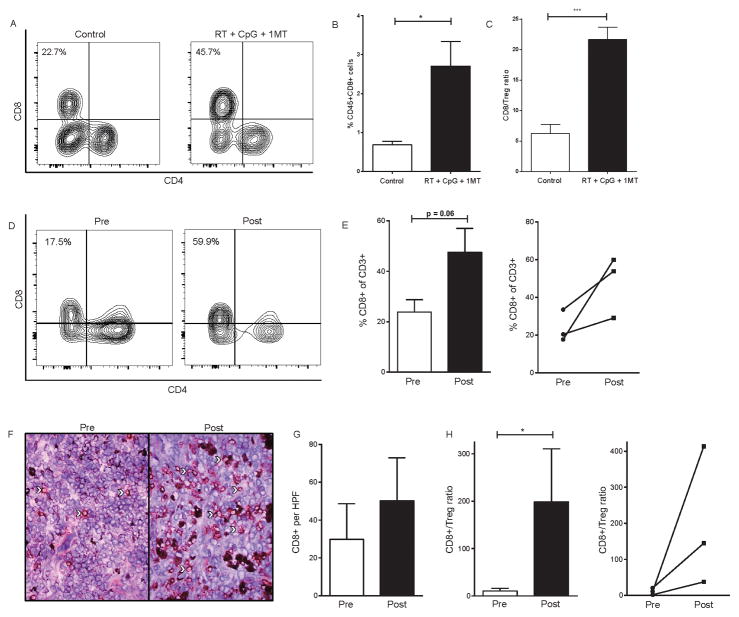
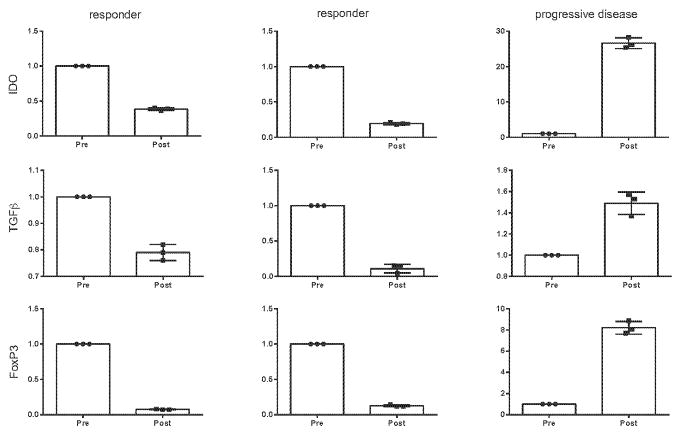
Results: In murine models, we observed marked increase in intratumoral IDO expression after treatment with radiotherapy, CpG, or other immunotherapies. The addition of IDO blockade to radiotherapy + CpG decreased IDO activity, reduced tumor growth, and reduced immunosuppressive factors, such as regulatory T cells in the tumor microenvironment. This triple combination induced systemic antitumor effects, decreasing metastases, and improving survival in a CD8(+) T-cell-dependent manner. We evaluated this novel triple therapy in a canine clinical trial, because spontaneous canine malignancies closely reflect human cancer. Mirroring our mouse studies, the therapy was well tolerated, reduced intratumoral immunosuppression, and induced robust systemic antitumor effects.

Conclusions: These results suggest that IDO maintains immune suppression in the tumor after therapy, and IDO blockade promotes a local antitumor immune response with systemic consequences. The efficacy and limited toxicity of this strategy are attractive for clinical translation. Clin Cancer Res; 22(17); 4328-40. ©2016 AACR.


Conflict of interest statement

The authors disclose no potential conflicts of interest

Figures

Figure 1
Figure 1. 1MT limits radiation + CpG induced IDO up-regulation and improves therapeutic efficacy
Expression of IDO in control or treated 4T1 tumors by immunofluorescence (A, B) or qPCR (C). IDO + cells stain bright pink and nuclei are counterstained by DAPI, white arrows indicate examples of positive staining cells. Balb/c mice bearing orthotopic 4T1 breast tumors or C57/BL6 mice bearing B16 melanoma tumors were treated as outlined in the schema (D). IDO enzymatic activity in 4T1 tumor bearing mice as measured by serum kynurenine to tryptophan ratio (E). 4T1 tumor growth (F,G) and tumor bearing mouse survival (H). B16 melanoma tumor growth (I). Lung metastases in orthotopic 4T1 bearing mice as assessed by gross examination (J), computed tomography (K), and lung colony forming assay (L). Red arrows indicate examples of lung metastases. n=3–4 mice per group for correlative studies and n=6–10 mice per group for tumor growth studies and survival studies. Bar graphs represent mean +/− standard error of mean. Results analyzed by one-way ANOVA, student’s t-test, or kaplan-meier analysis between the indicated groups (* p < 0.05, ** p < 0.01, *** p < 0.001).
Figure 2
Figure 2. Efficacy of radiation + CpG + 1MT in a canine clinical trial
Therapeutic response of local irradiated tumors (A-D) and untreated metastatic lesions (E–H) in a canine clinical trial are depicted. Waterfall plot of best response at the primary treated tumor (A). Photographs (B) and computed tomography (C) depicting response of a melanoma of the buccal mucosa. Computed tomography depicting response of an abdominal wall sarcoma (D). Waterfall plot of best response at untreated metastatic index lesions (E). Computed tomography demonstrating a partial response (F), mixed response (G), and complete response (H) of metastatic pulmonary index lesions.
Figure 3
Figure 3. Radiation + CpG + 1MT reduces intratumoral regulatory CD4+ T-cells in mice and canines
Day 28 levels of tumor infiltrating regulatory CD4+ T-cells as assessed by flow cytometry and immunofluorescence in 4T1 bearing mice (A–C) or canine patients (D–G) treated with RT + CpG + 1MT. Representative flow cytometry contour plots demonstrating staining of intratumoral CD4+ cells for FoxP3 and CD25 (A). Flow cytometry data represented as a bar graph expressed as %Treg (CD4+,CD25+,FoxP3+) of CD4+ cells (B). Bar graph representation of CD4+ to Treg ratio as measured by flow cytometry (C). Representative flow cytometry plots demonstrating staining of canine intratumoral CD4+ cells for FoxP3 pre- and post- RT + CpG + 1MT therapy (D). Bar graph representation of intratumoral Tregs pre- and post-therapy expressed as a percentage of CD3+ cells in four canine patients as assessed by flow cytometry (E). Line graph demonstrates changes in Treg levels in individual patients as assessed by flow cytometry (E). Immuno-fluorescent staining of canine tumor samples for FoxP3 (F). FoxP3 + cells stain bright pink and nuclei are counterstained by DAPI, white arrows point out examples of positive staining cells. Bar graph quantification of intratumoral FoxP3 positive cells (G). n=34 mice per group and four canines patients. Bar graphs represent mean +/− standard error of mean. Results analyzed by one-way ANOVA or student’s t-test between the indicated groups (* p < 0.05, ** p < 0.01).
Figure 4
Figure 4. Radiation + CpG + 1MT reduces tumor associated macrophages
Levels of intratumoral CD45+CD11b+F4/80+ macrophages as assessed by flow cytometry in 4T1 bearing mice (A–B). Representative flow cytometry contour plots demonstrating staining of intratumoral CD45+ cells for F4/80 and CD11b (A). Flow cytometry data represented as a bar graph expressed as % tumor associated macrophages of all CD45+ cells (B). Bar graph representation of intratumoral transforming growth factor beta mRNA as assessed by qPCR (C). n=3–4 mice per group. Bar graphs represent mean +/− standard error of mean. Results analyzed by one-way ANOVA between the indicated groups (* p < 0.05, ** p < 0.01, *** p < 0.001, **** p < 0.0001).
Figure 5
Figure 5. Radiation + CpG + 1MT increases tumor infiltrating CD8+ T cells in mice and canines
Representative flow cytometry contour plots demonstrating staining of tumor infiltrating CD45+CD3+ cells for CD8 and CD4 (A). Flow cytometry data of tumor infiltrating CD8+ T-cells represented as a bar graph expressed as % CD8+ cells of all CD45+ cells (B). CD8+ T cell to regulatory T cell ratio as determined by flow cytometry (C). Levels of tumor infiltrating CD8+ T cells as assessed by flow cytometry in canine tumors (D-E). Representative flow cytometry contour plots demonstrating staining of canine intratumoral CD8+ and CD4+ T cells pre- and post- RT + CpG + 1MT therapy (D). Bar graph representation of intratumoral CD8+ T cells expressed as a percentage of CD3+ cells in three canine patients as assessed by flow cytometry (E). Line graph demonstrates changes in Treg levels in individual patients as assessed by flow cytometry (E). Immunohistochemical staining with tumor infiltrating CD8+ T-cells stained in red, white arrows point out examples of positive staining cells (F). Bar graph quantification of intratumoral CD8 positive cells (G). CD8+ T cell to regulatory T cell ratio as determined by flow cytometry (H). Line graph demonstrates changes in CD8+ T cell to regulatory T cell ratio in individual patients pre- to post-treatment (H). n=3–4 mice per group and three canines patients. Bar graphs represent mean +/− standard error of mean. Results analyzed by student’s t-test (* p < 0.05, ** p < 0.01, *** p < 0.001, **** p < 0.0001).
Figure 6
Figure 6. Intratumoral expression of immunosuppressive molecules as a gene signature of systemic anti-tumor immune response in canines treated with radiation + CpG + 1MT
Sufficient pre- and post-therapy tumor tissue was available for further analysis in three canines: two responders and one with progressive disease. Expression of the immunosuppressive molecules IDO, TGF beta, and FoxP3 was assessed by qPCR and results are expressed relative mRNA expression of technical triplicates. Bar graphs represent mean +/− standard error of mean.

References

    1. Brahmer JR, Tykodi SS, Chow LQ, Hwu WJ, Topalian SL, Hwu P, et al. Safety and activity of anti-PD-L1 antibody in patients with advanced cancer. N Engl J Med. 2012;366:2455–2465. - PMC - PubMed
    1. Hodi FS, O'Day SJ, McDermott DF, Weber RW, Sosman JA, Haanen JB, et al. Improved survival with ipilimumab in patients with metastatic melanoma. N Engl J Med. 2010;363:711–723. - PMC - PubMed
    1. Topalian SL, Hodi FS, Brahmer JR, Gettinger SN, Smith DC, McDermott DF, et al. Safety, activity, and immune correlates of anti-PD-1 antibody in cancer. N Engl J Med. 2012;366:2443–2454. - PMC - PubMed
    1. Formenti SC, Demaria S. Systemic effects of local radiotherapy. Lancet Oncol. 2009;10:718–726. - PMC - PubMed
    1. Milas L, Mason KA, Ariga H, Hunter N, Neal R, Valdecanas D, et al. CpG oligodeoxynucleotide enhances tumor response to radiation. Cancer Res. 2004;64:5074–5077. - PubMed

MeSH terms

Substances