. 2016 Aug 15;22(16):4105-18.
doi: 10.1158/1078-0432.CCR-15-2624. Epub 2016 Mar 15.

Identification of Mithramycin Analogues with Improved Targeting of the EWS-FLI1 Transcription Factor

Affiliations

Identification of Mithramycin Analogues with Improved Targeting of the EWS-FLI1 Transcription Factor

Christy L Osgood et al. Clin Cancer Res. .

Abstract

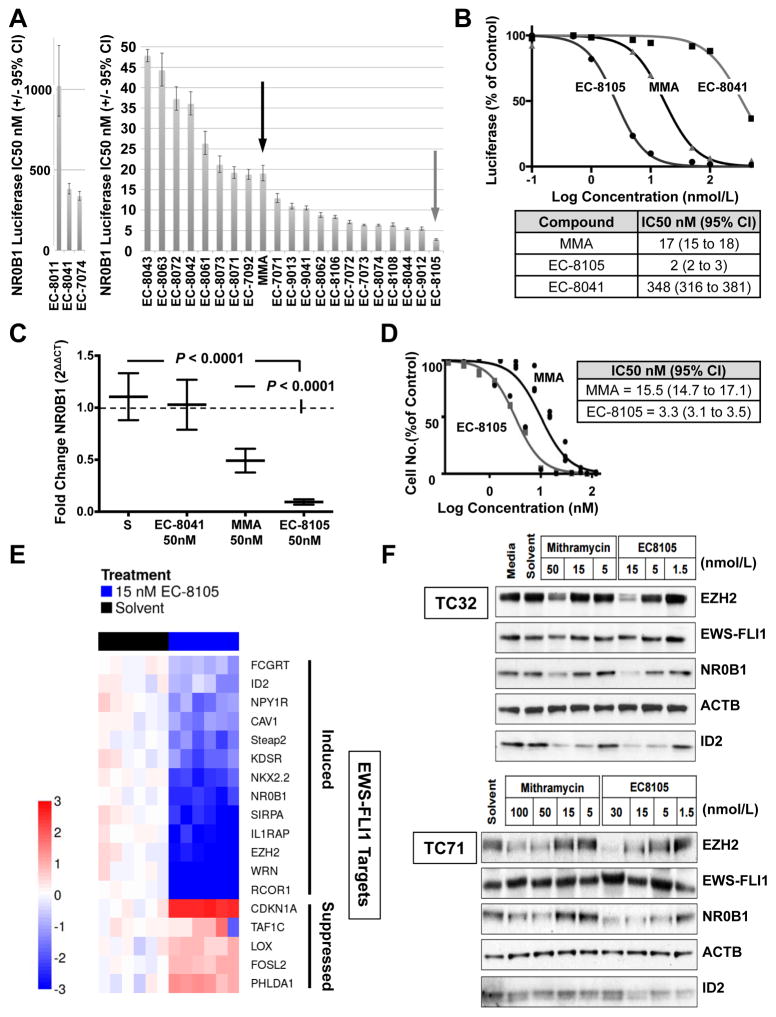
Purpose: The goal of this study was to identify second-generation mithramycin analogues that better target the EWS-FLI1 transcription factor for Ewing sarcoma. We previously established mithramycin as an EWS-FLI1 inhibitor, but the compound's toxicity prevented its use at effective concentrations in patients.

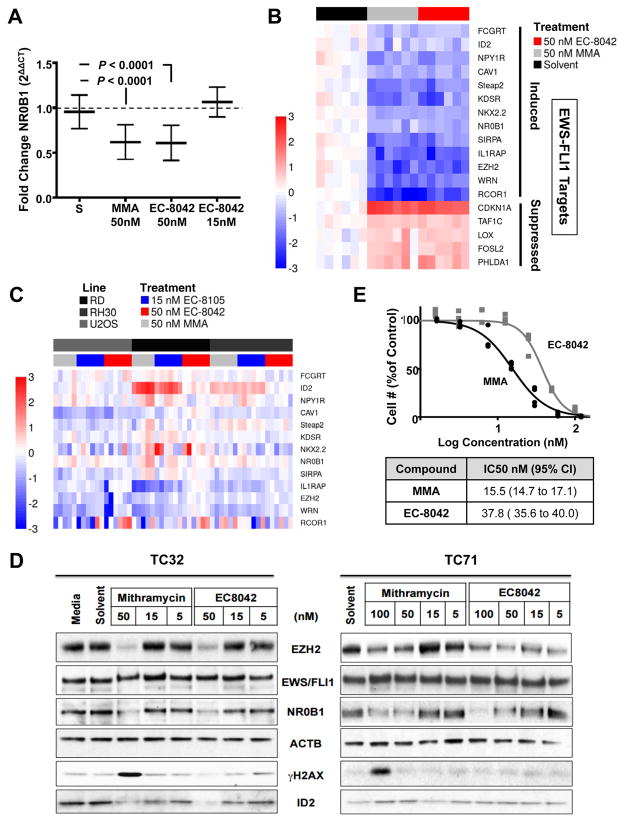
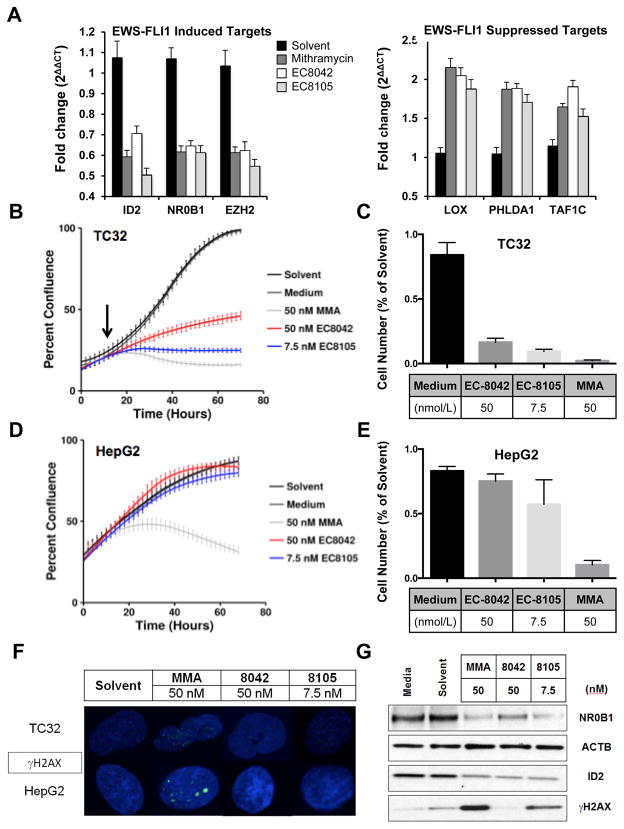
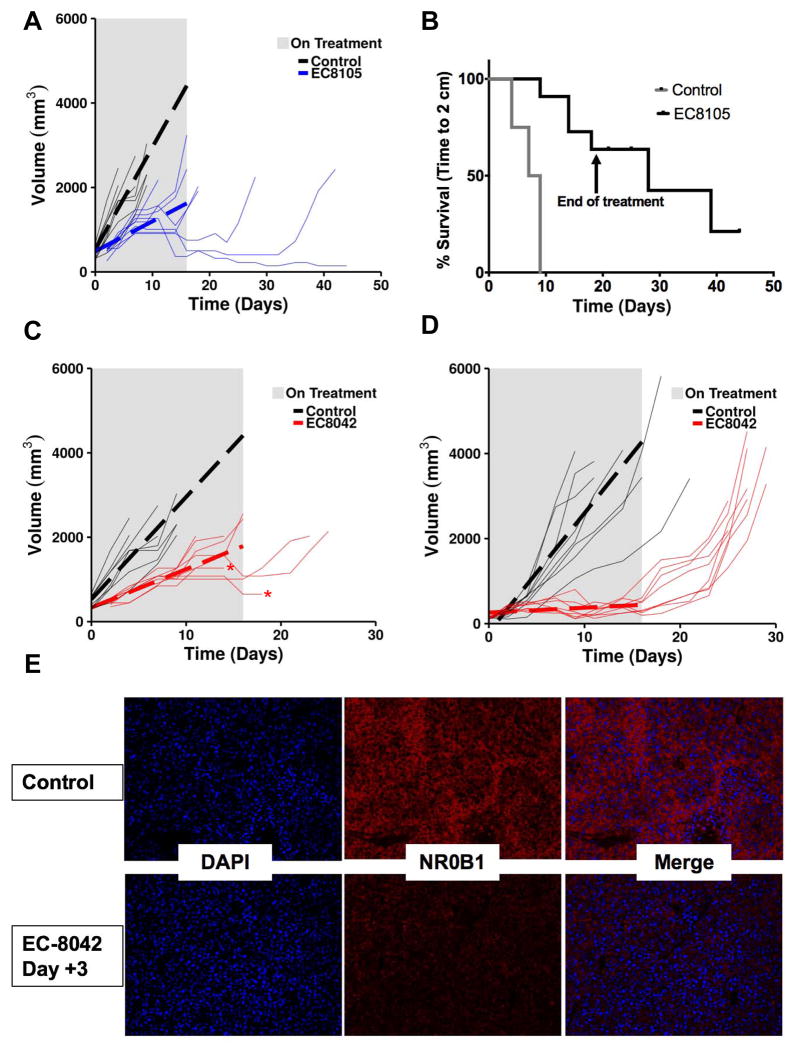
Experimental design: We screened a panel of mithralogs to establish their ability to inhibit EWS-FLI1 in Ewing sarcoma. We compared the IC50 with the MTD established in mice to determine the relationship between efficacy and toxicity. We confirmed the suppression of EWS-FLI1 at the promoter, mRNA, gene signature, and protein levels. We established an improved therapeutic window by using time-lapse microscopy to model the effects on cellular proliferation in Ewing sarcoma cells relative to HepG2 control cells. Finally, we established an improved therapeutic window using a xenograft model of Ewing sarcoma.

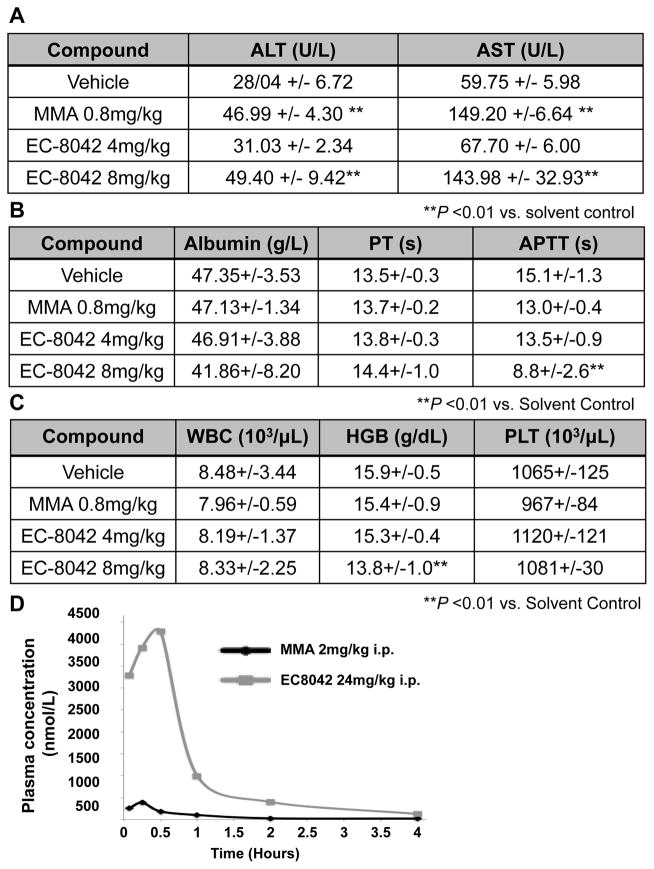
Results: EC-8105 was found to be the most potent analogue and was able to suppress EWS-FLI1 activity at concentrations nontoxic to other cell types. EC-8042 was substantially less toxic than mithramycin in multiple species but maintained suppression of EWS-FLI1 at similar concentrations. Both compounds markedly suppressed Ewing sarcoma xenograft growth and inhibited EWS-FLI1 in vivo

Conclusions: These results provide a basis for the continued development of EC-8042 and EC-8105 as EWS-FLI1 inhibitors for the clinic. Clin Cancer Res; 22(16); 4105-18. ©2016 AACR.


Figures

Figure 1
Figure 1. EC-8105 is a more potent EWS-FLI1 transcription factor inhibitor than mithramycin
A, IC50 of suppression of EWS-FLI1 activity for a panel of mithramycin (MMA, black arrow) and mithramycin analogs including EC-8105 (grey arrow); graphs separated due to disparity in scale. B, Dose–response curve and corresponding IC50 of suppression of EWS-FLI1 activity as determined by nonlinear regression for EC-8105 relative to EC-8041 (non-DNA binding) and mithramycin (MMA). C, Mean (±SEM) fold change in NR0B1 expression as a function of GAPDH (2ΔΔCT) for a 12 hr treatment with solvent control (S) or compound. D, Cell viability IC50 (nmol/L) for EC-8105 and mithramycin at 48 h of treatment as determined by nonlinear regression from 3 independent experiments. E, Heat map of ΔΔCt score as a measure of induction (red) or repression (blue) of expression for EWS-FLI1-induced (top) and repressed (bottom) targets as a function of GAPDH for EC-8105 treatment at 15 nM for 18 h or 3 h, respectively. F, Western blots from TC32 and TC71 cell lines showing the effect of mithramycin or EC-8105 treatment for 18 hours at the indicated concentrations (nmol/L) on EWS/FLI1 and downstream target expression (EZH2, NR0B1, and ID2), with ACTB as a loading control. All qPCR data is the average of 3 independent experiments and all other results are representative of 3 independent experiments.
Figure 2
Figure 2. EC-8042 is a less toxic mithramycin analog
EC-8042 had a less pronounced effect on A, liver enzymes; B, liver synthetic function; and C, hematopoiesis in rats after doses of 0.8 mg/kg IV of mithramycin relative to (4 mg/kg) or (8 mg/kg) of EC-8042. D EC-8042 exhibited a higher Cmax and delayed clearance relative to mithramycin (MMA) in mice.
Figure 3
Figure 3. EC-8042 achieves suppression of EWS-FLI1 comparable to that of mithramycin
A, Mean (±SEM) fold change in NR0B1 expression as measured by qPCR as a function of GAPDH (2ΔΔCT) for treatment for 18 h with solvent control (S) or drugs as shown. B, Heat map of ΔΔCt score as a measure of induction (red) or repression (blue) of expression for EWS-FLI1-induced (top) and repressed (bottom) targets as a function of GAPDH for EC-8042 treatment at 15 nM for 18 h or 3 h, respectively C, Heat map of ΔΔCt score as a measure of induction (red) or repression (blue) of expression for EWS-FLI1 gene signature in control cell lines (U2OS, osteosarcoma, RD, embryonal rhabdomyosarcoma and RH30 alveolar rhabdomyosarcoma) following treatment for 18 hours with 50 nmol/L mithramycin (MMA), 50 nmol/L EC-8042 or 15 nmol/L EC-8105 for 18 h. D, Immunoblot from TC32 and TC71 cell lines showing the effect of mithramycin or EC-8042 treatment on EWS-FLI1 downstream target expression (EZH2, NR0B1, and ID2) and γH2AX phosphorylation with ACTB as a loading control. E, Dose response curves of cell number at 48 h of treatment. All qPCR data is the average of 3 independent experiments and all other results are representative of 3 independent experiments.
Figure 4
Figure 4. EC-8105 and EC-8042 are less toxic to immortalized hepatocytes at concentrations that suppress EWS-FLI1 in Ewing sarcoma cells
A, Mean fold change in expression of EWS-FLI1-induced targets or -repressed targets as a function of GAPDH (2ΔΔCT) after treatment with 50 nmol/L mithramycin, 50 nmol/L EC-8042 or 7.5 nmol/L EC-8105 for 12 h. qPCR data is the average of 3 independent experiments. B, Time-lapse microscopy demonstrating suppression of TC32 Ewing sarcoma cell proliferation over time following drug addition and EWS-FLI1 target suppression (black arrow) for 50 nmol/L mithramycin, 50 nmol/L EC-8042 or 7.5 nmol/L EC-8105 C, End point MTS assay confirming effect on cell viability in TC32 cells. D, Time-lapse microscopy demonstrating suppression of HepG2 proliferation with 50 nmol/L mithramycin but not 50 nmol/L EC-8042 or 7.5 nmol/L EC-8105. E, End point MTS assay confirming effect on cell viability in HepG2 cells. F, Confocal microscopy and G, western blot analysis demonstrates induction of DNA damage as measured by the phosphorylation of γH2AX at concentrations that suppress expression of the EWS-FLI1 target gene NR0B1 only with 50 nmol/L mithramycin and not with 50 nmol/L EC-8042 or marginally with 7.5 nmol/L EC-8105.
Figure 5
Figure 5. EC-8105 and EC-8042 suppress Ewing sarcoma xenograft growth
A, Prediction plot showing mean tumor volume (dotted line) while on treatment (grey rectangle) and tumor growth for individual mice (thin lines) bearing a TC71 xenograft treated with 1.5 mg/kg of EC-8105 IV on a Q3D X 8 schedule. B, Survival curves for mice bearing the TC71 xenografts showing time to 2 cm in control (grey) and mice treated with 1.5 mg/kg of EC-8105 IV on a Q3D X 8 schedule (black). C, Prediction plots showing mean tumor volume (dotted line) while on treatment (grey rectangle) and tumor growth for individual mice (thin lines) bearing a TC71 xenograft treated with 24 mg/kg of EC-8042 IV Q3D X 8 or D, 24 mg/kg IP on a M, W, F X 8 schedule. Arrows indicate final day of treatment. E. Representative tissue section showing suppression of NR0B1 expression by immunofluorescence following treatment with IP EC-8042.

References

    1. Esiashvili N, Goodman M, Marcus RB., Jr Changes in incidence and survival of Ewing sarcoma patients over the past 3 decades: Surveillance Epidemiology and End Results data. J Pediatr Hematol Oncol. 2008;30:425–30. - PubMed
    1. Grier HE, Krailo MD, Tarbell NJ, Link MP, Fryer CJ, Pritchard DJ, et al. Addition of ifosfamide and etoposide to standard chemotherapy for Ewing’s sarcoma and primitive neuroectodermal tumor of bone. N Engl J Med. 2003;348:694–701. - PubMed
    1. Womer RB, West DC, Krailo MD, Dickman PS, Pawel BR, Grier HE, et al. Randomized controlled trial of interval-compressed chemotherapy for the treatment of localized Ewing sarcoma: a report from the Children’s Oncology Group. J Clin Oncol. 2012;30:4148–54. - PMC - PubMed
    1. Miser JS, Goldsby RE, Chen Z, Krailo MD, Tarbell NJ, Link MP, et al. Treatment of metastatic Ewing sarcoma/primitive neuroectodermal tumor of bone: evaluation of increasing the dose intensity of chemotherapy--a report from the Children’s Oncology Group. Pediatr Blood Cancer. 2007;49:894–900. - PubMed
    1. Hamilton SN, Carlson R, Hasan H, Rassekh SR, Goddard K. Long-term Outcomes and Complications in Pediatric Ewing Sarcoma. Am J Clin Oncol. 2015 - PubMed

MeSH terms