. 2016 Mar 16:7:10880.
doi: 10.1038/ncomms10880.

A phosphotyrosine switch regulates organic cation transporters

Affiliations

A phosphotyrosine switch regulates organic cation transporters

Jason A Sprowl et al. Nat Commun. .

Abstract

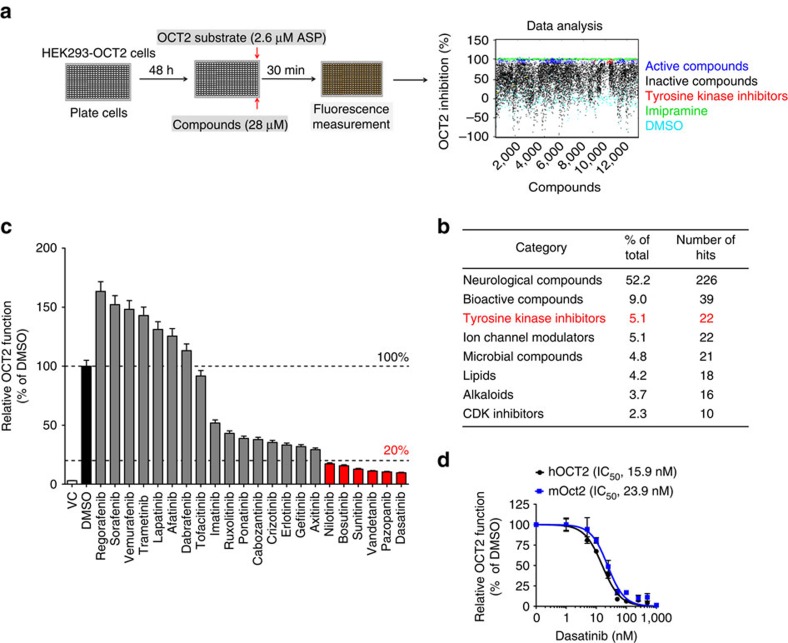
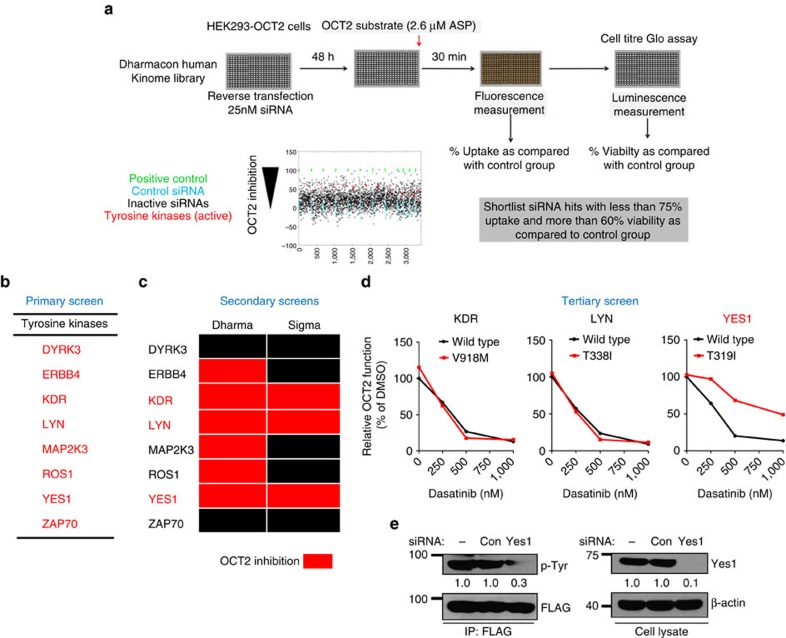
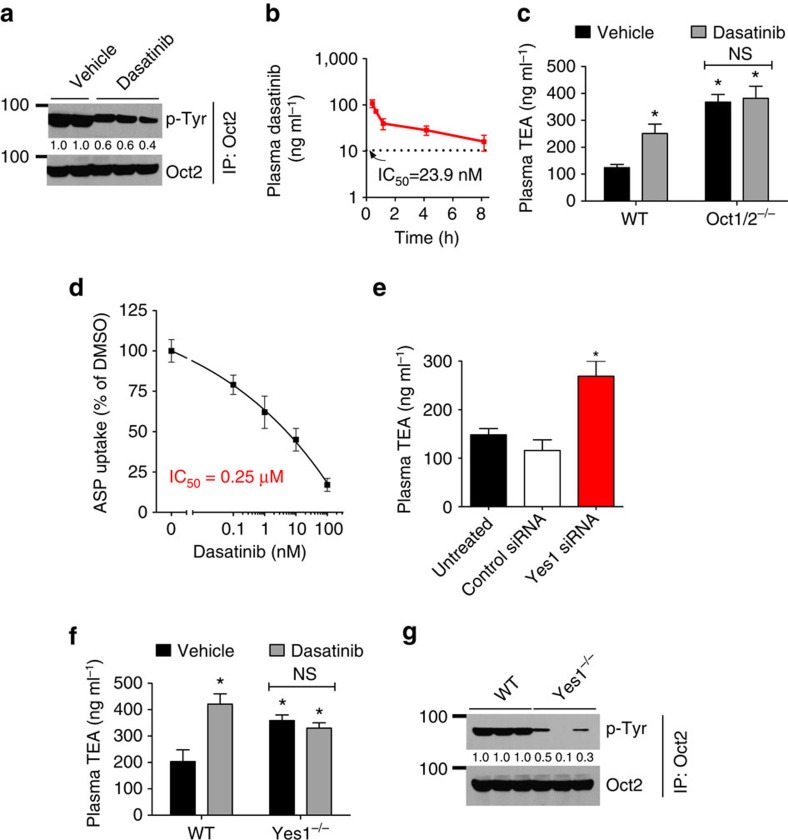
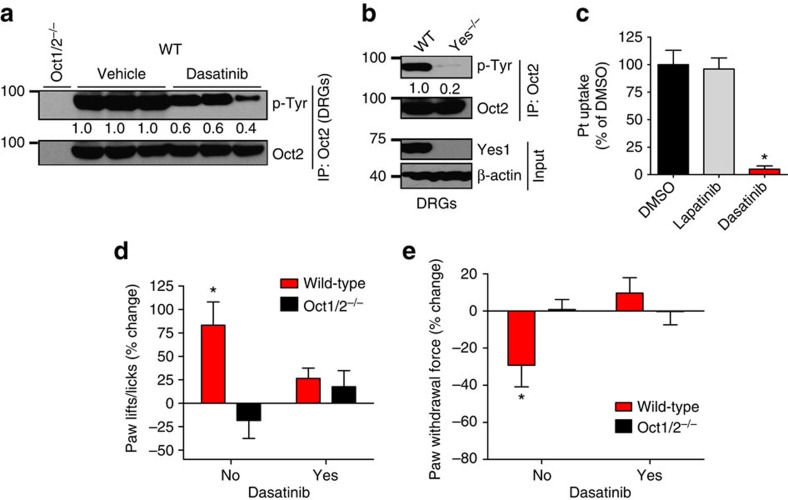
Membrane transporters are key determinants of therapeutic outcomes. They regulate systemic and cellular drug levels influencing efficacy as well as toxicities. Here we report a unique phosphorylation-dependent interaction between drug transporters and tyrosine kinase inhibitors (TKIs), which has uncovered widespread phosphotyrosine-mediated regulation of drug transporters. We initially found that organic cation transporters (OCTs), uptake carriers of metformin and oxaliplatin, were inhibited by several clinically used TKIs. Mechanistic studies showed that these TKIs inhibit the Src family kinase Yes1, which was found to be essential for OCT2 tyrosine phosphorylation and function. Yes1 inhibition in vivo diminished OCT2 activity, significantly mitigating oxaliplatin-induced acute sensory neuropathy. Along with OCT2, other SLC-family drug transporters are potentially part of an extensive 'transporter-phosphoproteome' with unique susceptibility to TKIs. On the basis of these findings we propose that TKIs, an important and rapidly expanding class of therapeutics, can functionally modulate pharmacologically important proteins by inhibiting protein kinases essential for their post-translational regulation.


Figures

Figure 1
Figure 1. Small molecule HTS of OCT2 inhibitors.
(a) Scheme depicting the assay conditions used in the primary screen for OCT2 inhibitors. HEK293-OCT2 cells were plated in 384-well plates, followed by incubation with small molecules and uptake assay using ASP as OCT2 substrate. Imipramine and DMSO were used as positive and negative controls respectively. Compounds that inhibited OCT2 activity by ≥90% were considered as active compounds. (b) Active compounds (433 out of 8,086) were categorized into distinct groups and the categories with more than 2% hits are shown here. (c) Secondary screens were carried out using Hela-OCT2 cells. These cells were preincubated with 10 μM concentration of TKIs for 15 min, followed by incubation with OCT2 substrate [14C]-TEA. Data are presented as percentage OCT2 activity (TEA uptake) as compared to DMSO group. (d) HEK293-hOCT2 and HEK293-mOct2 cells were preincubated with varying concentrations of dasatinib for 15 min, followed by incubation with 2 μM [14C]-oxaliplatin for 15 min. Data are presented as percentage OCT2 activity (oxaliplatin uptake) as compared with DMSO group. All experimental values are presented as mean±s.e.m. The height of error bar=1 s.e.
Figure 2
Figure 2. Functional regulation of OCT2 by tyrosine phosphorylation.
(a) Hela-Vector or Hela-OCT2 cells were treated with either DMSO, TKIs (1 μM) or 500 μM imipramine for 30 min. Cell lystates were then used for immunoprecipitation of FLAG-OCT2 with mouse anti-FLAG antibodies, followed by western blot analysis with rabbit phospho-tyrosine and FLAG antibodies. (b) Plasmids for OCT2 mutants were transiently transfected into Hela cells and 24 h later, uptake assays (15 min) were performed using [14C]-TEA (2 μM). TEA uptake levels were normalized to protein levels in each group. The graph represents relative OCT2 function (TEA uptake) as compared with wild-type OCT2 transfected group. (c,d) Plasmids for indicated OCT2 mutants were transiently transfected into Hela cells and 24 h later, uptake assays were performed using varying concentration of [14C]-TEA. TEA uptake levels were normalized to protein levels in each group and graphs represent Michaelis–Menten kinetics and calculated ratio of Km/Vmax values, which are indicative of transporter activity. (e) Hela cells were transiently transfected with indicated FLAG-tagged OCT2 constructs, followed by immunopreicipation with anti-FLAG bead conjugated antibodies and western blot analysis by FLAG and phosphotyrosine antibodies. (f) Hela cells were transiently transfected with indicated plasmids, followed by TEA uptake assays in the presence of DMSO or 1 μM dasatinib. * indicates statistically significant as compared to respective DMSO treated group (Student's t-test). All experimental values are presented as mean±s.e.m. The height of error bar=1 s.e.
Figure 3
Figure 3. Functional regulation of OCT2 by tyrosine phosphorylation.
(a) Scheme depicting the assay conditions used in the primary siRNA kinome screen to identify an OCT2 phosphorylating kinase. HEK293-OCT2 cells were reverse transfected with the siRNA library and plated in 384-well plates, followed by incubation functional uptake and viability assays. (b) Positive hits from the primary screen. Only the tyrosine kinase hits (indicated in red) were used for secondary screens. (c) Schematic representation of secondary screens: deconvoluted screen using Dharmacon siRNA and Sigma siRNA screen. The siRNA that inhibited OCT2 function to at least 75% are indicated in red. (d) Hela-OCT2 cells were transfected with either wild-type or dasatinib resistant KDR, LYN or Yes1 plasmids and 24 h later, [14C]-TEA uptake assays were performed in the presence or absence of varying concentrations of dasatinib. The graph represents relative OCT2 function ([14C]-TEA uptake) as compared with DMSO group for each plasmid. (e) Hela-OCT2 cells were transfected with Sigma siRNA (scrambled control or Yes1) and 48 h later, OCT2 was immunoprecipitated to determine its tyrosine phosphorylation. Whole-cell lysate was used to confirm Yes1 knockdown.
Figure 4
Figure 4. Yes1-mediated regulation of OCT2 tyrosine phosphorylation.
(a) Schematic representation of Yes1 protein (upper panel) showing the SH3 domain. The lower panel shows the putative proline-rich SH3 binding sequence in OCT2. (b) Endogenous Yes1 was immunoprecipitated from Hela-Vector and Hela-OCT2 cell lysates using a mouse anti-Yes1 antibody, followed by western blot analysis with rabbit anti-FLAG and Yes1 antibodies. (c) Plasmids for OCT2 mutants were transiently transfected into Hela cells and 24 h later, uptake assays (15 min) were performed using [14C]-TEA (2 μM) or [14C]-metformin (50 μM). The uptake levels were normalized to protein concentration in each group. The graph represents relative OCT2 function (TEA or metformin uptake) as compared to wild-type OCT2 transfected group. * indicates statistically significant as compared with wild-type group (P<0.05, Student's t-test). (d) Hela cells were transiently transfected with indicated FLAG-tagged OCT2 constructs, followed by immunopreicipation with anti-FLAG antibodies and western blot analysis by FLAG and phosphotyrosine antibodies. (e) Proposed model of Yes1 and OCT2 interaction. (f) Plasmids for OCT1 and OCT3 mutants were transiently transfected in Hela cells and 24 h later, uptake assays (15 min) were performed using [14C]-TEA (2 μM). The uptake levels were normalized to protein concentration and the graph represents relative OCT2 function (TEA uptake) as compared with respective wild-type group. * indicates statistically significant as compared to wild-type group (P<0.05, Student's t-test). All experimental values are presented as mean±s.e.m. The height of error bar=1 s.e.
Figure 5
Figure 5. OCT2 tyrosine phosphorylation and functional regulation in vivo.
(a) Wild-type FVB mice were injected with either vehicle or dasatinib (15 mg kg−1, p.o.) and 30 min later, the mice were euthanized and the kidneys were collected. Kidney tissue lysates were then used to immunoprecipitate endogenous Oct2 followed by western blot analysis by phosphotyrosine and Oct2 antibodies. (b) Male FVB mice were injected with dasatinib (15 mg kg−1) followed by pharmacokinetic analysis of dasatinib levels in the plasma. (c) Wild-type and Oct1/2−/− mice were injected with either vehicle or dasatinib (15 mg kg−1, p.o.) and 30 min later they were injected with 0.2 mg kg−1 [14C]-TEA (i.v.), followed by plasma collection at 5 min. The graph represents plasma TEA levels from n=5 mice per group. * indicates statistically significant as compared with wild-type vehicle group (P<0.05, Student's t-test). (d) Isolated renal tubules were coincubated with dasatinib in the presence of the OCT2 substrate ASP (30 min), and relative uptake was measured compared with control group. (e) Wild-type FVB mice were injected with either control or Yes1 siRNA by hydrodynamic tail-vein injection (25 μg in 0.5 ml of PBS). Three days later, the mice were injected i.v. with a 0.2 mg kg−1 dose of [14C]-TEA, and plasma levels of TEA were measured at 5 min (n=5 mice per group). Kidneys were also collected to determine Yes1 knockdown. (f) Wild-type and Yes1−/− mice (n=5) were injected with 0.2 mg kg−1 [14C]-TEA (i.v.) and plasma levels of TEA were measured at 5 min. (g) Kidney tissue lysates from wild-type and Yes1−/− were used to immunoprecipitate endogenous Oct2 followed by western blot analysis by phosphotyrosine and Oct2 antibodies. All experimental values are presented as mean±s.e.m. The height of error bar=1 s.e.
Figure 6
Figure 6. Yes1 inhibition mitigates Oct2-dependent oxaliplatin neurotoxicity.
(a) Wild-type FVB mice were injected with vehicle and the Oct1/2−/− mice were injected with either vehicle or dasatinib (15 mg kg−1, p.o.) and 30 min later, DRGs were collected. DRG lysates were then used to immunoprecipitate endogenous Oct2 followed by western blot analysis by phospho-tyrosine and Oct2 antibodies. (b) DRGs were collected from Wild-type and Yes1−/− mice. The upper panel shows representative blots from experiments where DRG lysates were used to immunoprecipitate endogenous Oct2 followed by western blot analysis by phospho-tyrosine and Oct2 antibodies. The lower panel shows western blot results from total DRG lysates showing that Yes1 is expressed in DRGs in the wild-type mice. (c) DRGs were collected from Wild-type FVB mice, followed by satellite cell isolation and culture. The primary satellite cells were then plated in six-well plates followed by oxaliplatin uptake assays in the presence of DMSO, lapatinib or Dasatinib (30 min). The graph represents relative oxaliplatin uptake as compared to DMSO group. * indicates a statistically significant difference compared with the DMSO group. (d) Sensitivity to cold associated with a single dose of oxaliplatin (40 mg kg−1) in wild-type mice pretreated with vehicle or dasatinib (15 mg kg−1, p.o.) as determined by a cold-plate test. The number of paw lifts or licks at baseline and following exposure to a temperature of −4 °C for 5 min at 24 h after drug administration was determined (n=5). The graph represents relative percentage change in paw lifts/licks as compared with baseline values. (e) Mechanical allodynia associated with a single dose of oxaliplatin (40 mg kg−1) in wild-type mice pretreated with vehicle or dasatinib (15 mg kg−1, p.o.), as determined by a Von Frey Hairs test. The force required to induce paw withdrawal in grams (g) at baseline was measured following 24 h after drug administration (n=5). The graph represents relative percentage change in paw withdrawal force as compared to baseline values. * indicates a statistically significant difference as compared with the baseline (untreated) values. All experimental values are presented as mean±s.e.m. The height of error bar=1 s.e.

References

    1. Singer S. J. & Nicolson G. L. The fluid mosaic model of the structure of cell membranes. Science 175, 720–731 (1972). - PubMed
    1. Grecco H. E., Schmick M. & Bastiaens P. I. Signaling from the living plasma membrane. Cell 144, 897–909 (2011). - PubMed
    1. Kaback H. R., Sahin-Toth M. & Weinglass A. B. The kamikaze approach to membrane transport. Nat. Rev. Mol. Cell Biol. 2, 610–620 (2001). - PubMed
    1. Borst P. & Elferink R. O. Mammalian ABC transporters in health and disease. Annu. Rev. Biochem. 71, 537–592 (2002). - PubMed
    1. He L., Vasiliou K. & Nebert D. W. Analysis and update of the human solute carrier (SLC) gene superfamily. Hum. Genomics. 3, 195–206 (2009). - PMC - PubMed

Publication types

MeSH terms

Substances